frequency bands
4 patterns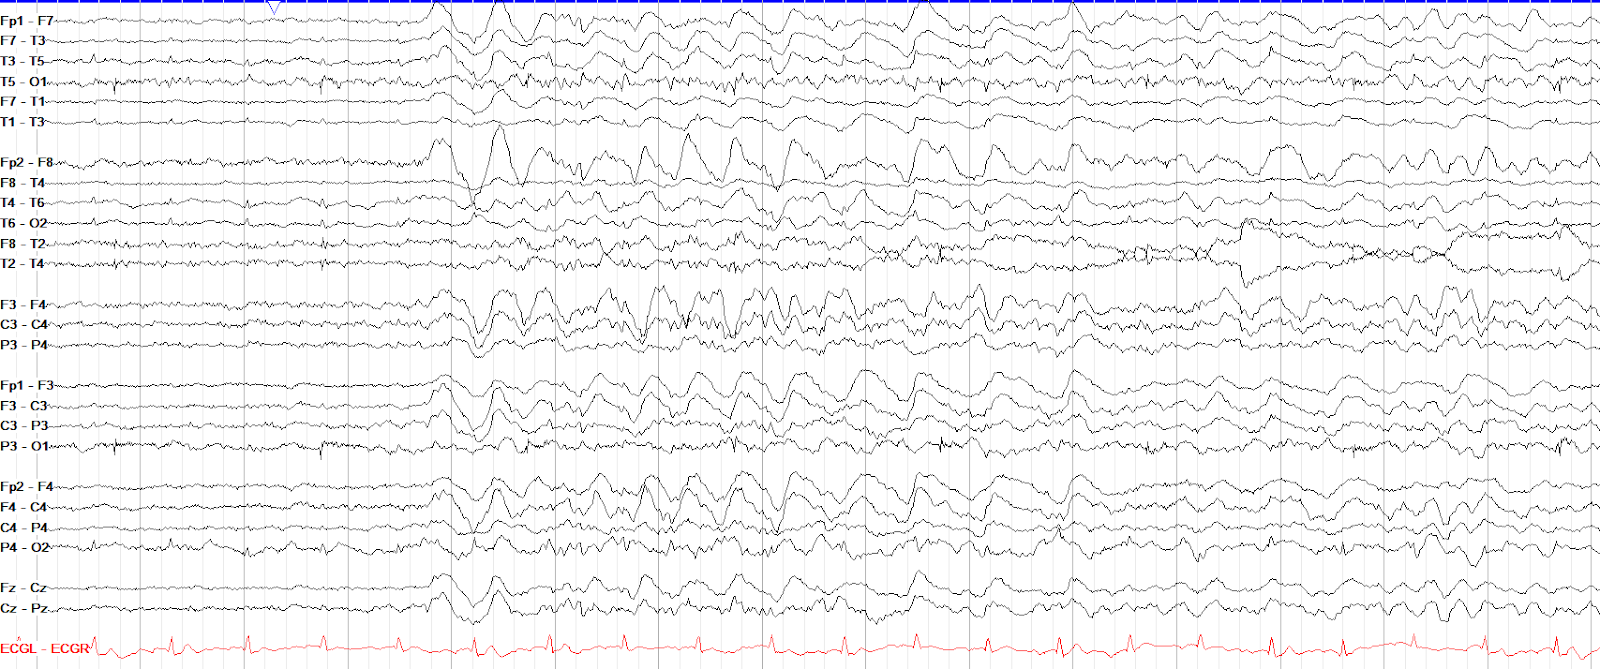
Delta frequency ranges from 0-4 Hz and should not normally be seen in the awake adult state. Here we see the onset of frontal intermittent rhythmic delta activity (FIRDA), discussed in the non-epileptiform abnormalities section.
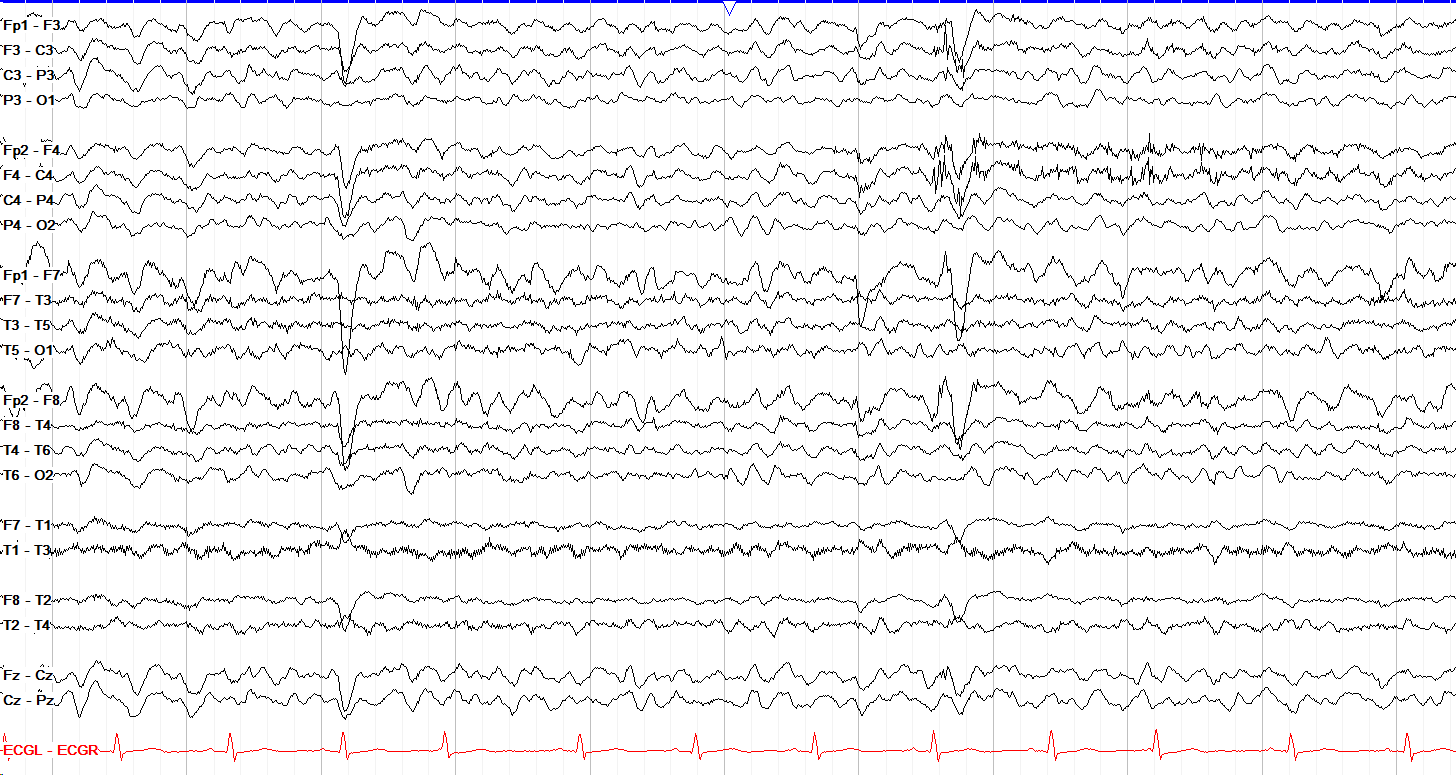
Theta frequency ranges from 4 - 8 Hz. This example shows a diffuse mostly 5-6 Hz theta that is abnormal (see abnormal backgrounds section). Theta is also commonly seen temporally when drowsy, termed rhythmic mid-temporal theta of drowsiness (RMTD).
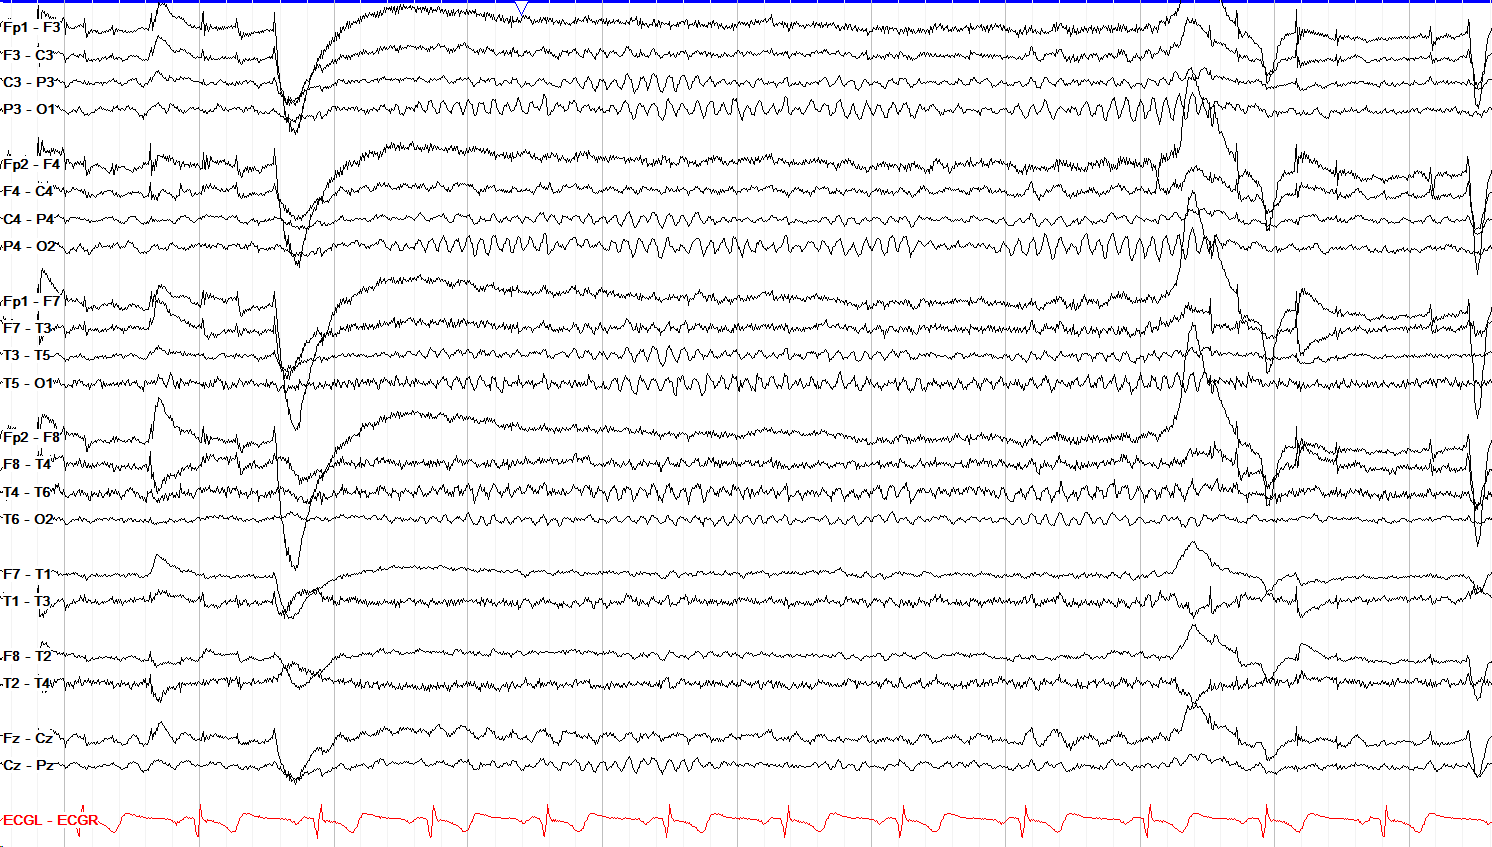
Alpha frequency ranges from 8 - 13 Hz. It is the dominant frequency of the posterior regions in a healthy awake adult (see the PDR section on the normal awake page).
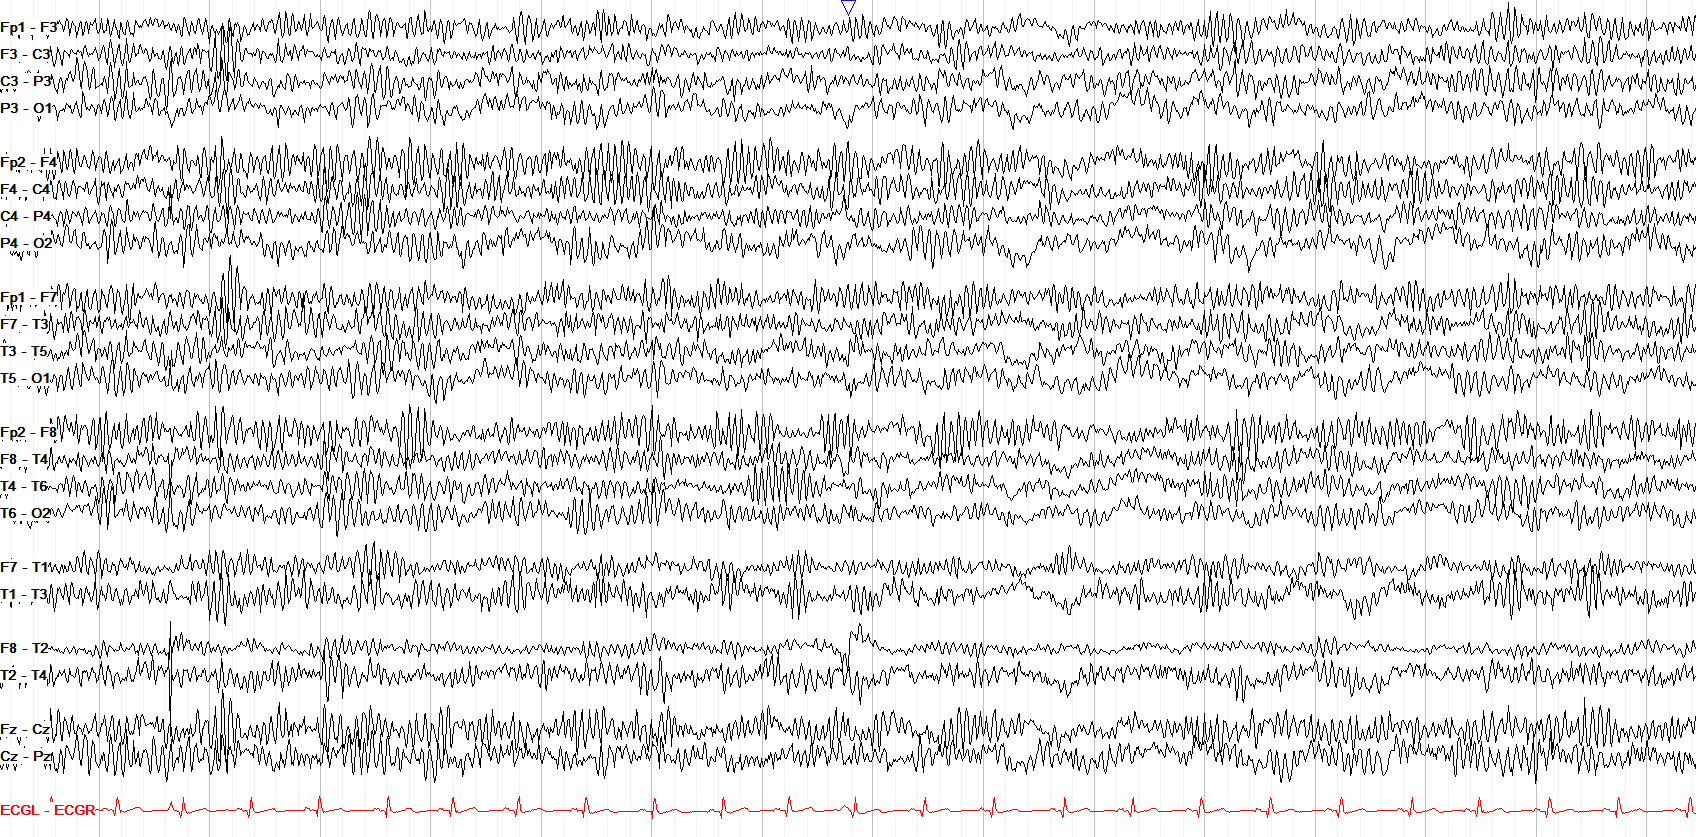
Beta frequency is >13 Hz, and is typically best seen in the frontal regions during active cortical processing. Among multiple frequencies on this page, the most prominent is a diffuse and excessive beta activity; such prominent diffuse beta is commonly seen in the setting of benzodiazepine use (see non-epileptiform abnormalities section).
morphology patterns
4 patterns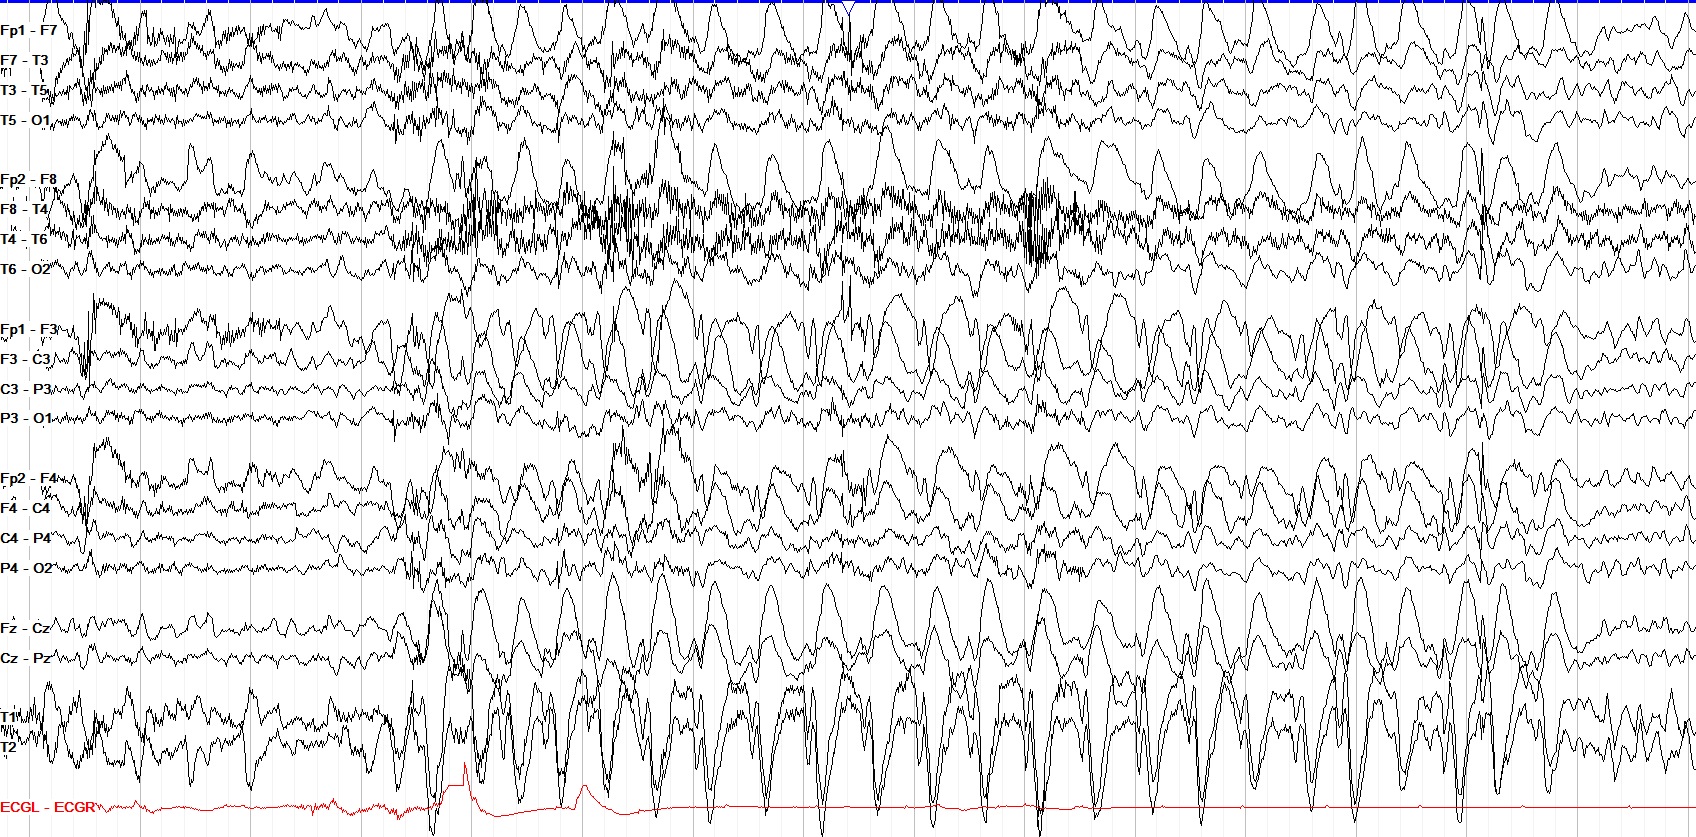
This high amplitude delta activity is monomorphic because each waveform looks essentially just like the ones around it, sharing morphology, amplitude and frequency. This is in fact a seizure, highlighting that monomorphic (rhythmic & periodic) activity can be very suspicious for epileptiform activity or seizures and lie on the ictal-interictal continuum (IIC), discussed in the epileptiform abnormalities section.
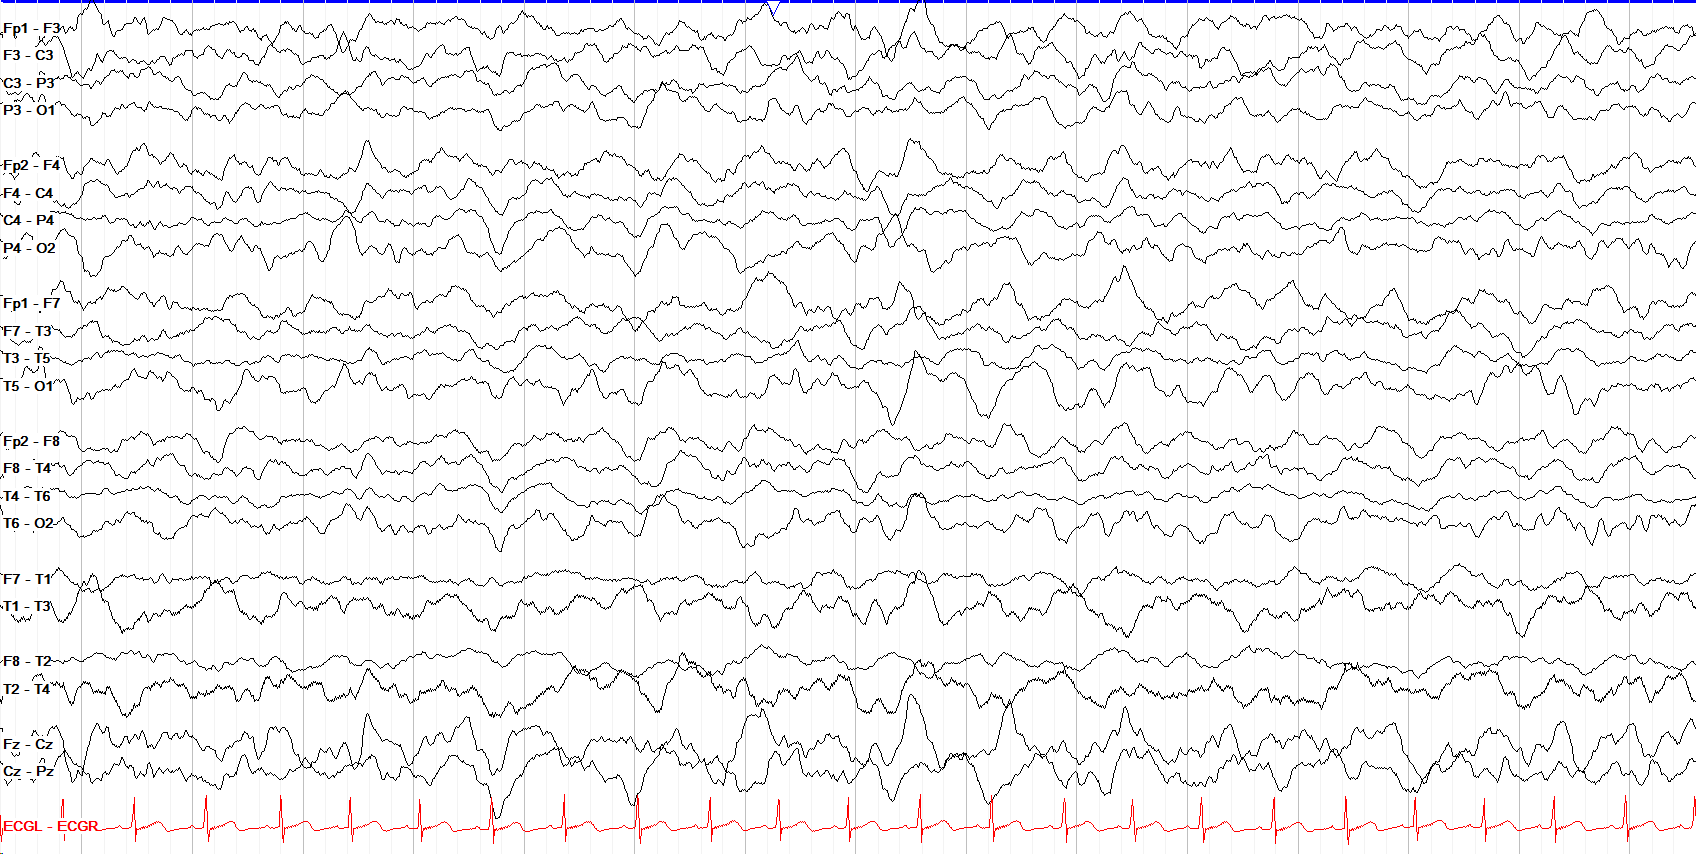
Polymorphic activity must vary in frequency, amplitude and morphology. Here we see polymorphic delta activity that is characteristic of slow wave sleep.
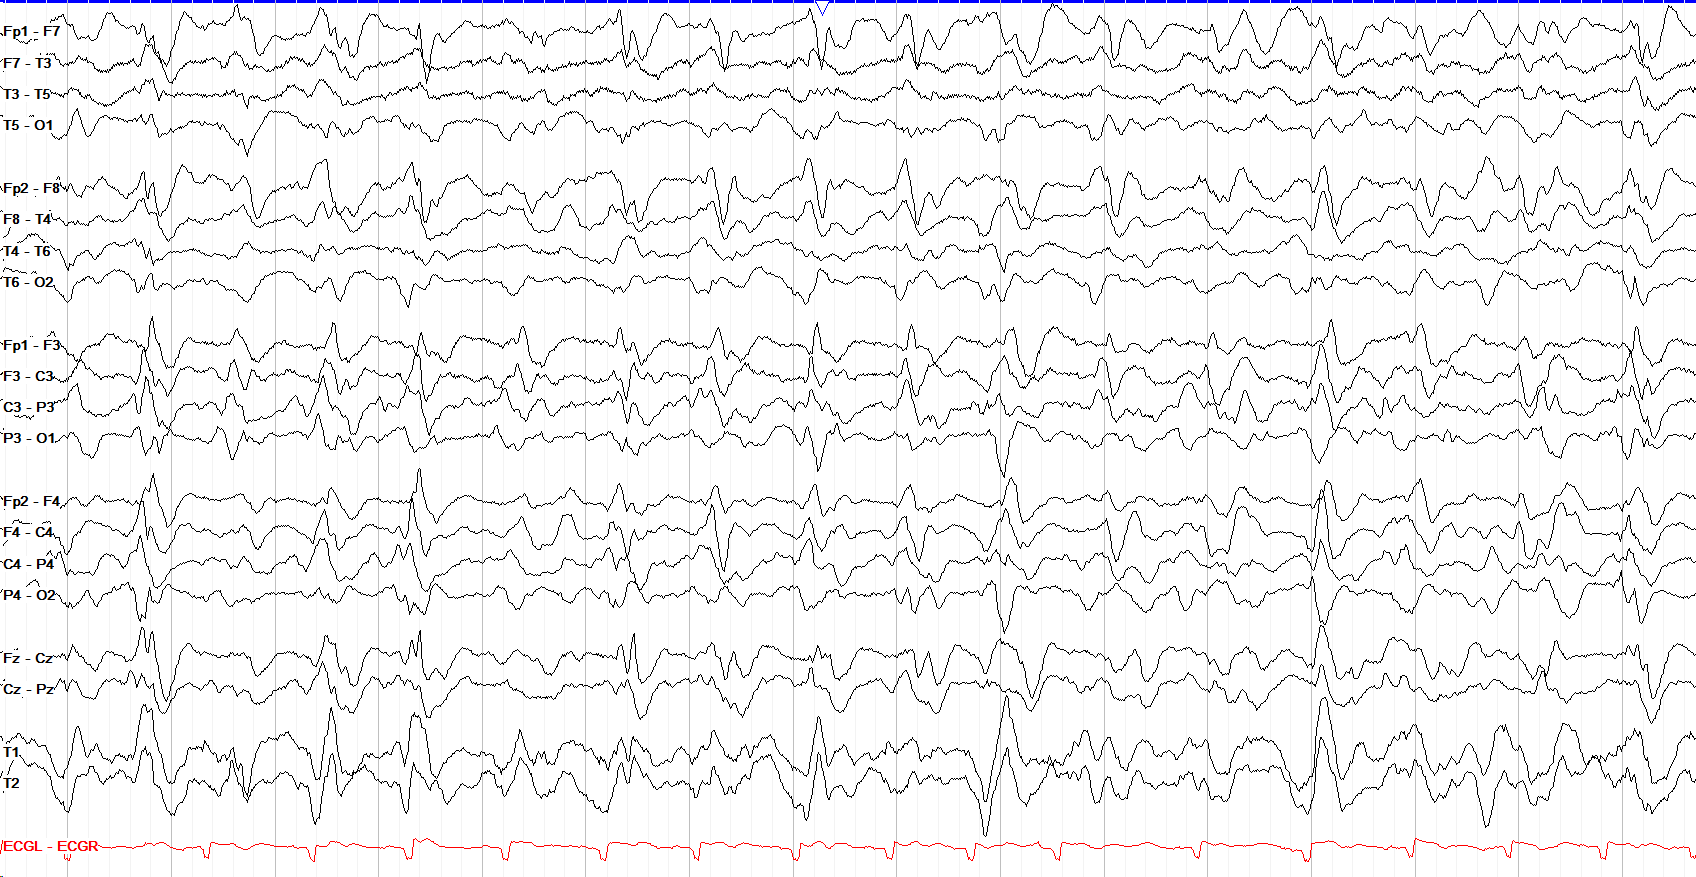
Periodic patterns are a series of discrete, individual monomorphic discharges that repeat at least six times. When periodic patterns are lateralized they suggest seizure risk; while generalized patterns (as in this example) can too, they’re often seen with more nonspecific dysfunction.
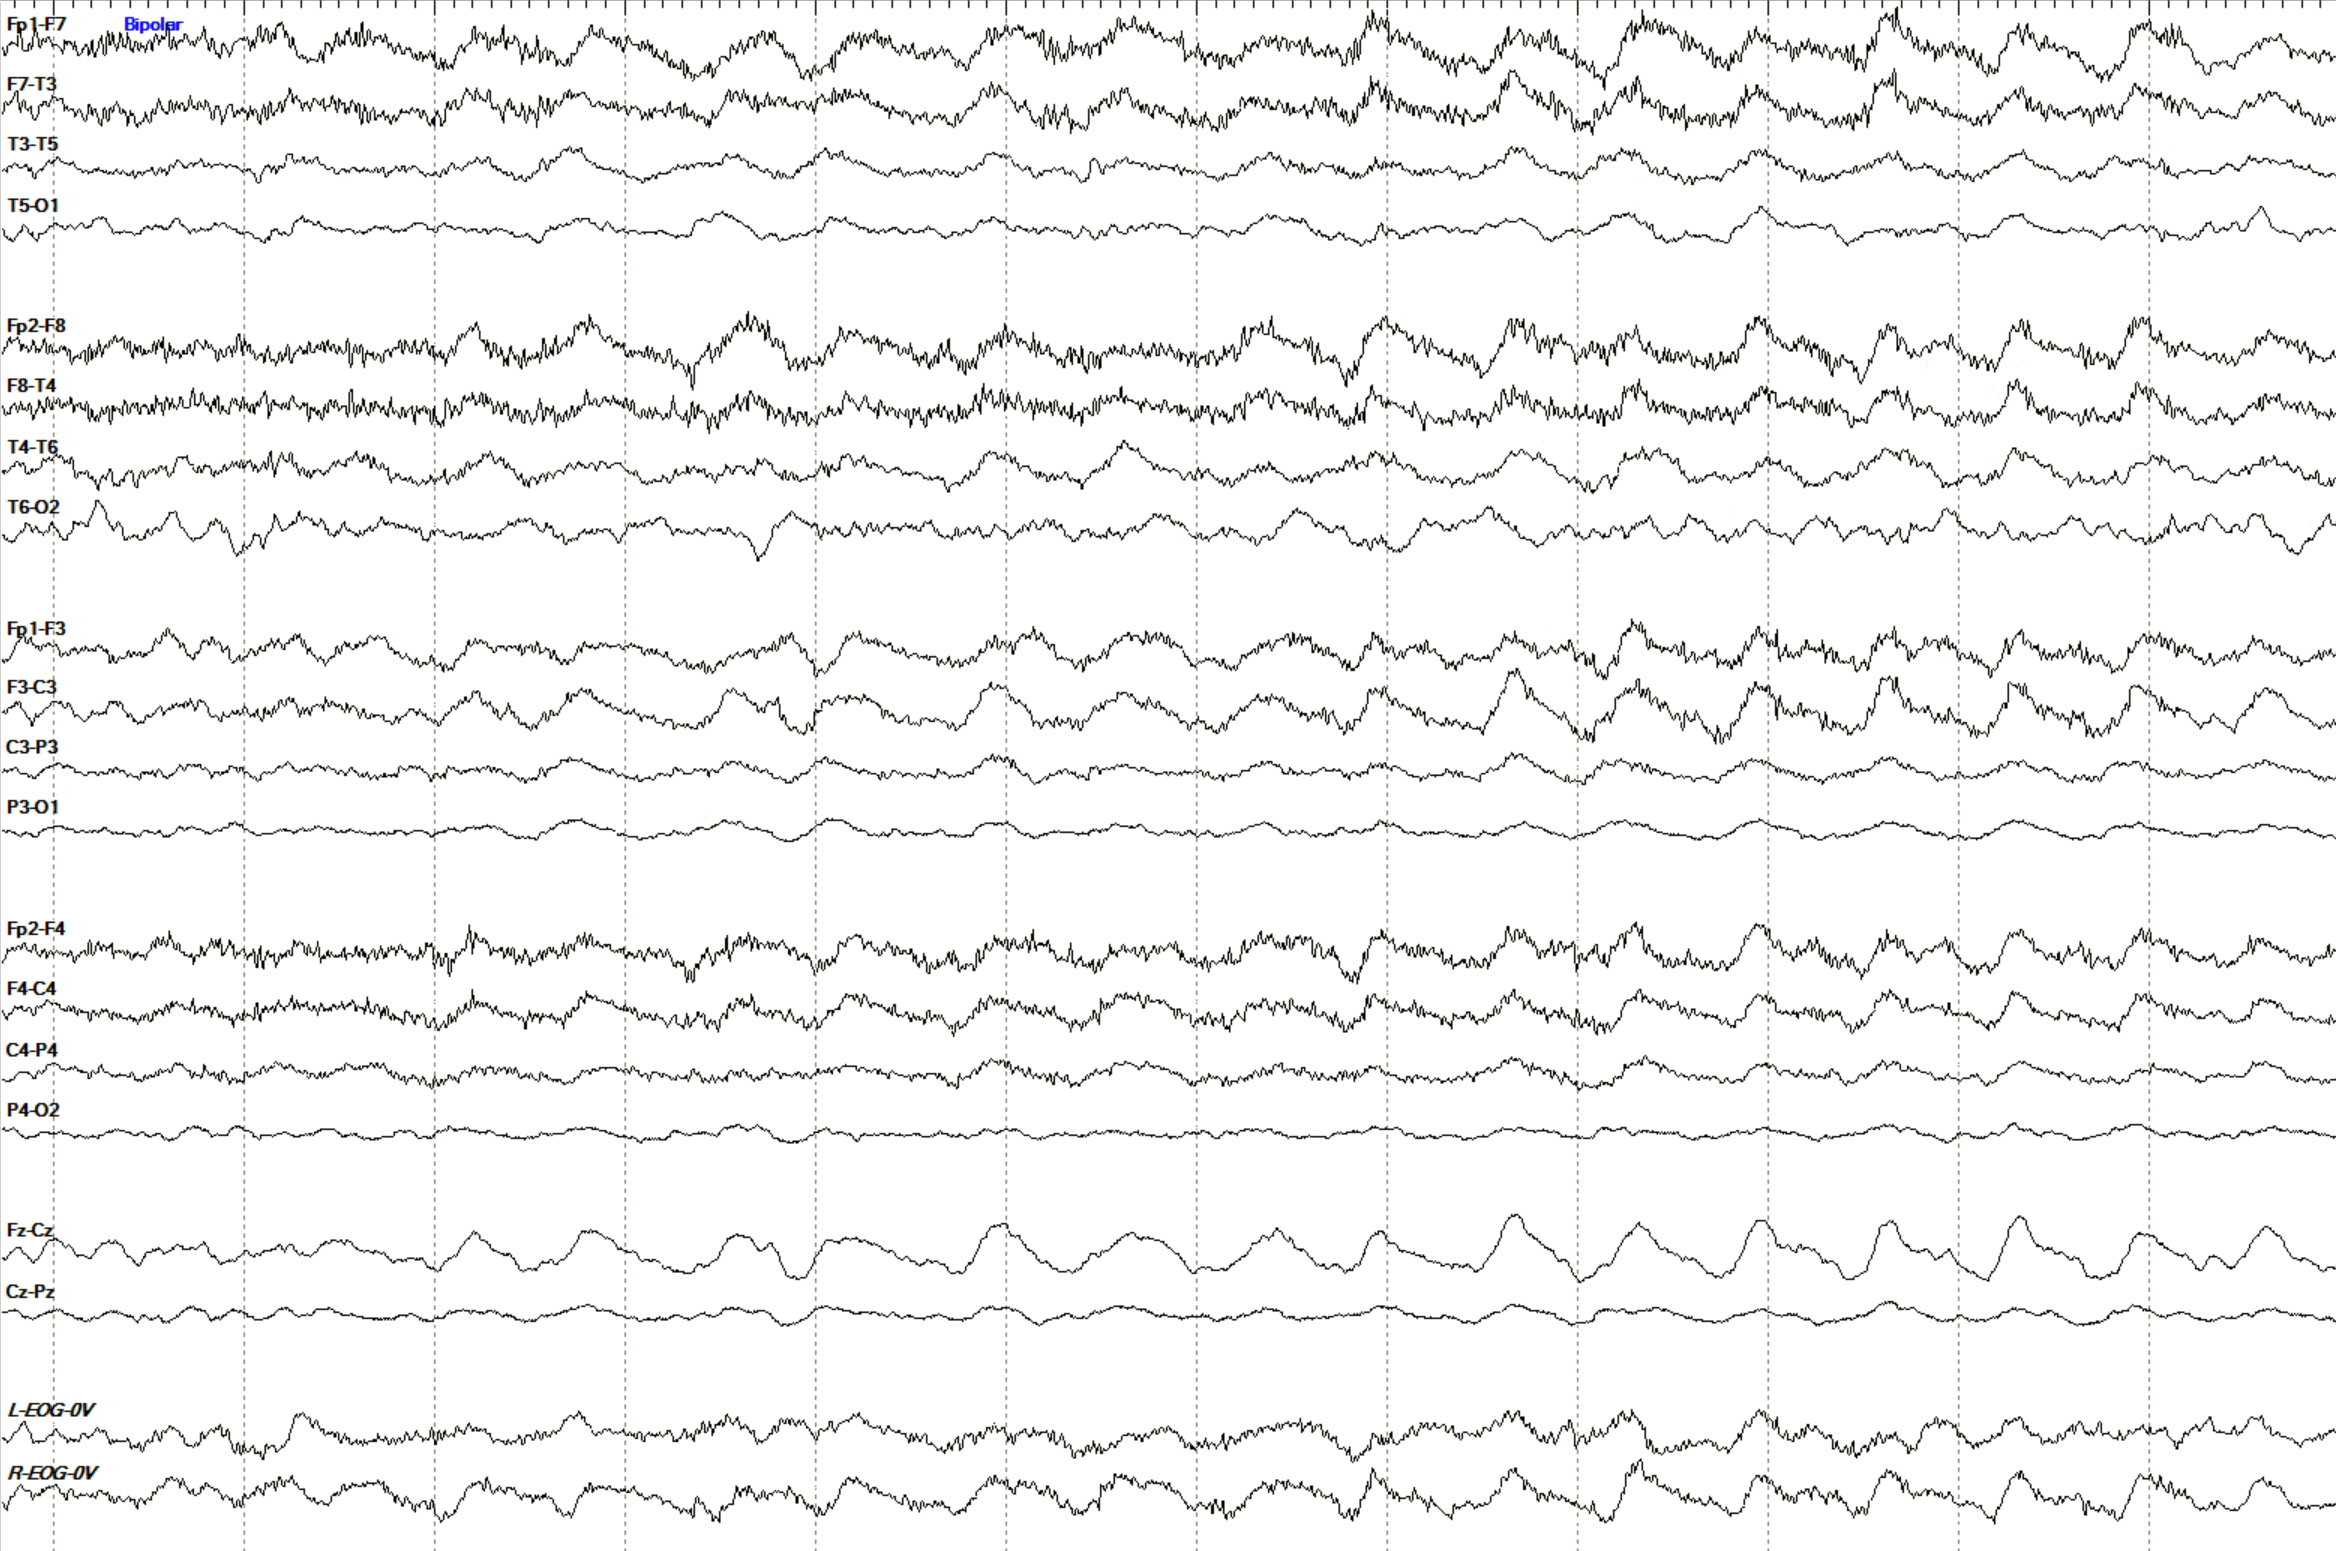
Rhythmic patterns are a series of continuing monomorphic waveforms, each flowing into the next, that repeat at least six times. Here we see frontally predominant delta-frequency rhythmicity; this type of pattern is commonly seen with encephalopathy.
PDR examples
6 patterns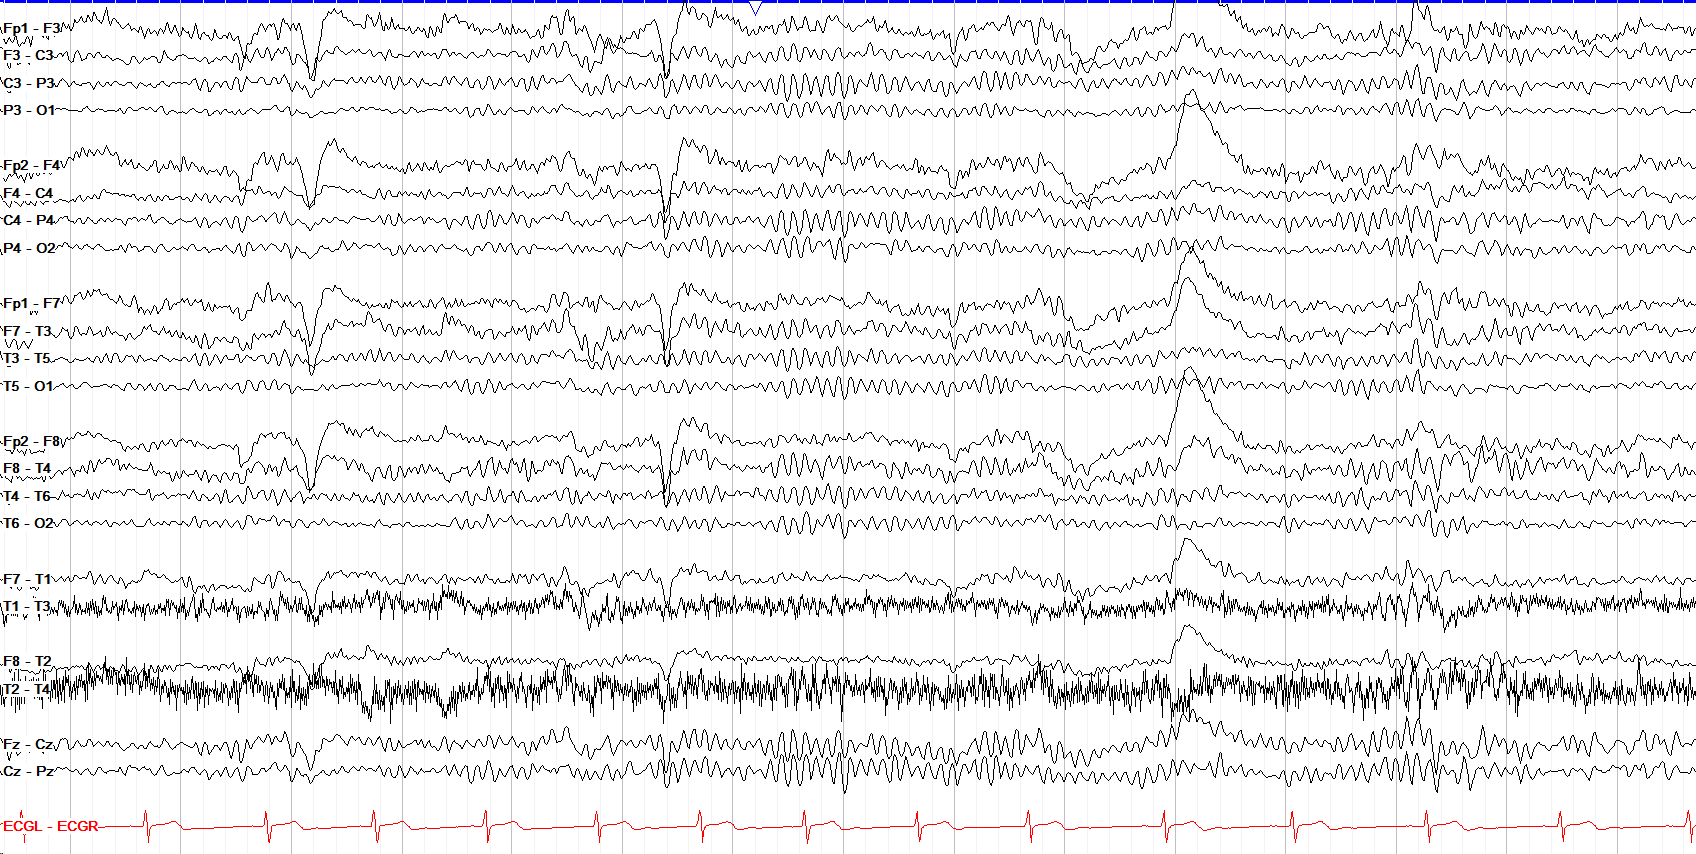
This tracing shows a clear, crisp 10 Hz PDR, best seen in the middle section upon eye closure (eye closure is the large positive deflection in the 6th second of the page)
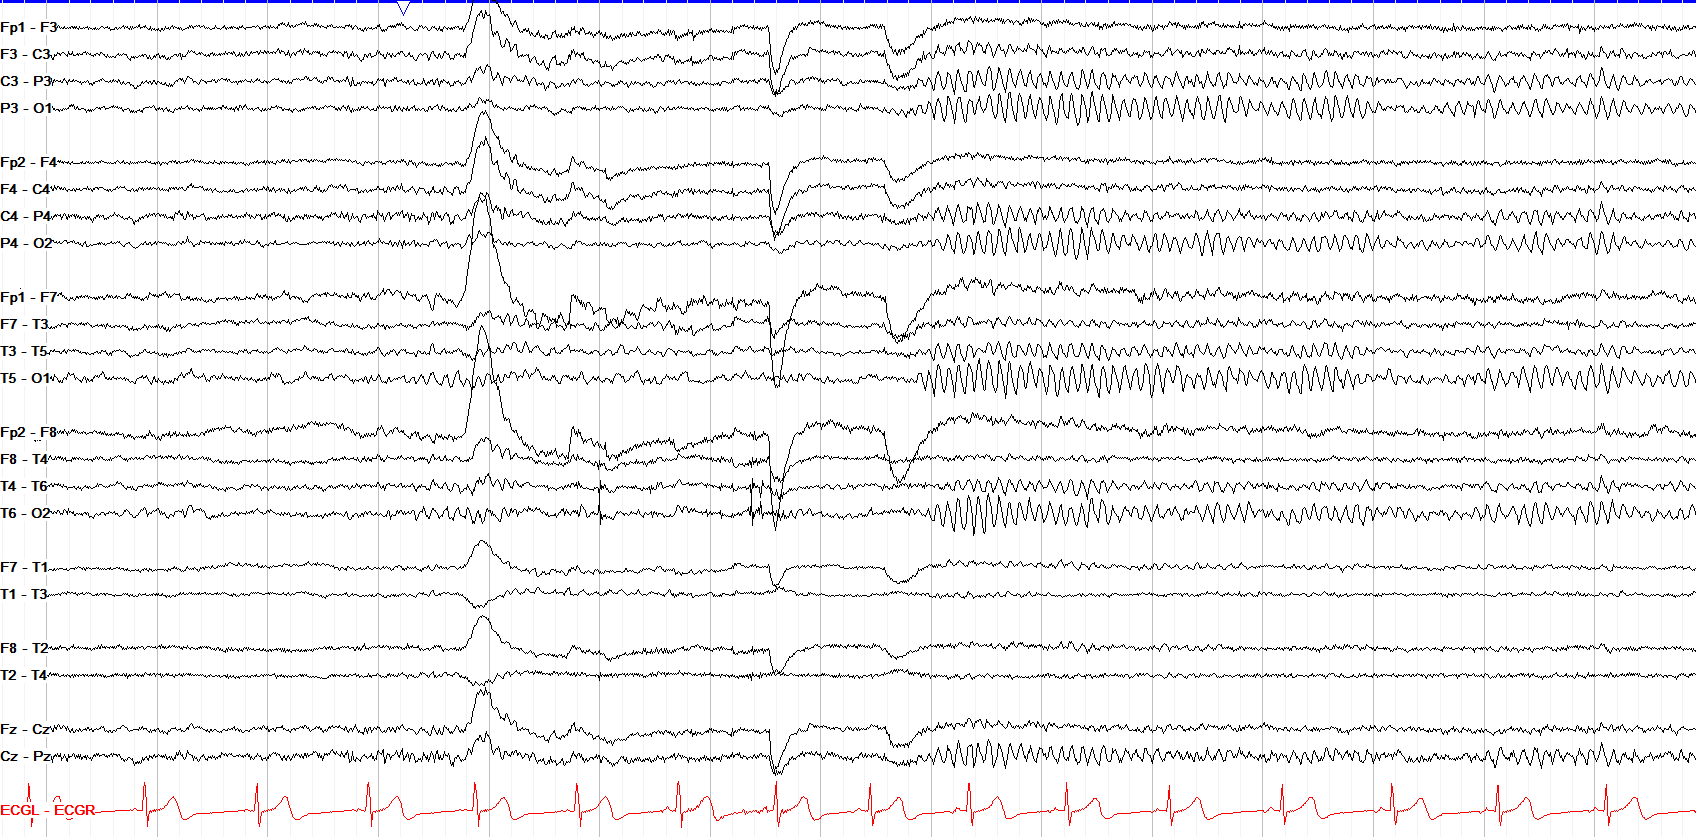
Note the excellent anterior-posterior gradient with faster, lower amplitude frequencies in the front and slower, higher amplitude frequencies in the back, and the clear PDR on eye closure
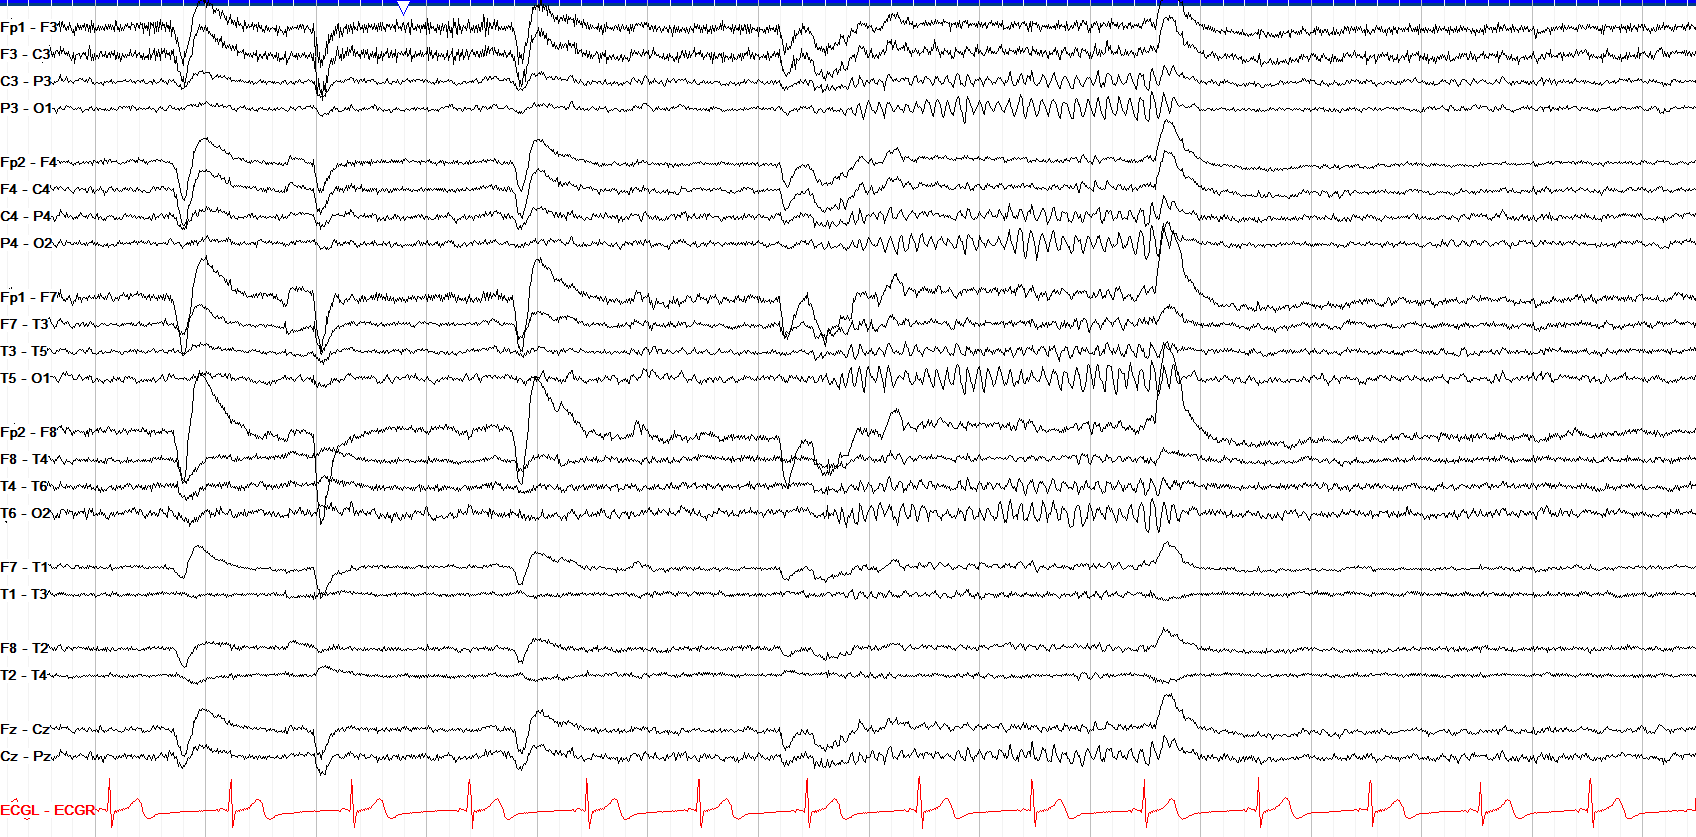
This shows a good anterior-posterior gradient, eye blinks, and PDR emergence with eye closure and recession with eye opening. There is also some myogenic artifact over the frontal regions
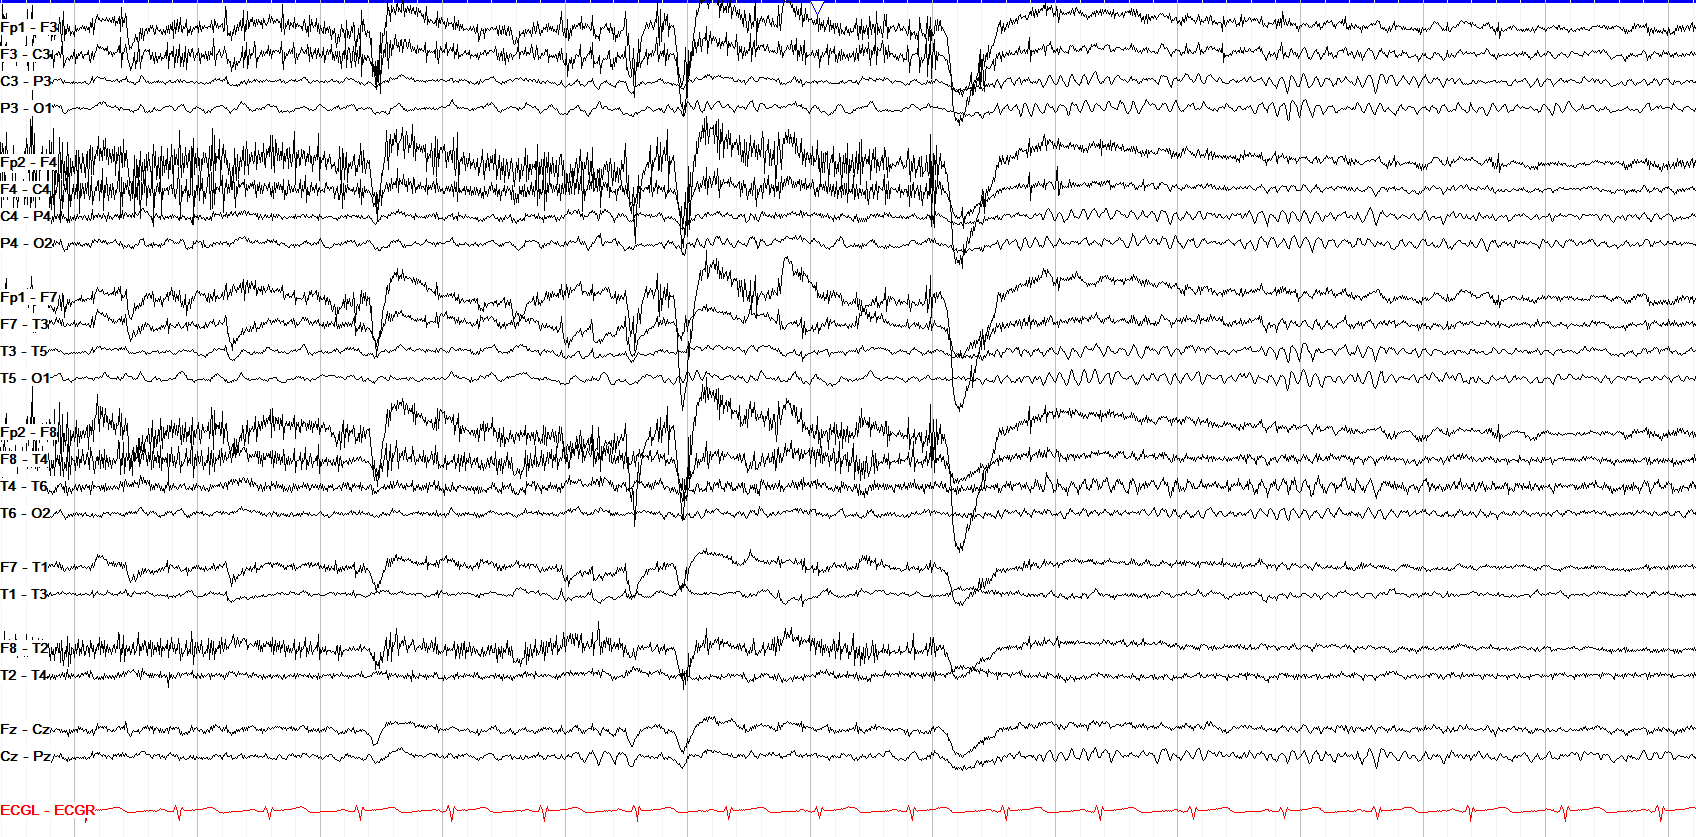
Another example of frontal myogenic artifact, seen in the first half of the tracing, and PDR with eye closure. Lateral eye movements are seen as opposing waveforms in the bilateral frontopolar electrodes
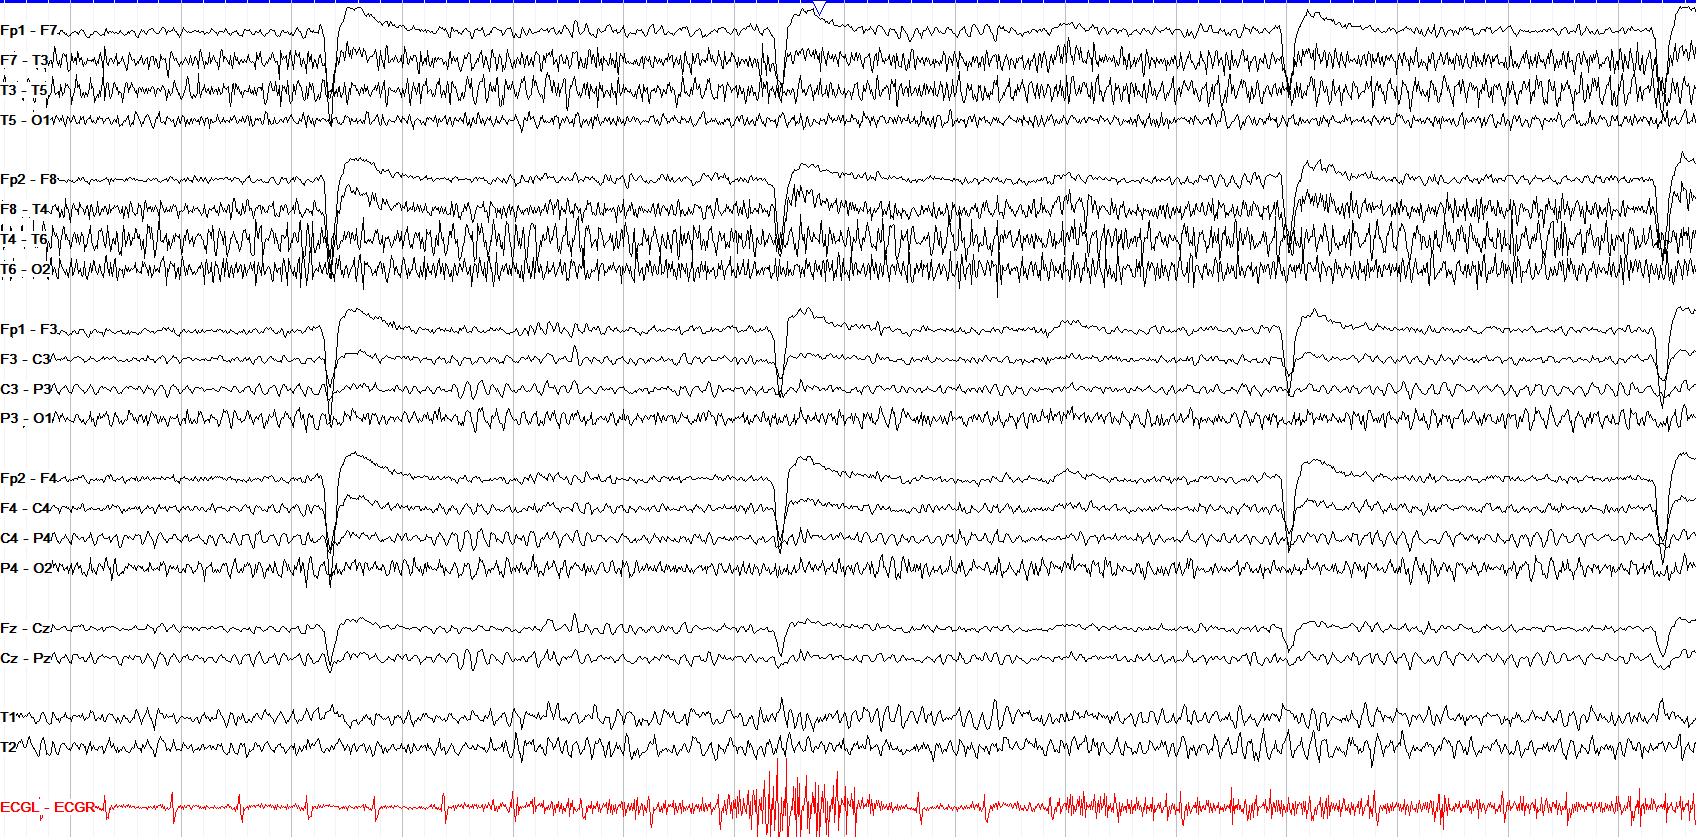
Often, overriding frequencies can make the PDR less clear than the examples above, as in this case where faster frequencies, likely myogenic artifact, cover much of the temporal chains
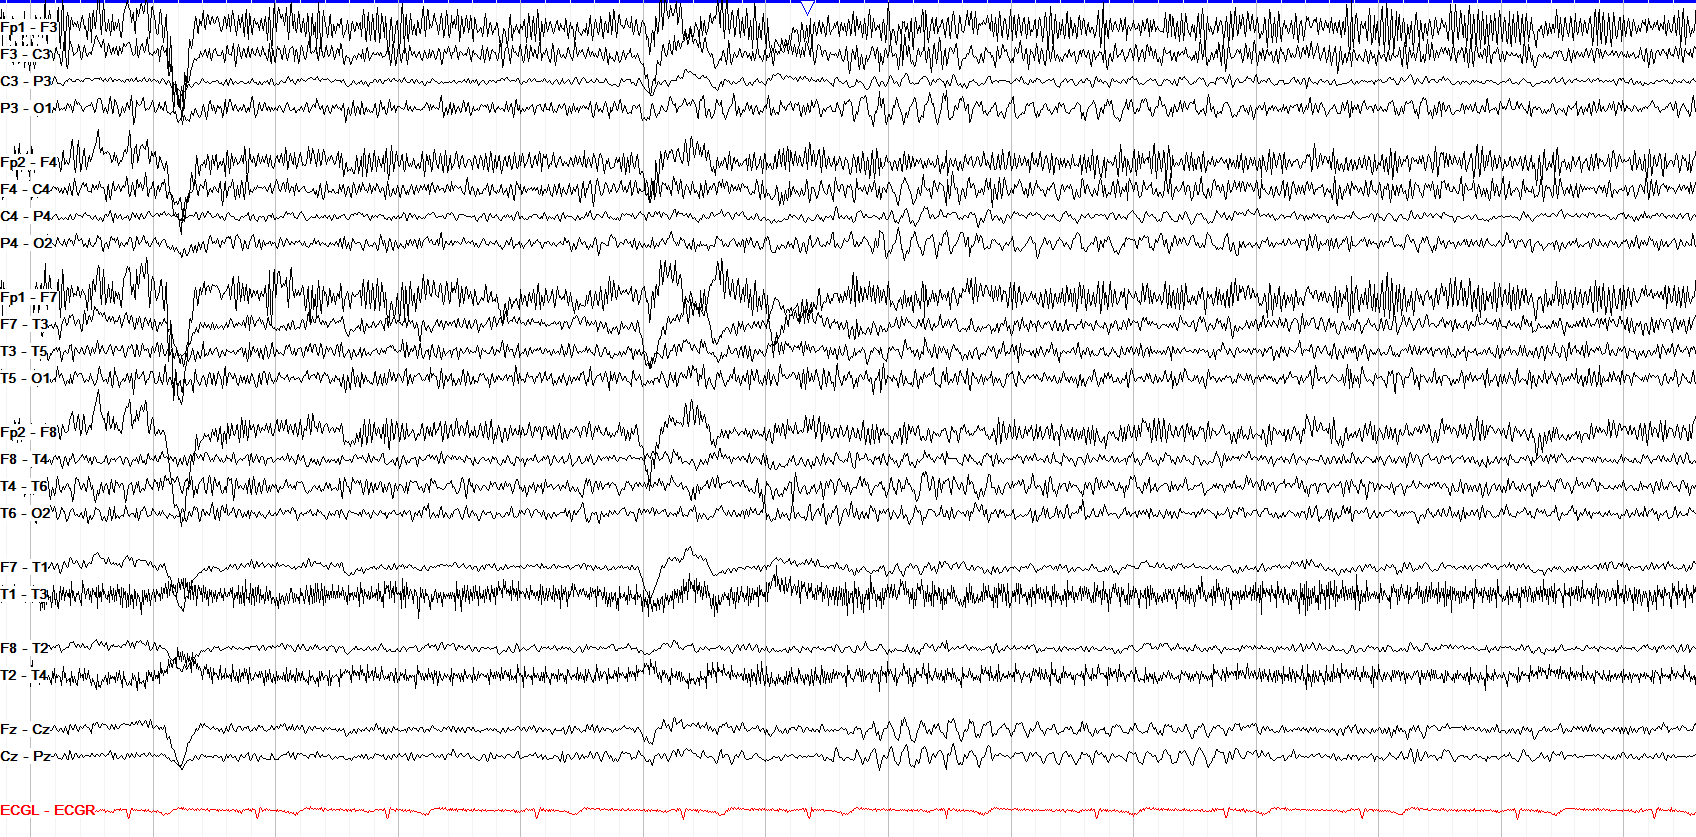
Diffuse frontal fast activity across all the chains here is indicative of myogenic artifact, and there are eye blink artifacts suggestive of wakefulness. However, the PDR doesn't exceed 7-8 Hz, so this tracing is a bit slower than what a normal awake one should show.
awake & drowsy states
6 patterns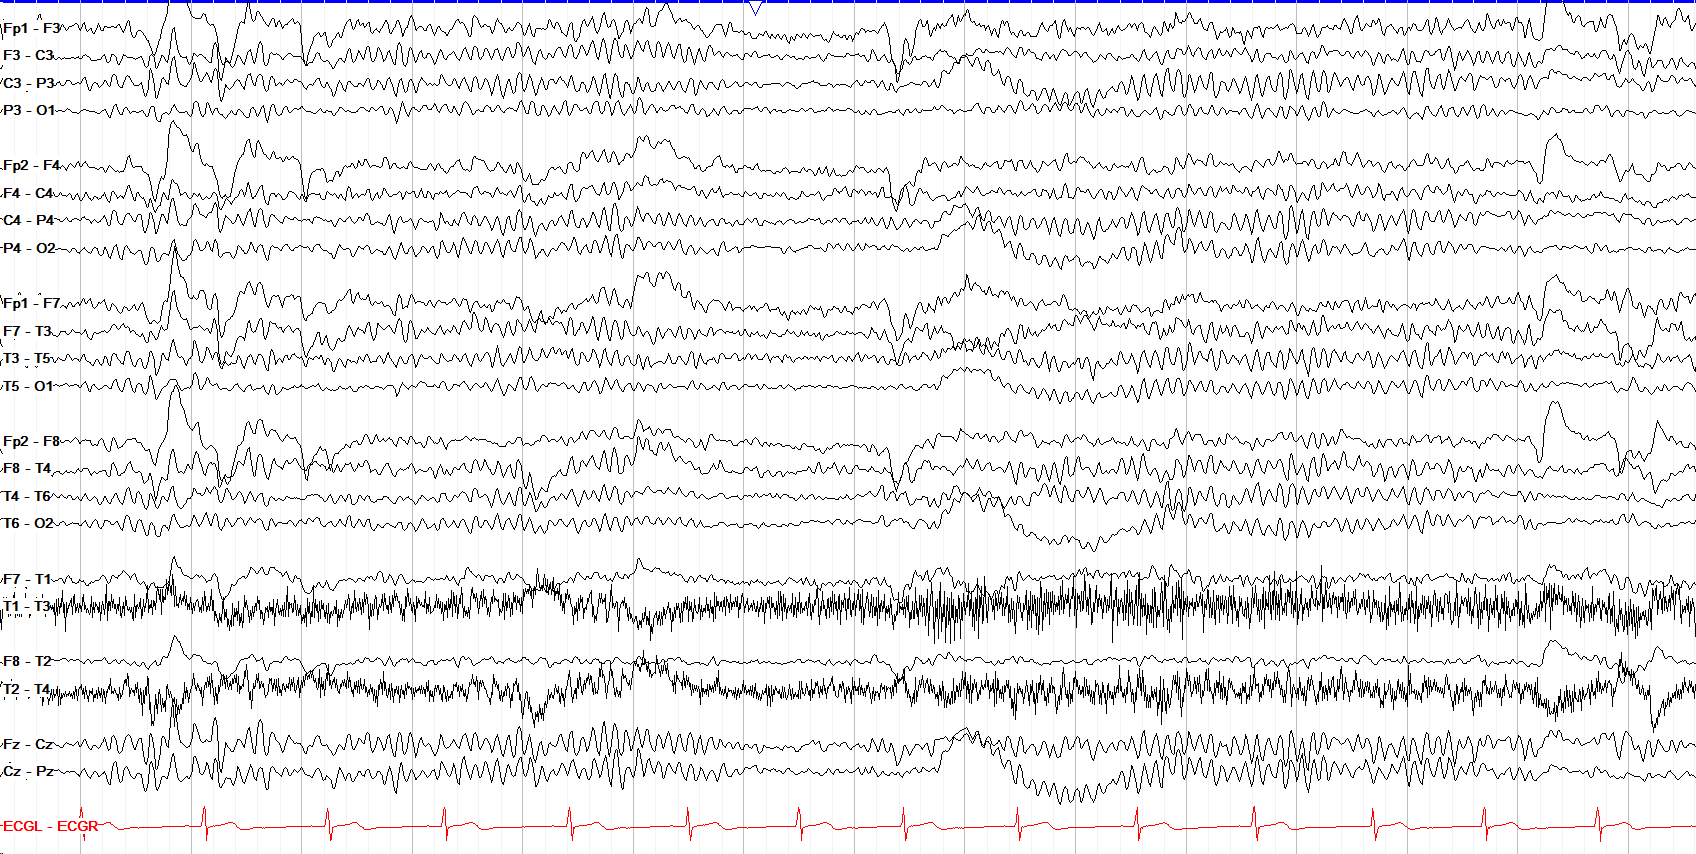
This is a good example of several key features of a normal awake background: a normal AP gradient, good PDR that emerges with eye closure, multiple eye blinks, and movement/myogenic artifact.
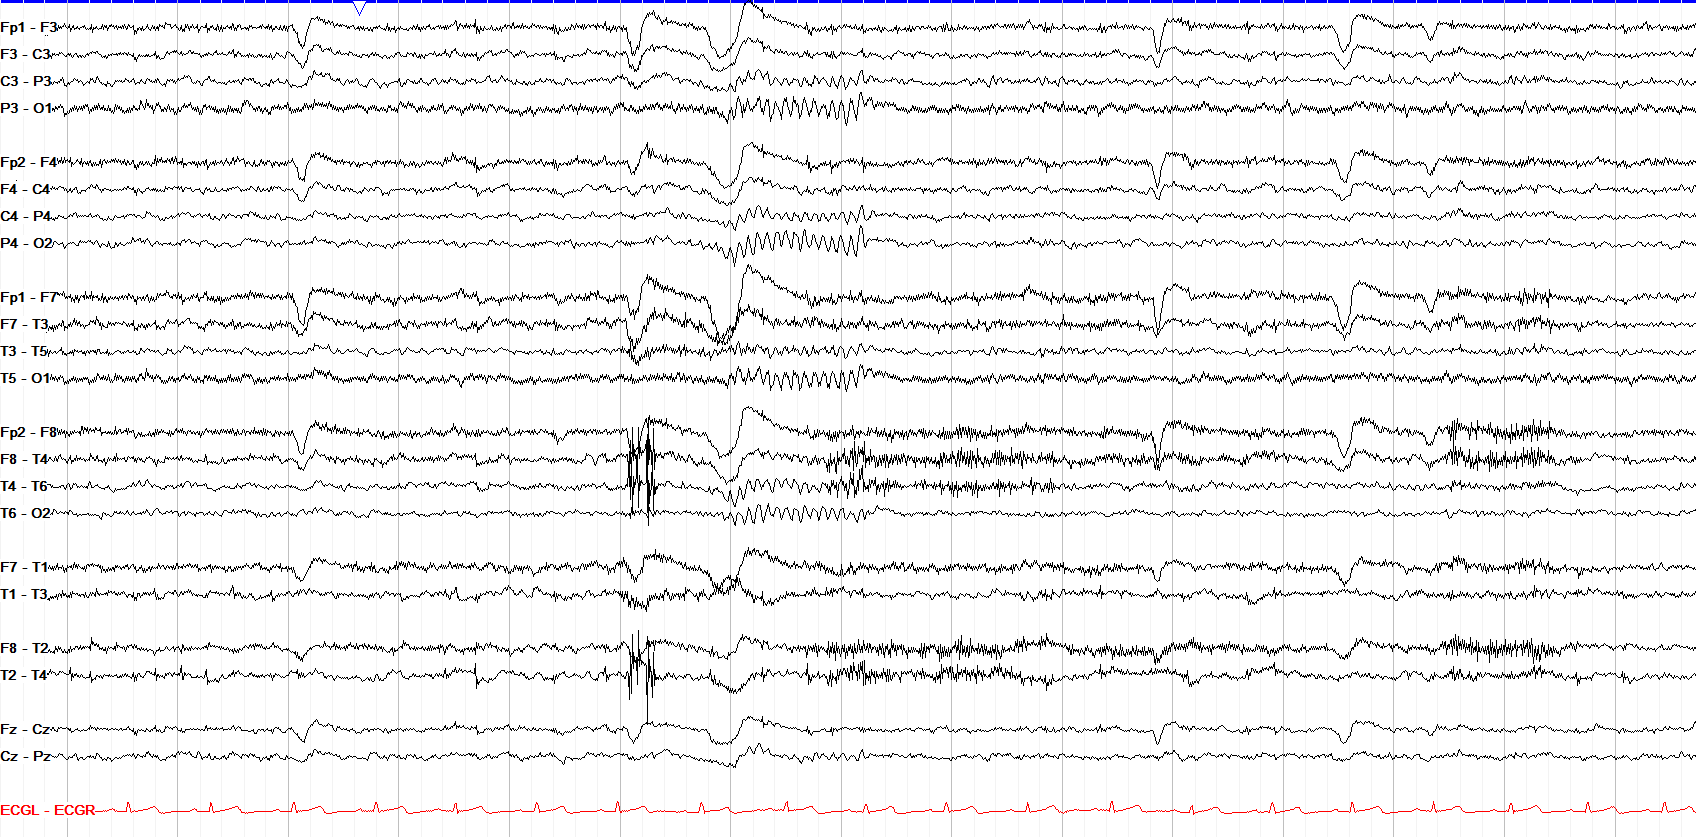
Eye blinks appear due to Bell's Phenomenon: eyes roll back when you blink and, because the retina is negatively charged and the cornea is relatively positive, this eye roll moves the retina down and away from frontal electrodes, which thus see a positive deflection
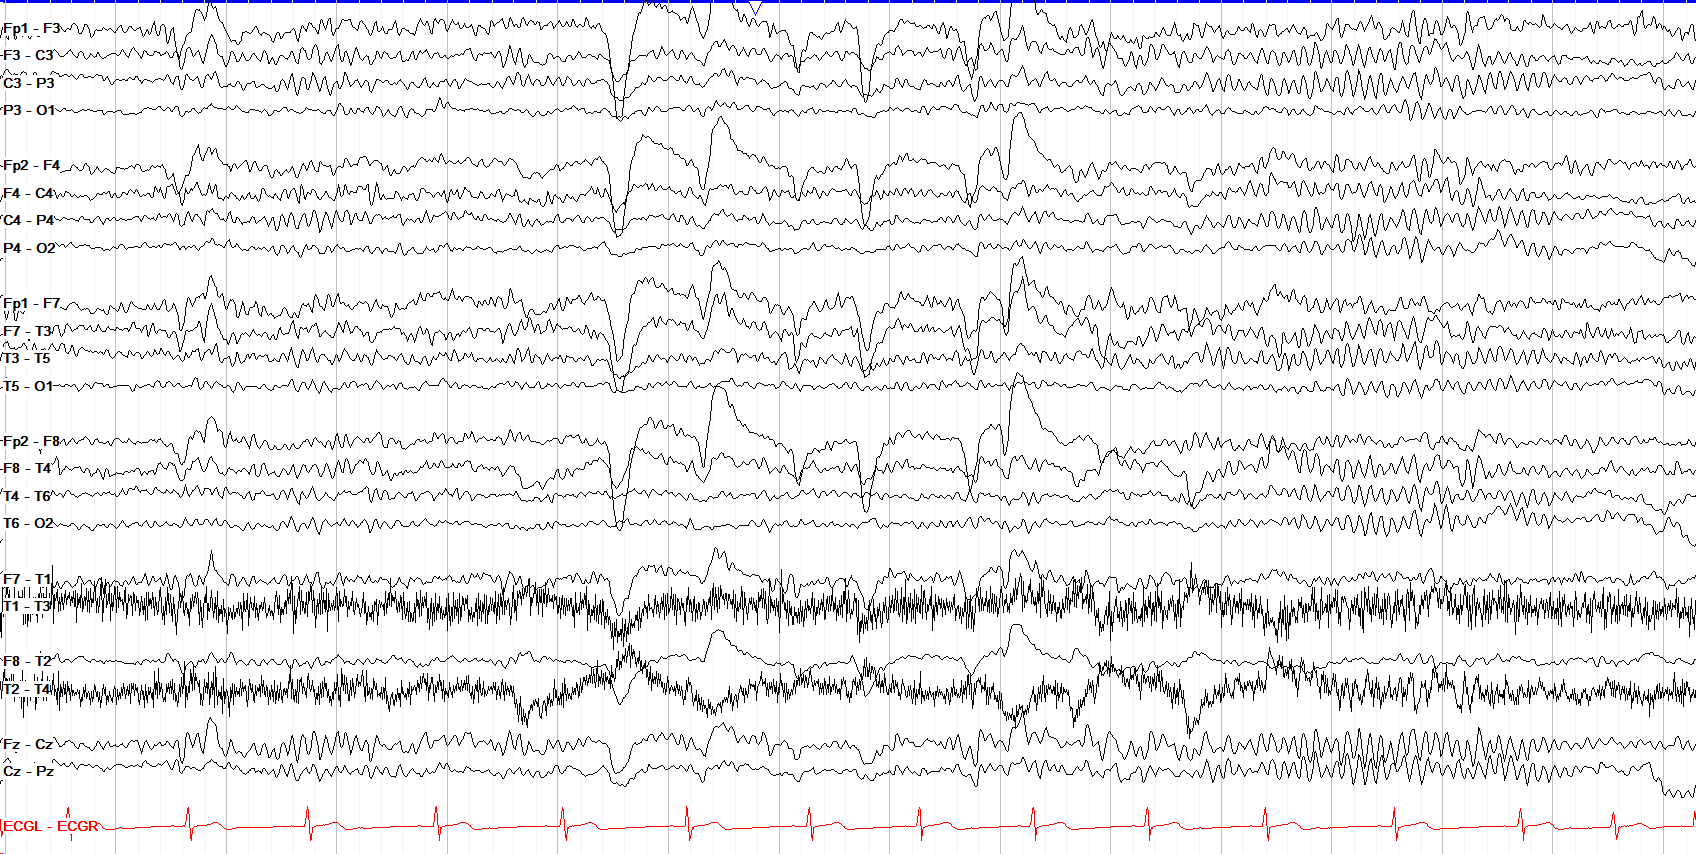
Myogenic artifact is often maximal over the front due to forehead tension and movement and is a common finding in the awake state. Here we see it best overlying T1-T3 and T2-T4.
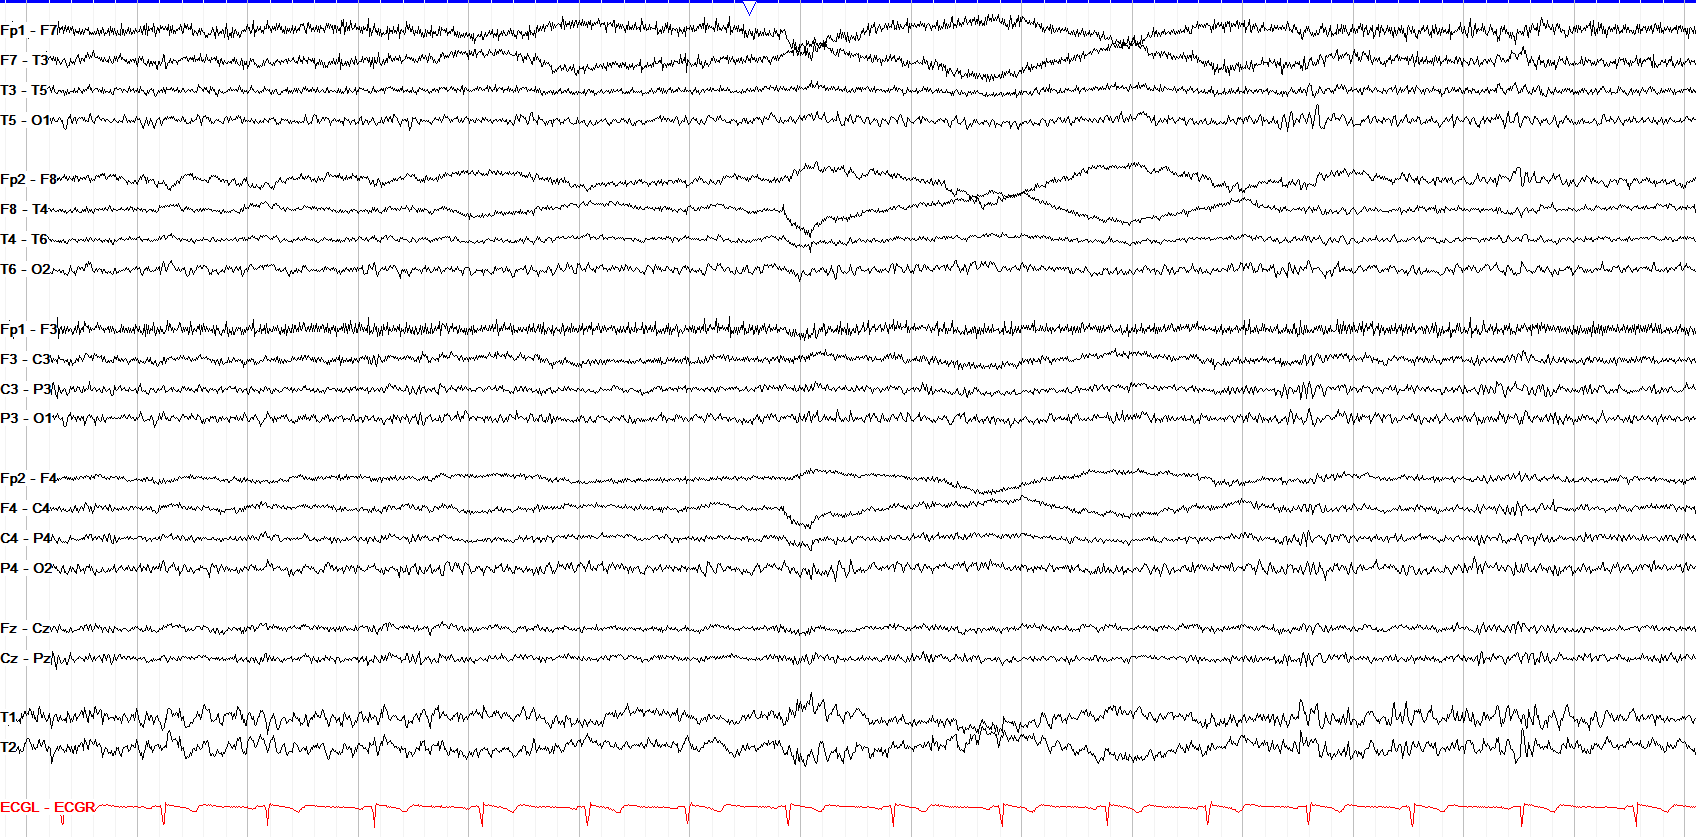
Drowsiness is marked by a diffuse slowing and attenuation of activity, with fragmentation of the PDR and roving lateral eye movements seen over frontal leads
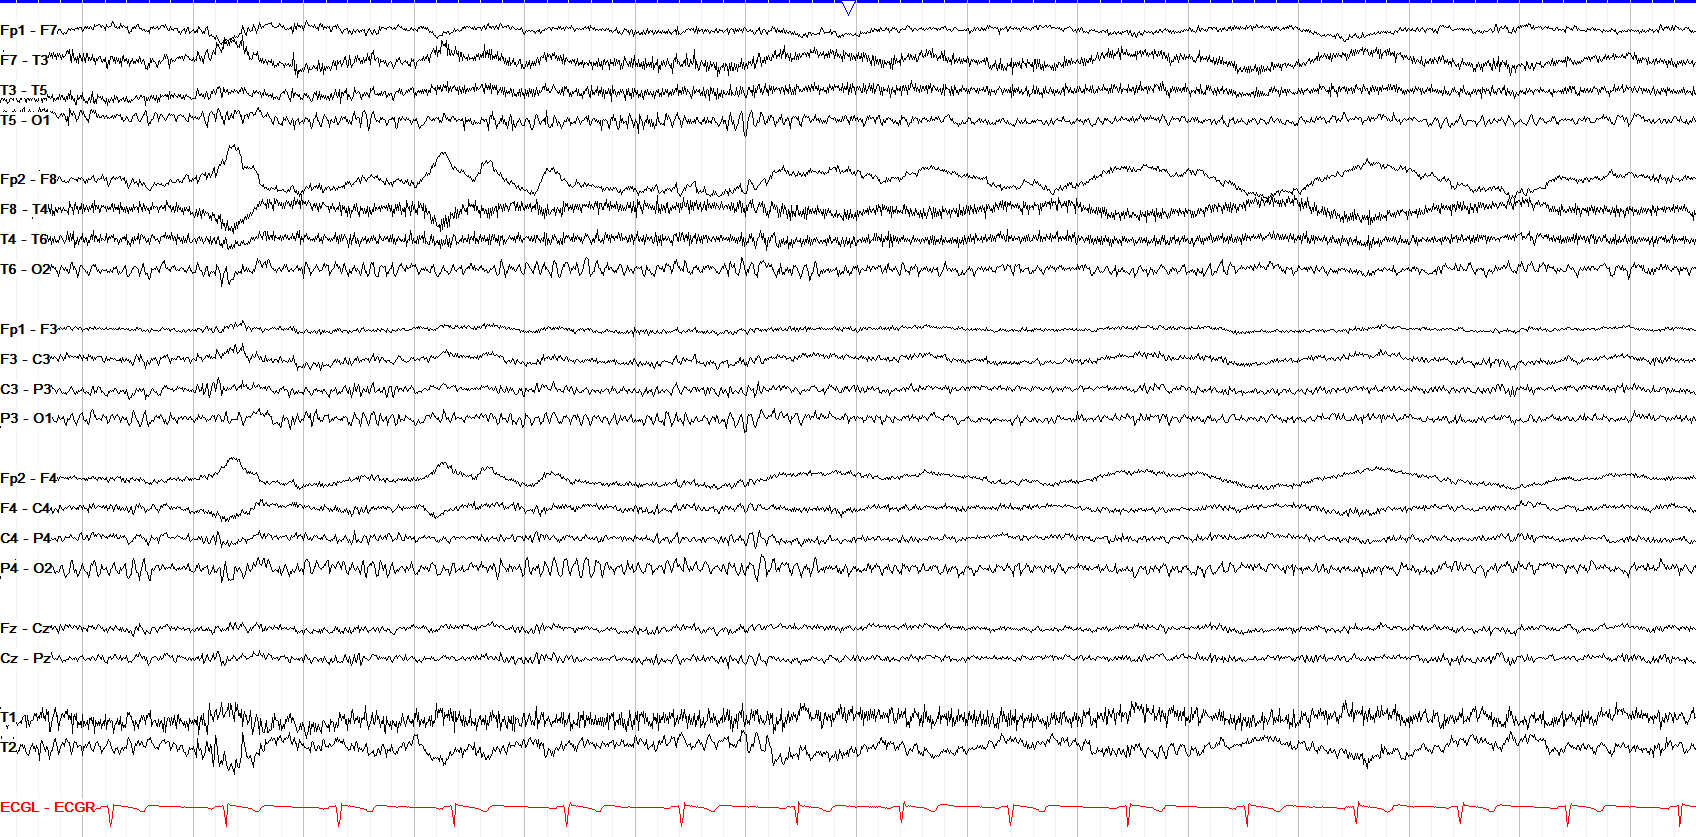
Opposing waveforms in frontal leads when drowsy arise because the cornea is positively charged. When you look to the right, the right cornea gets closer to F8, which thus sees a positive deflection, while the left cornea moves away from F7 and it sees a negative one
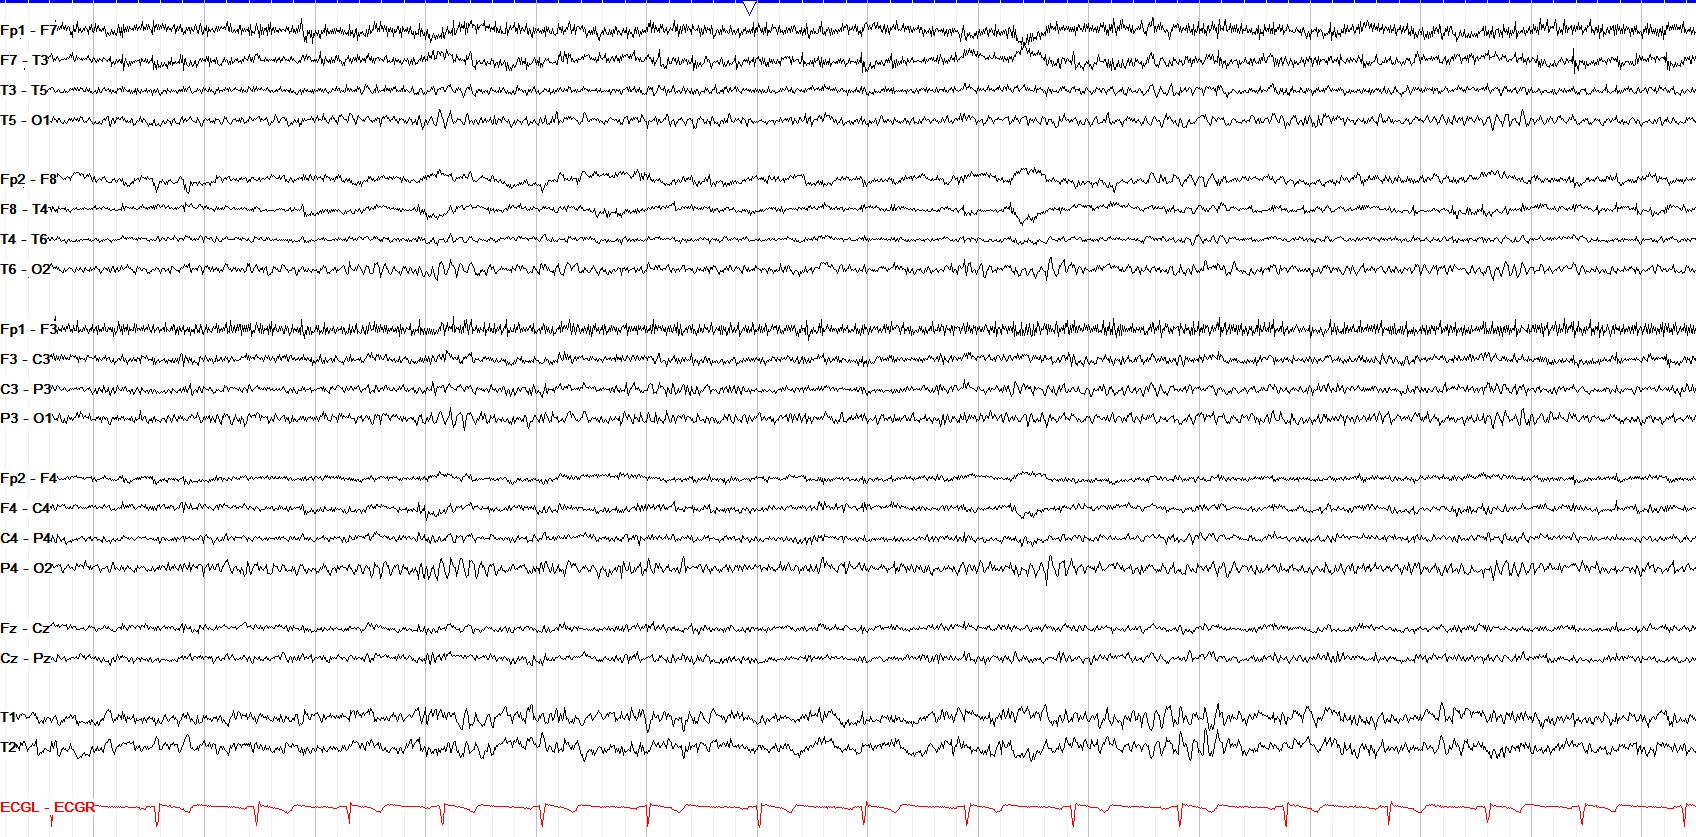
Here we see a good example of both roving eye movements and fragmentation of the PDR during drowsiness.
provocation
3 patterns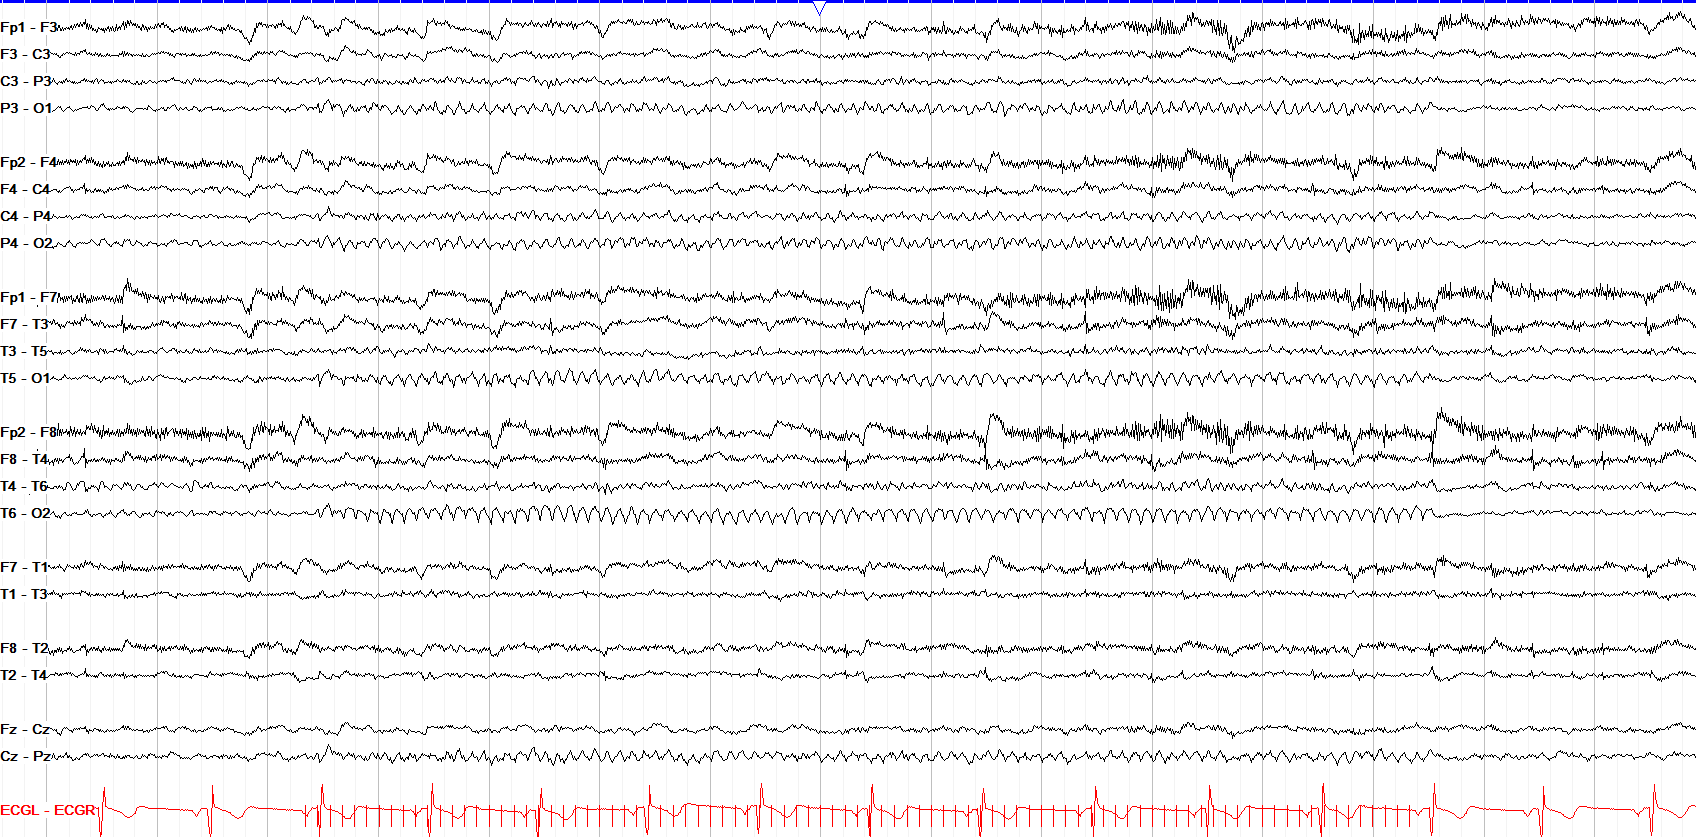
Photic driving is when the PDR becomes time locked to the frequency of the light flashes (which are each marked with a red line at the bottom of the tracing). It is a normal but not requisite response
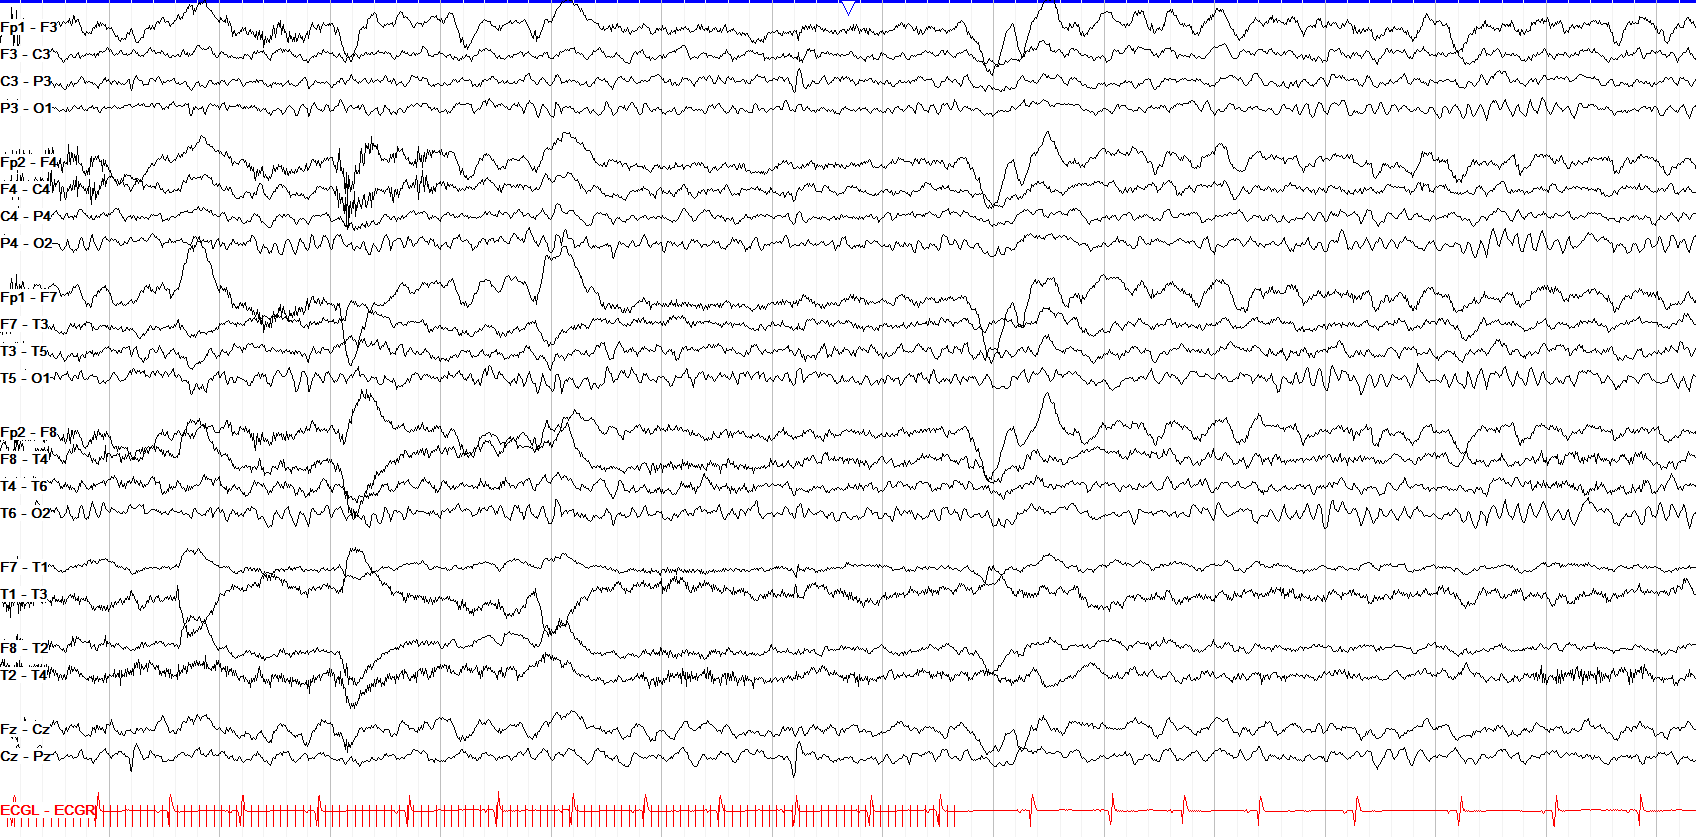
Lack of driving is not considered abnormal, as is the case here where we see a train of photic stimulation without any corresponding time lock of the background activity
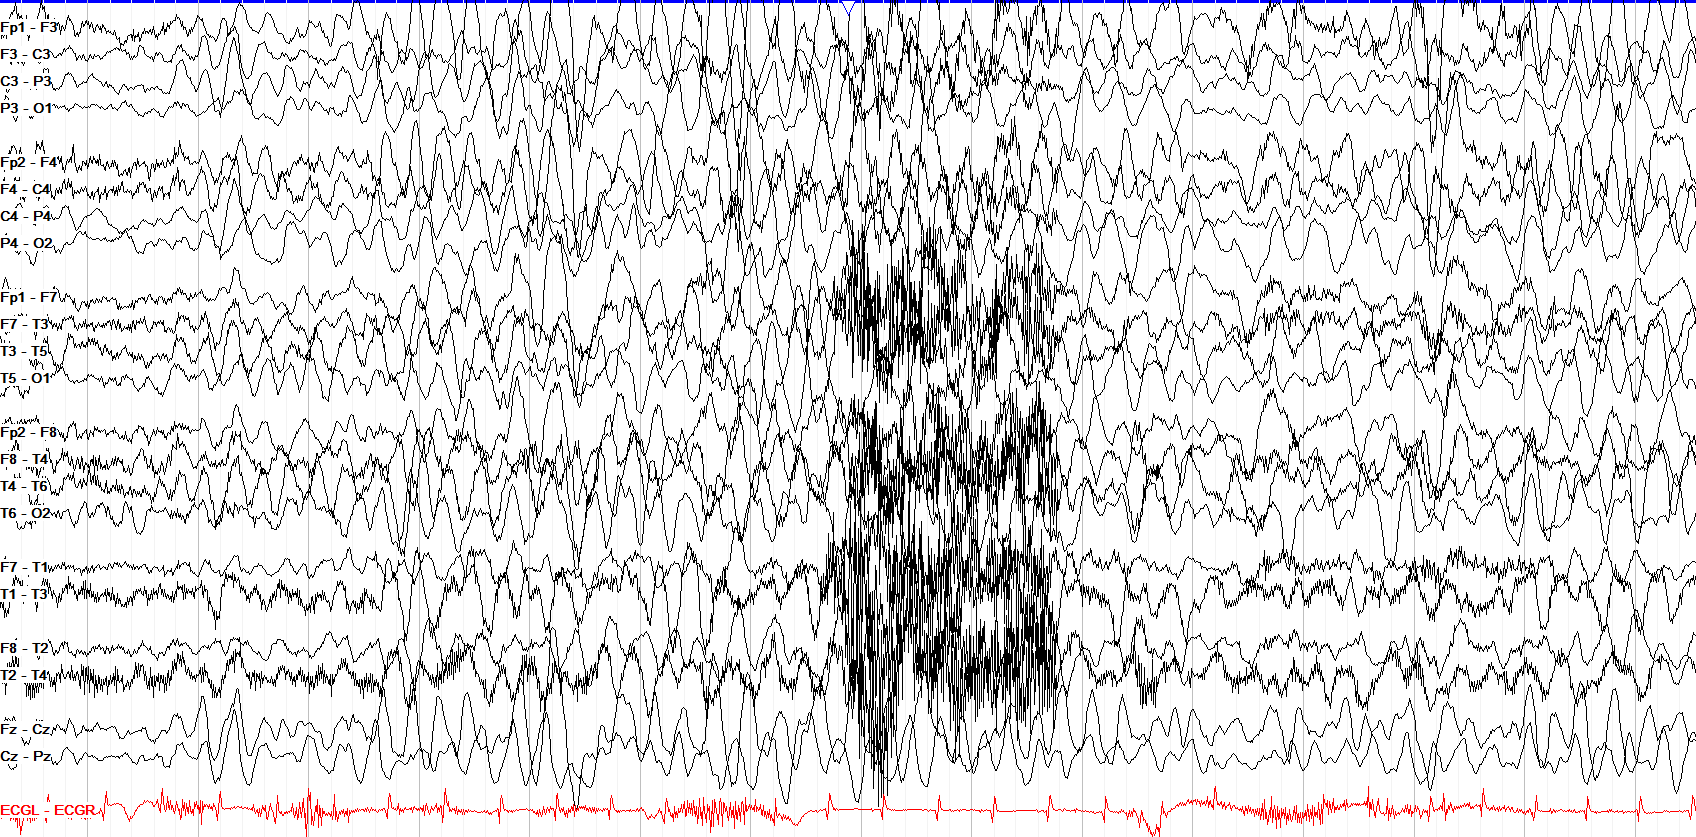
Hyperventilation (HV) leads to hypocapnia (a drop in carbon dioxide), causing cerebral vasoconstriction and a consequent drop in cerebral blood flow and oxygen delivery, which likely plays a role in the classic diffuse slowing of HV. HV is effort dependent, so slowing may not always be seen
stage I sleep
3 patterns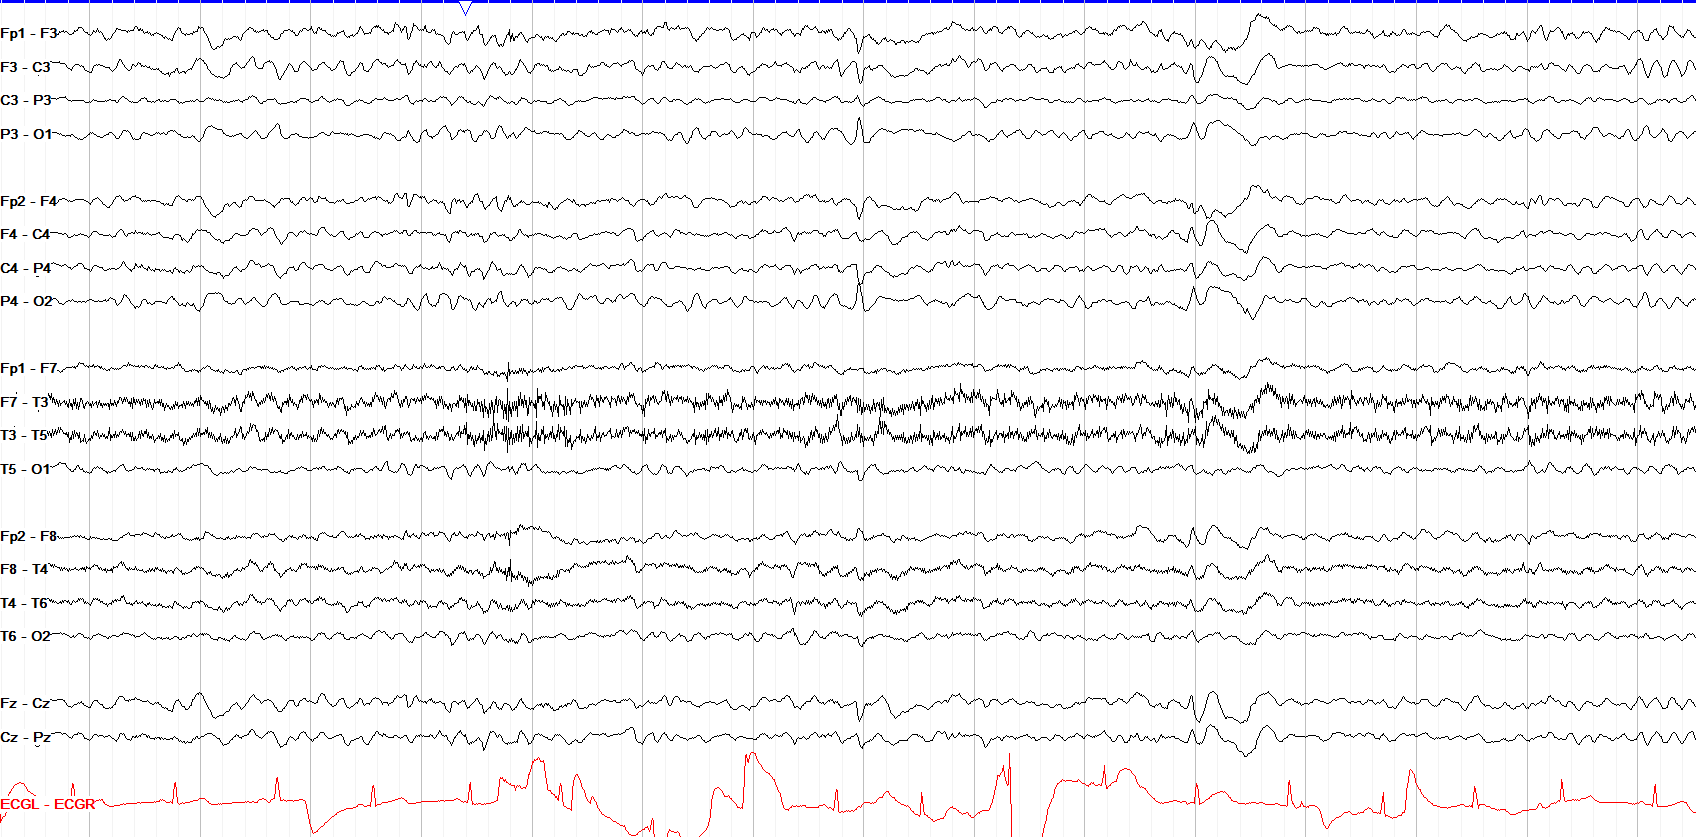
Vertex waves are normal discharges characteristic of stage I sleep. They are centrally predominant, usually symmetric phase reversing discharges; don't confuse them for epileptiform discharges.
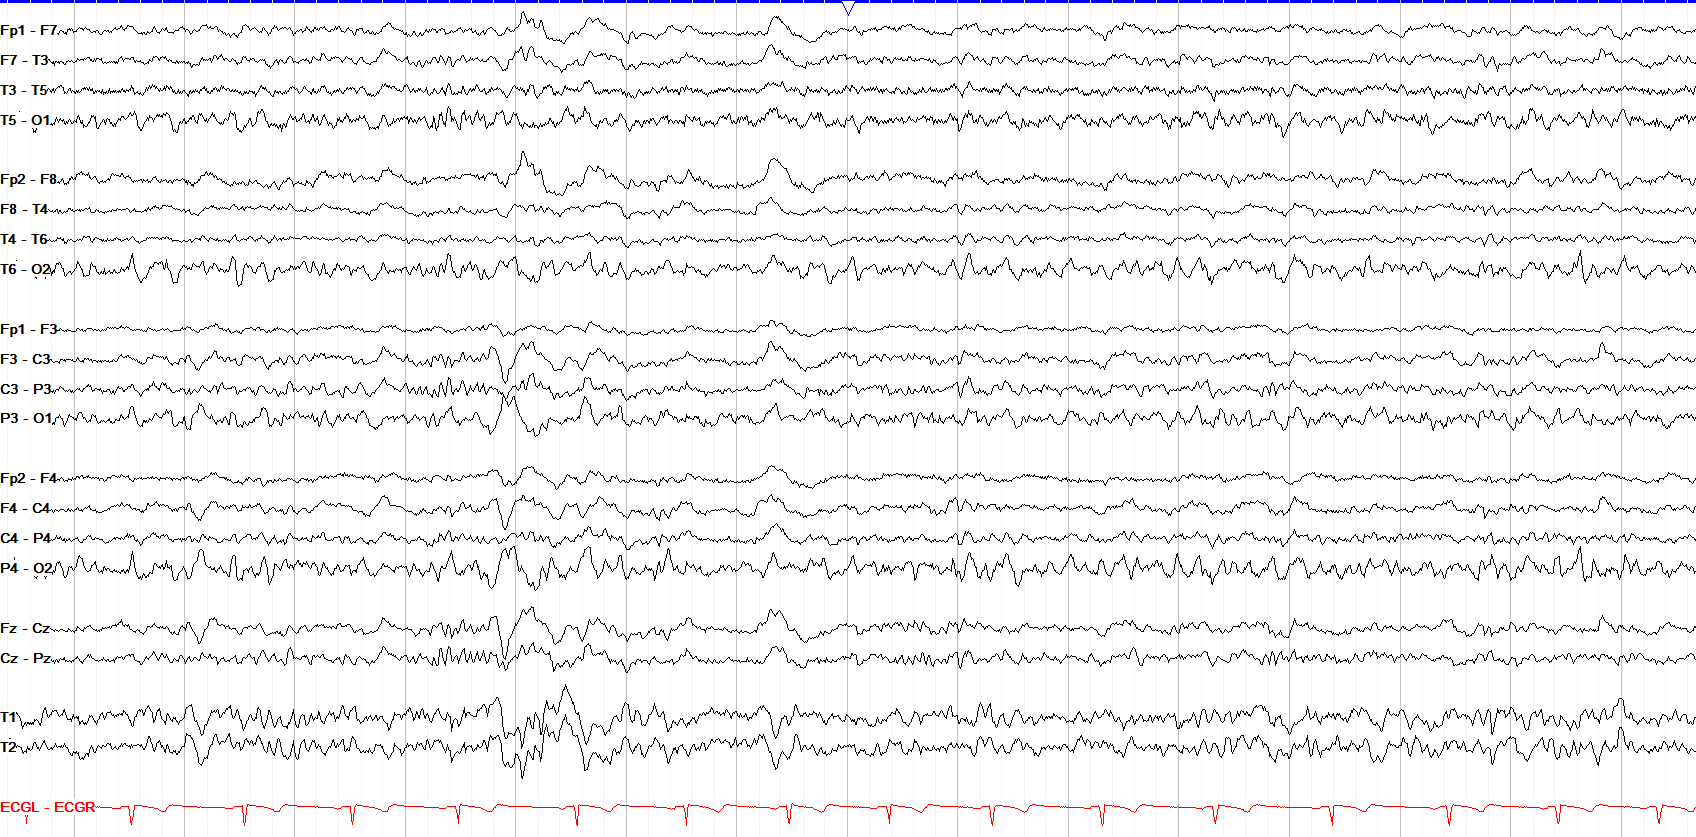
Vertex waves can be very high amplitude, particularly in children. They often persist into stage II and slow wave sleep, but become less organized after stage I sleep.
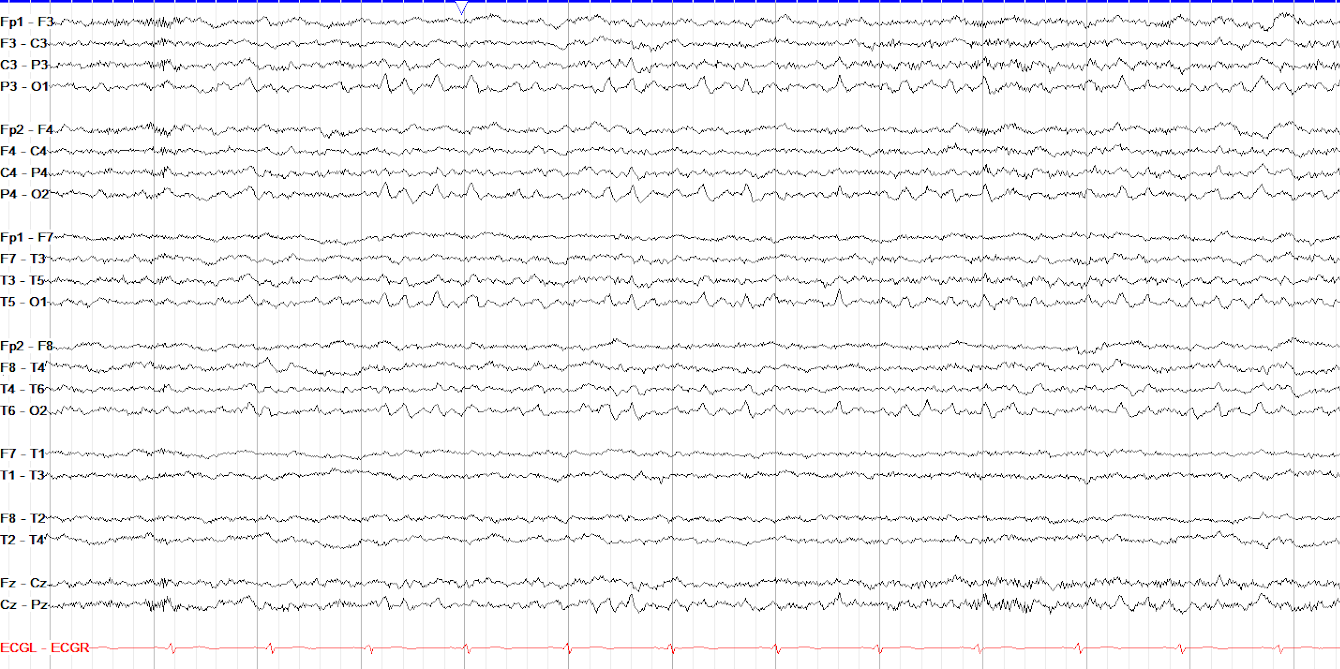
Positive occipital sharp transients of sleep (POSTS) are normal waveforms that characterize stage I sleep. They are bilateral, but not necessarily symmetric waves in the occipital regions, classically with a "sail like" appearance. Their counterpart in the awake state are lambda waves, which look the same and occur with visual scanning.
stage II sleep
9 patterns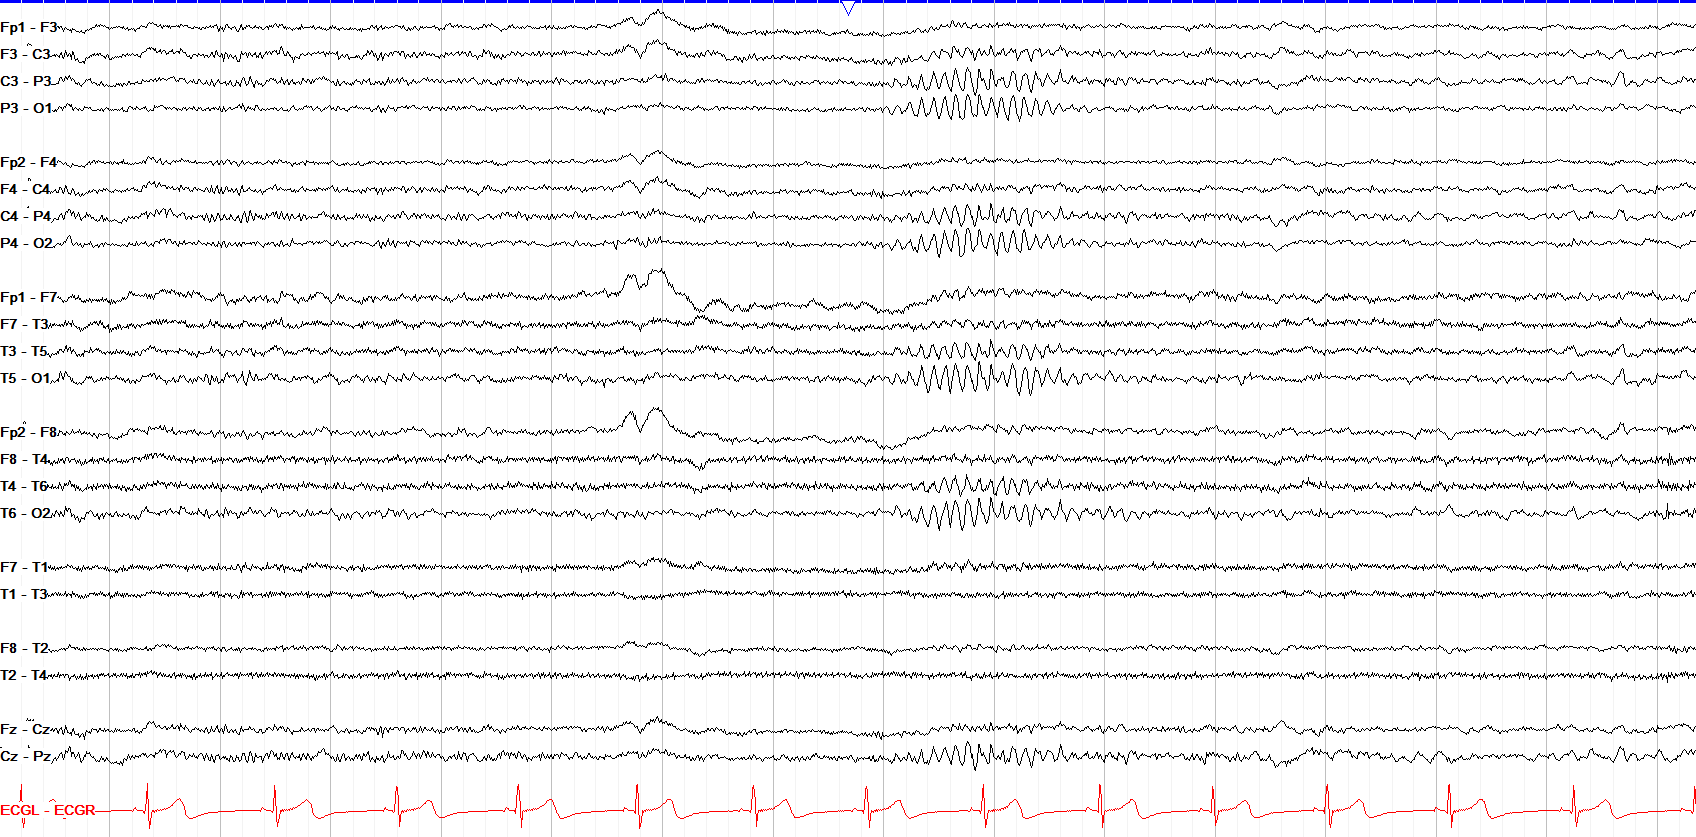
Sleep spindles are symmetric bursts of activity, usually 11-16 Hz, that characterize stage II sleep. Like most sleep architecture, they can persist into slow wave sleep.
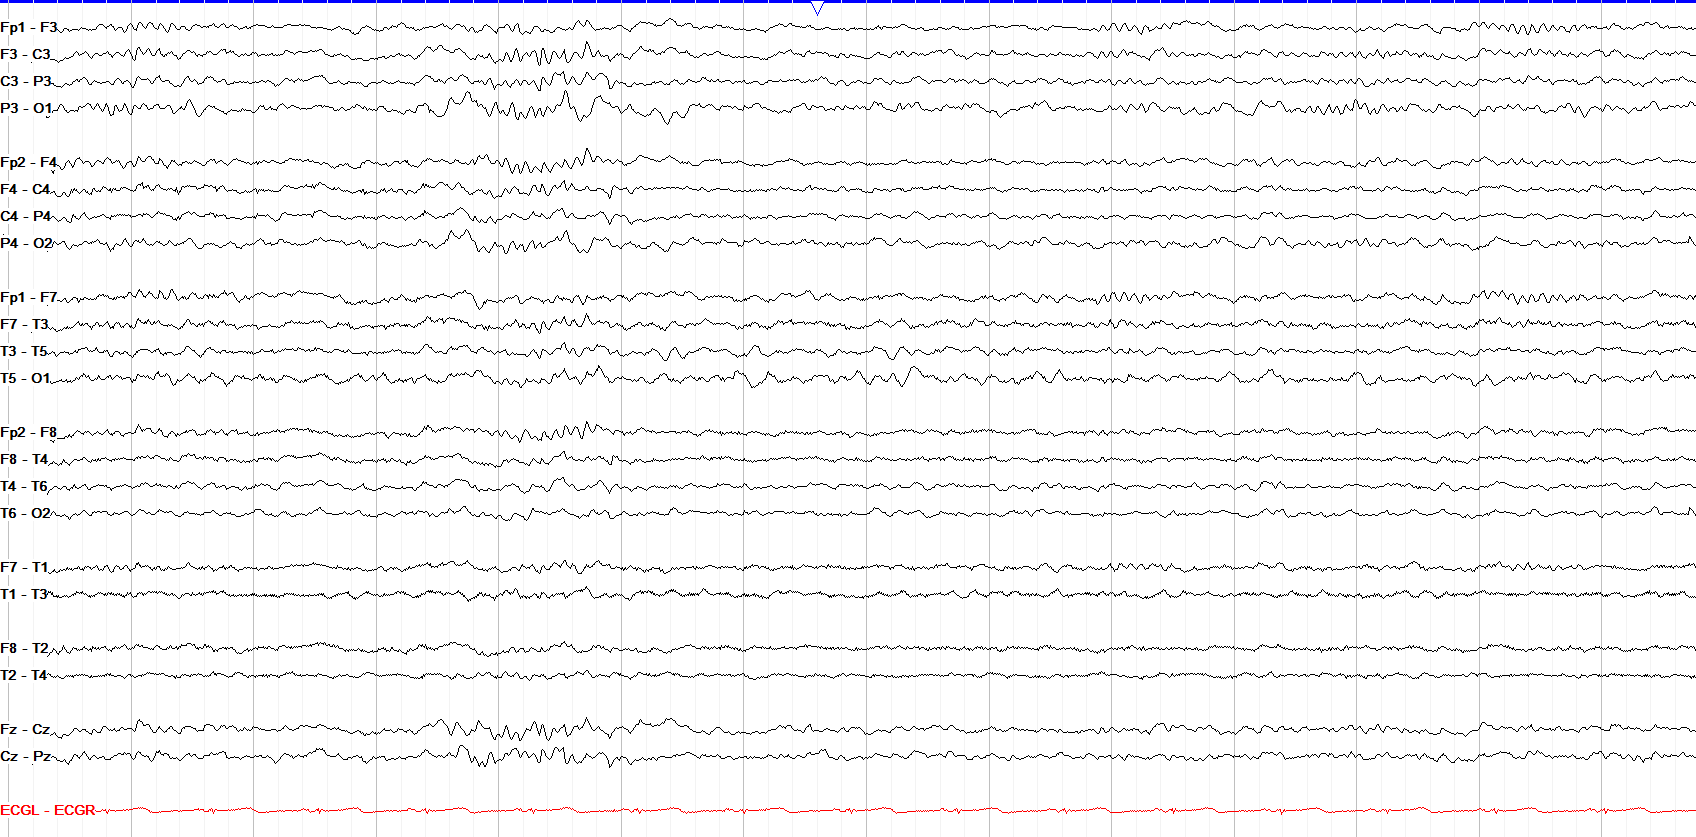
Spindles' name comes from their classic appearance similar to a spindle of thread, and they arise from the reticular nucleus of the thalamus.
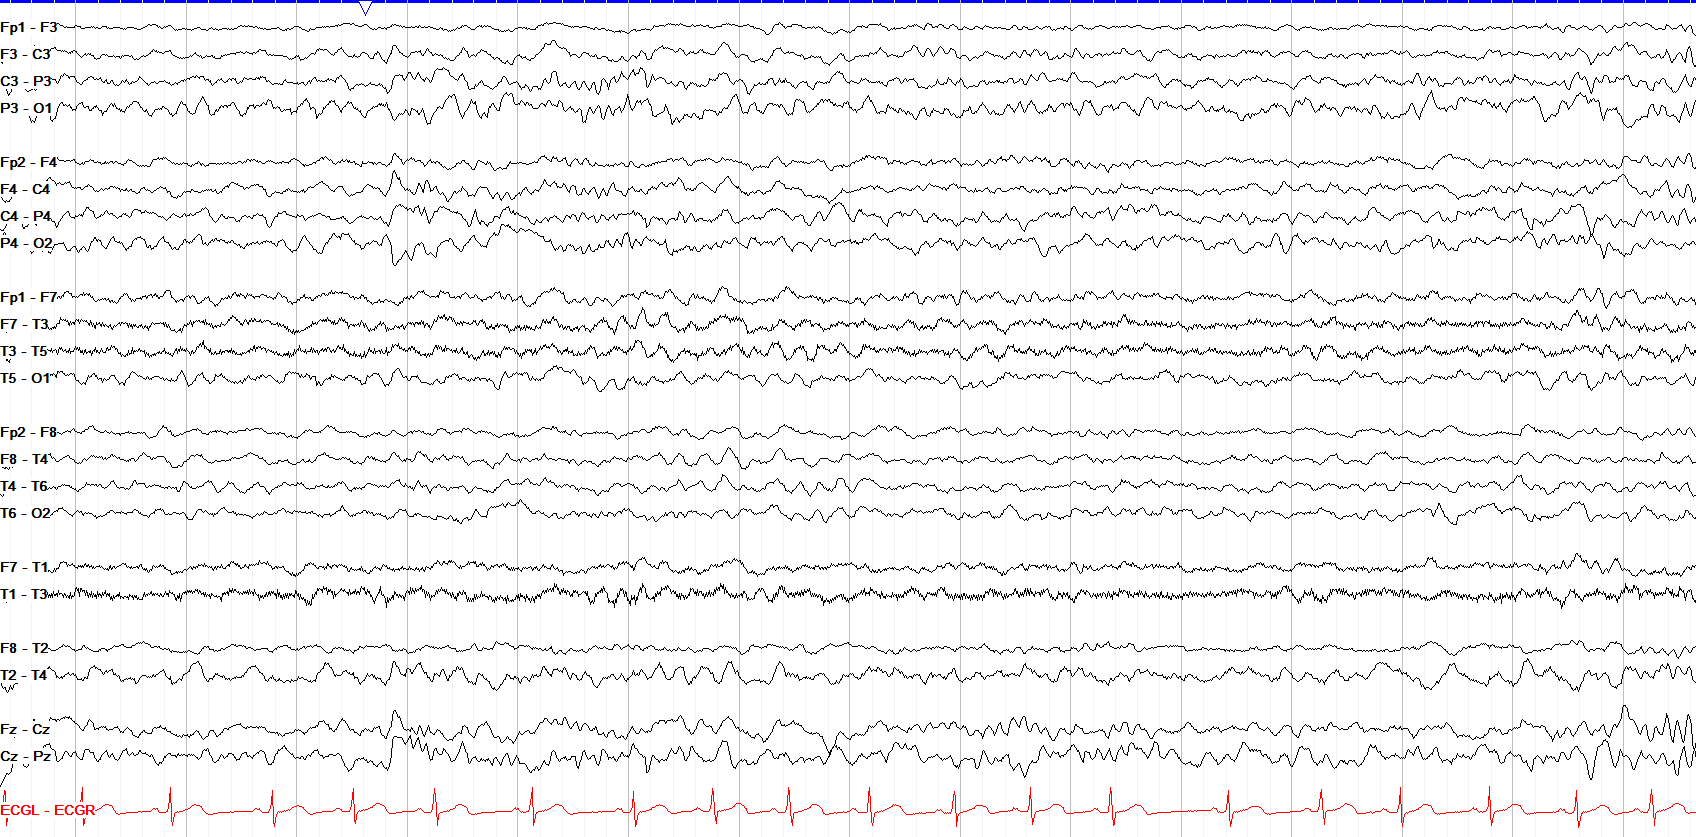
Here we see spindles in the bilateral parasagittal leads, with less prevalence in the temporal chains. Spindles may not be seen equally in the parasagittal and temporal chains, but should be symmetric.
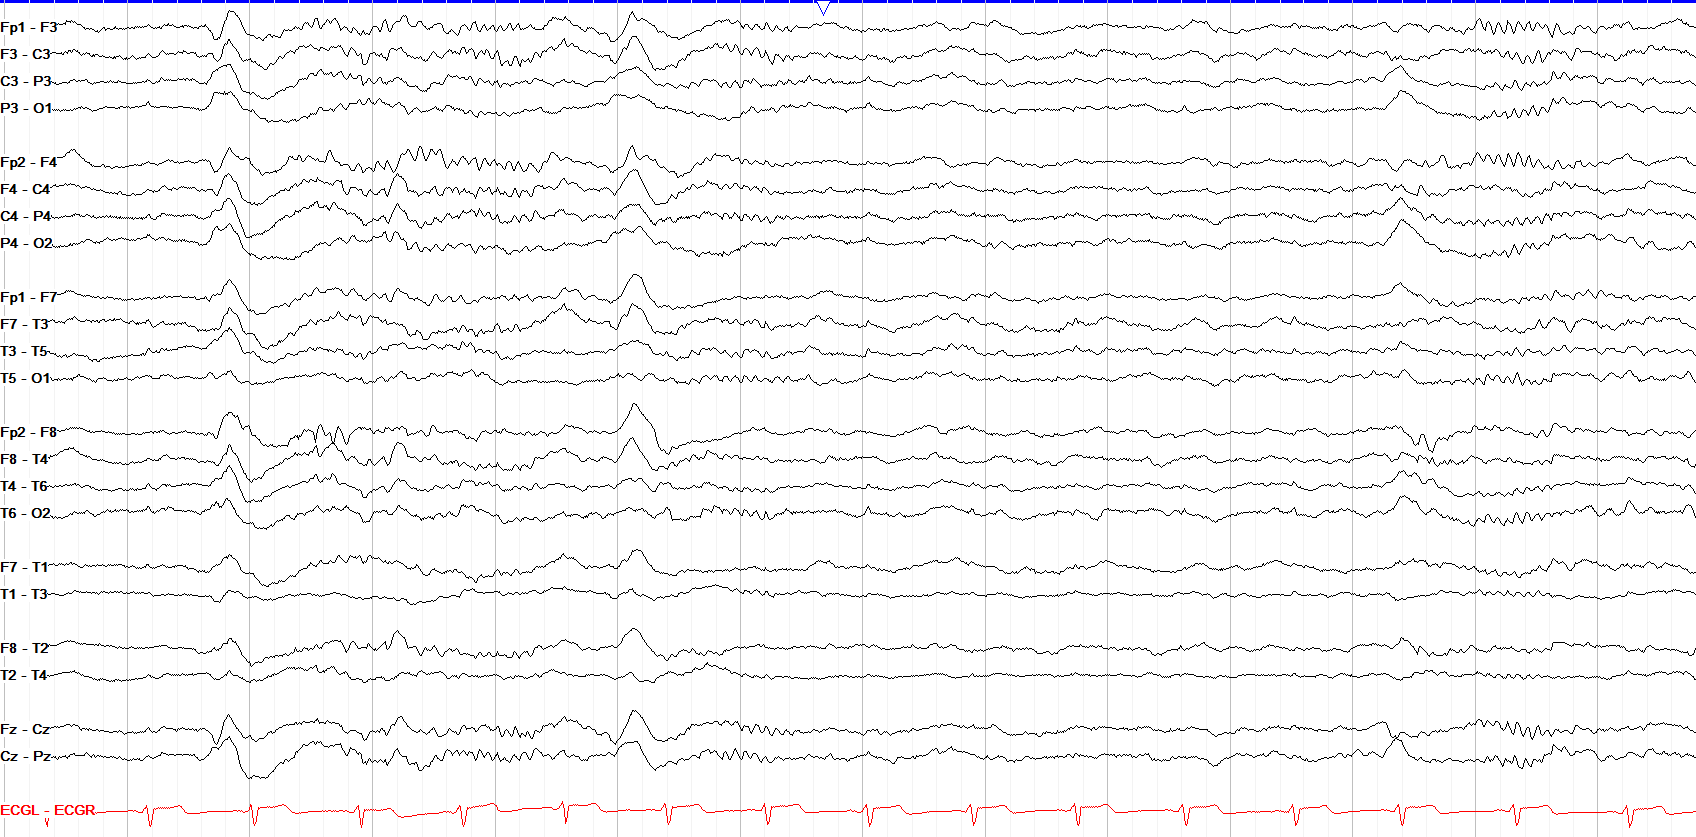
K complexes are very high amplitude, biphasic waveforms with an initial negative phase, then a large slow positive phase; usually, this large wave is followed immediately by a sleep spindle.
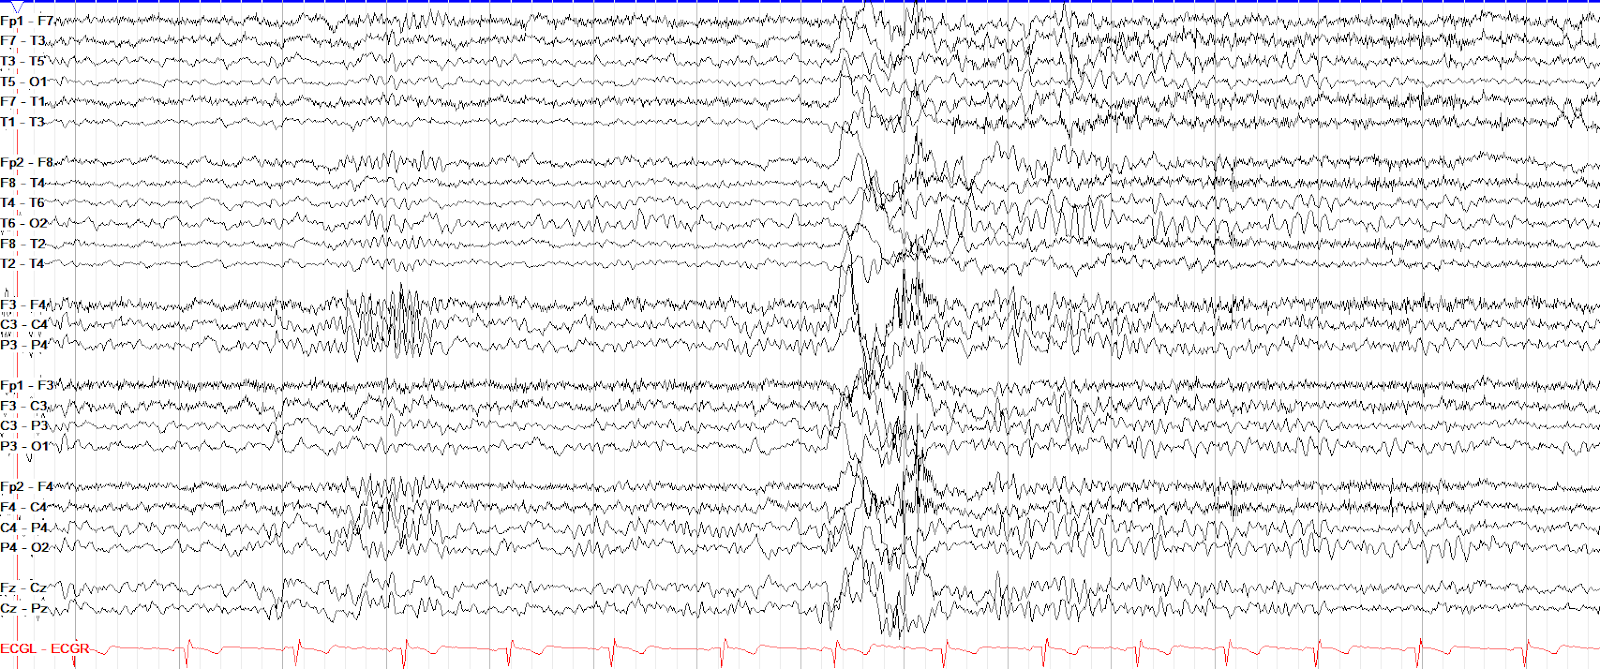
K complexes are so named because they were initially "knock" complexes--in early sleep studies, researchers noted they'd arise when a patient was asleep and a loud noise occurred.
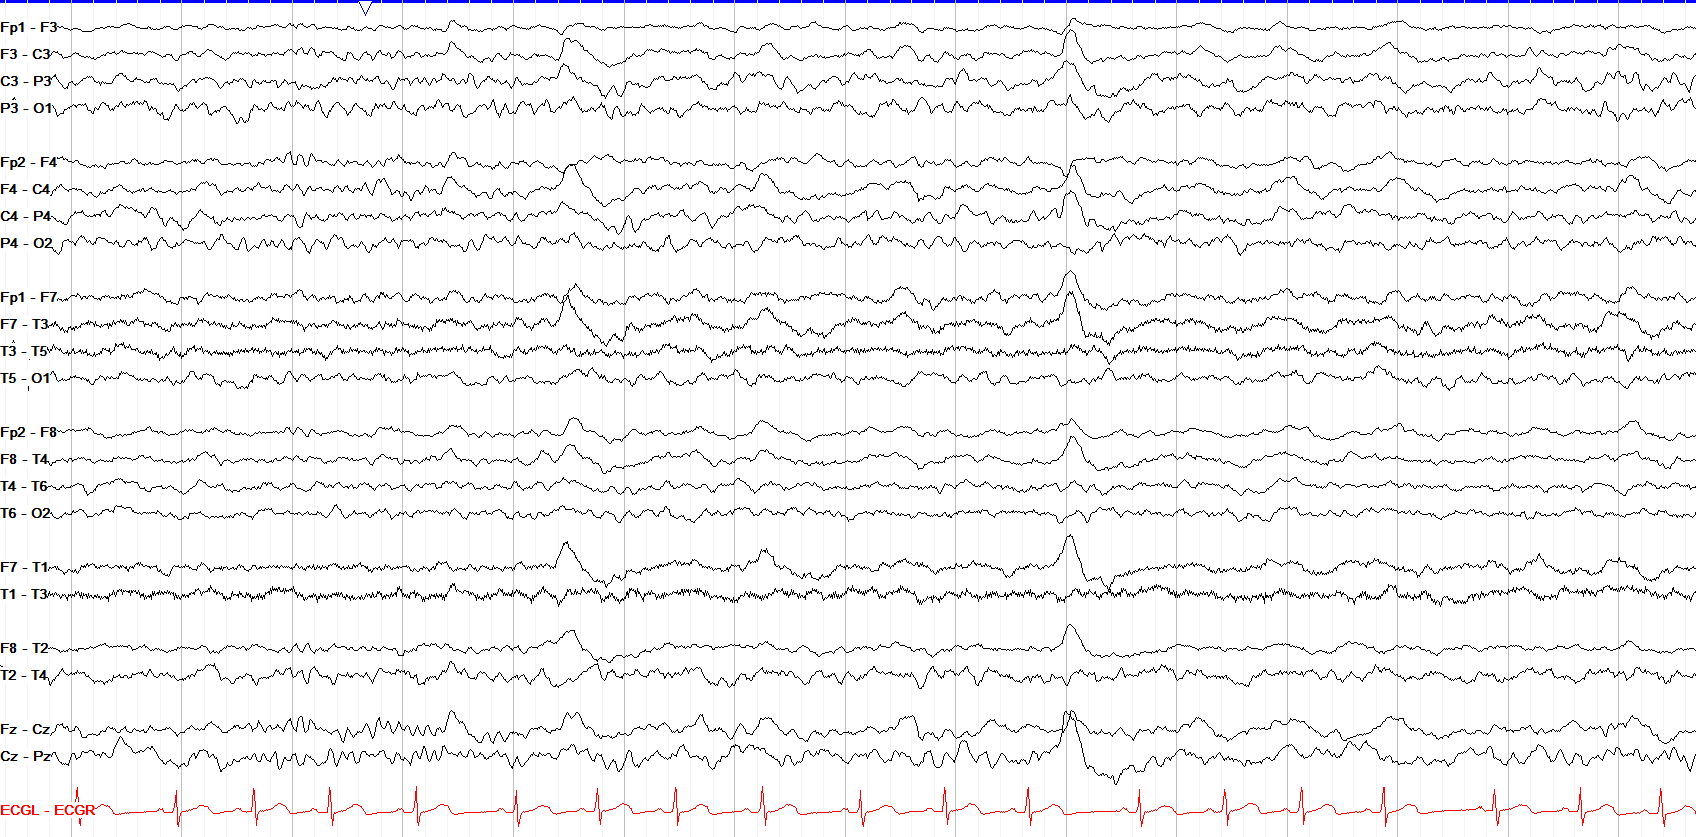
Not all K complexes are followed by spindles, as seen here.
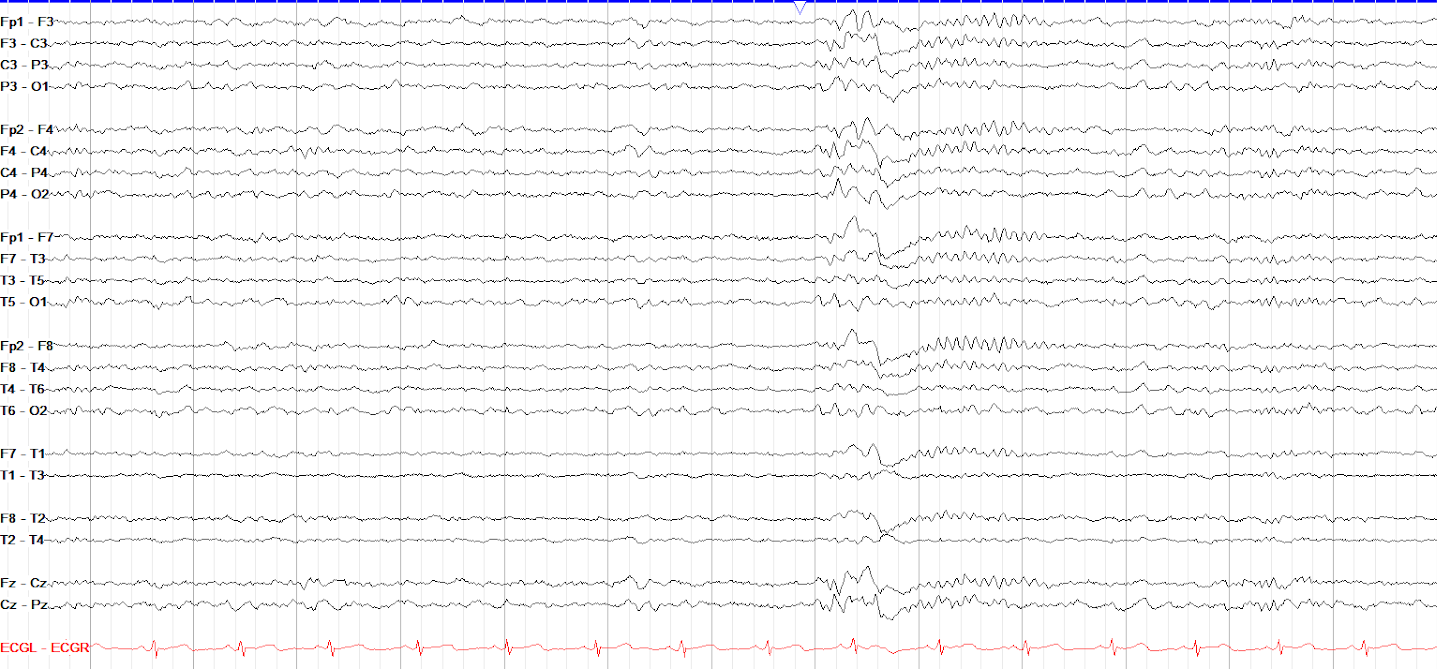
Here are POSTS and K complexes together, characteristic of stage II sleep. Stage I waveforms persist into stage II sleep, and both sets of waveforms can persist into slow wave sleep.
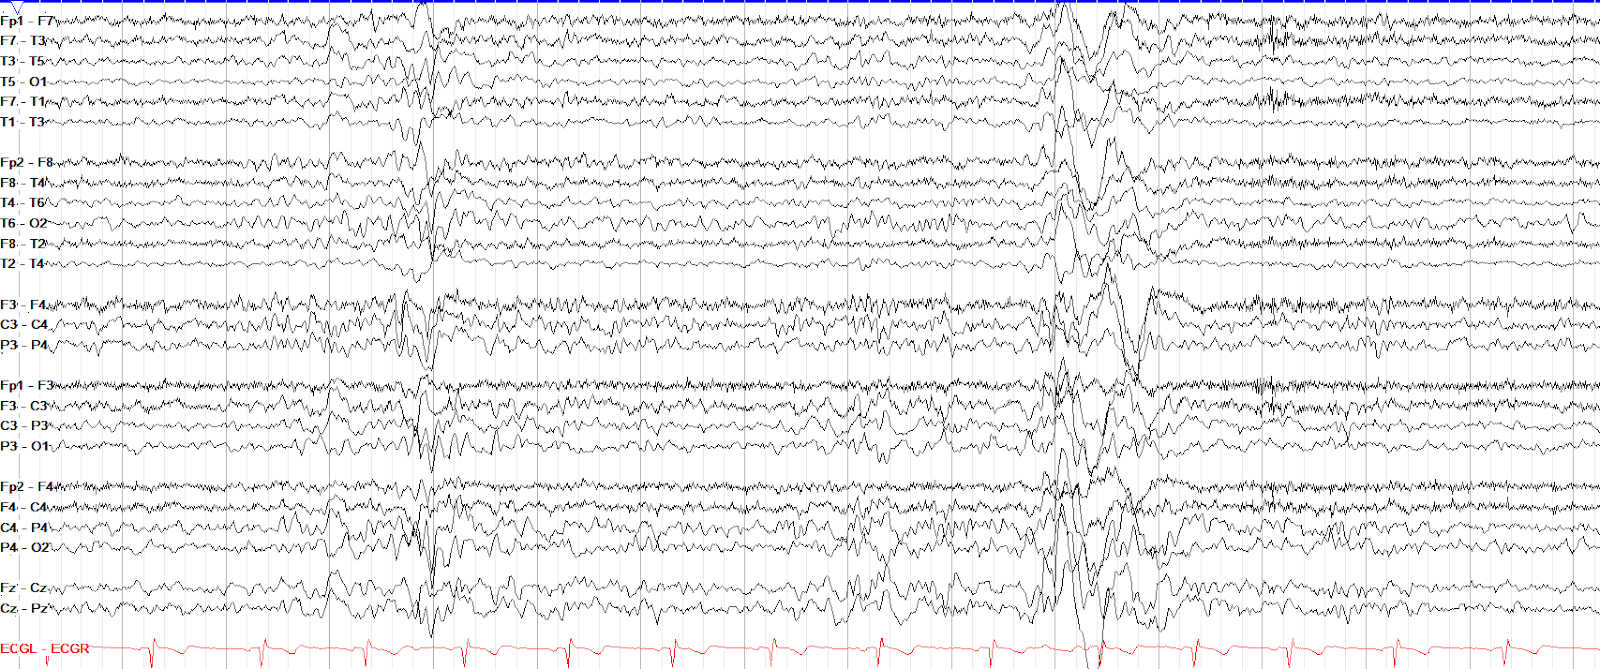
Particularly in younger patients, K complexes can be extremely high amplitude (they are sometimes called the highest amplitude normal activity the brain produces)
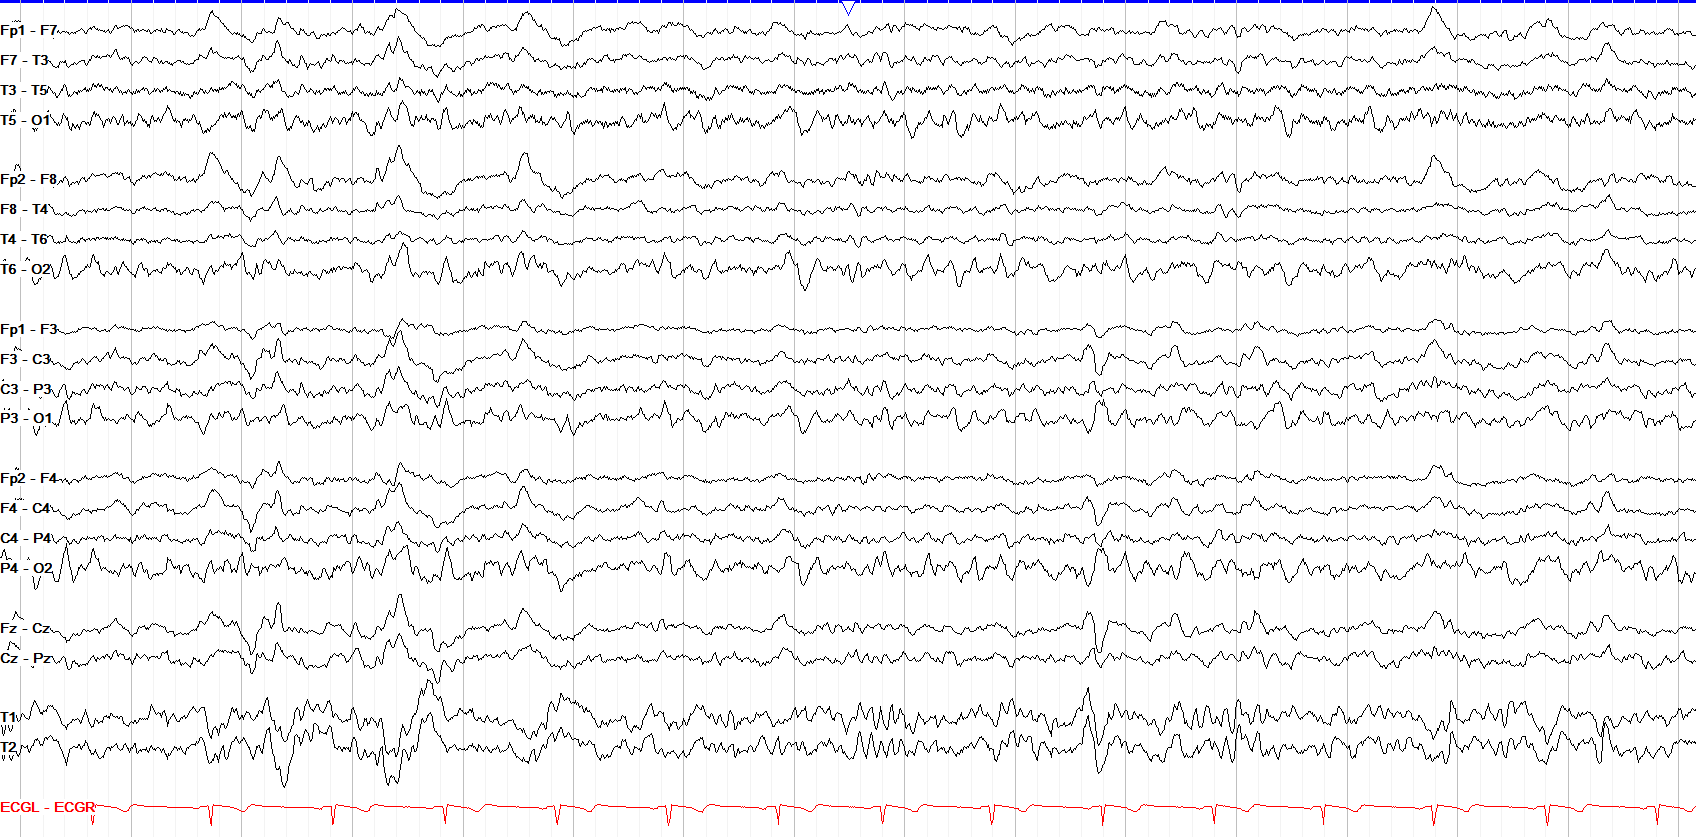
Here we see a good example of stage II sleep again, with architecture from both stage I and stage II. Note that the POSTS are poorly formed but in the right region/distribution.
slow wave sleep
5 patterns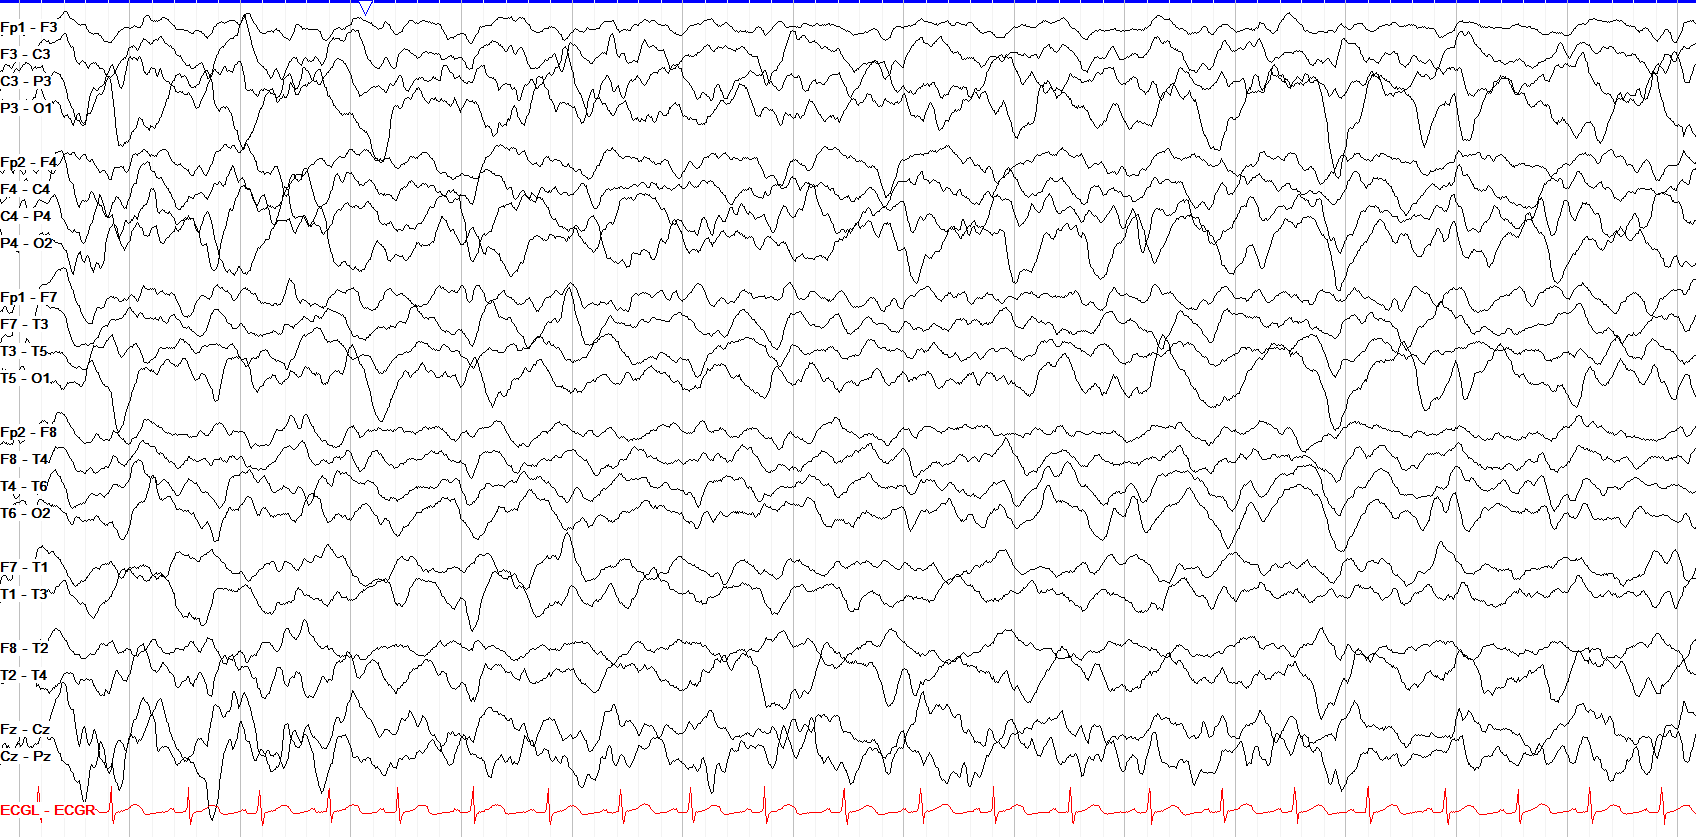
Slow wave sleep is characterized by diffuse and synchronized, high amplitude (often more than 75 microvolts) delta activity usually between 0.5 and 2 Hz.
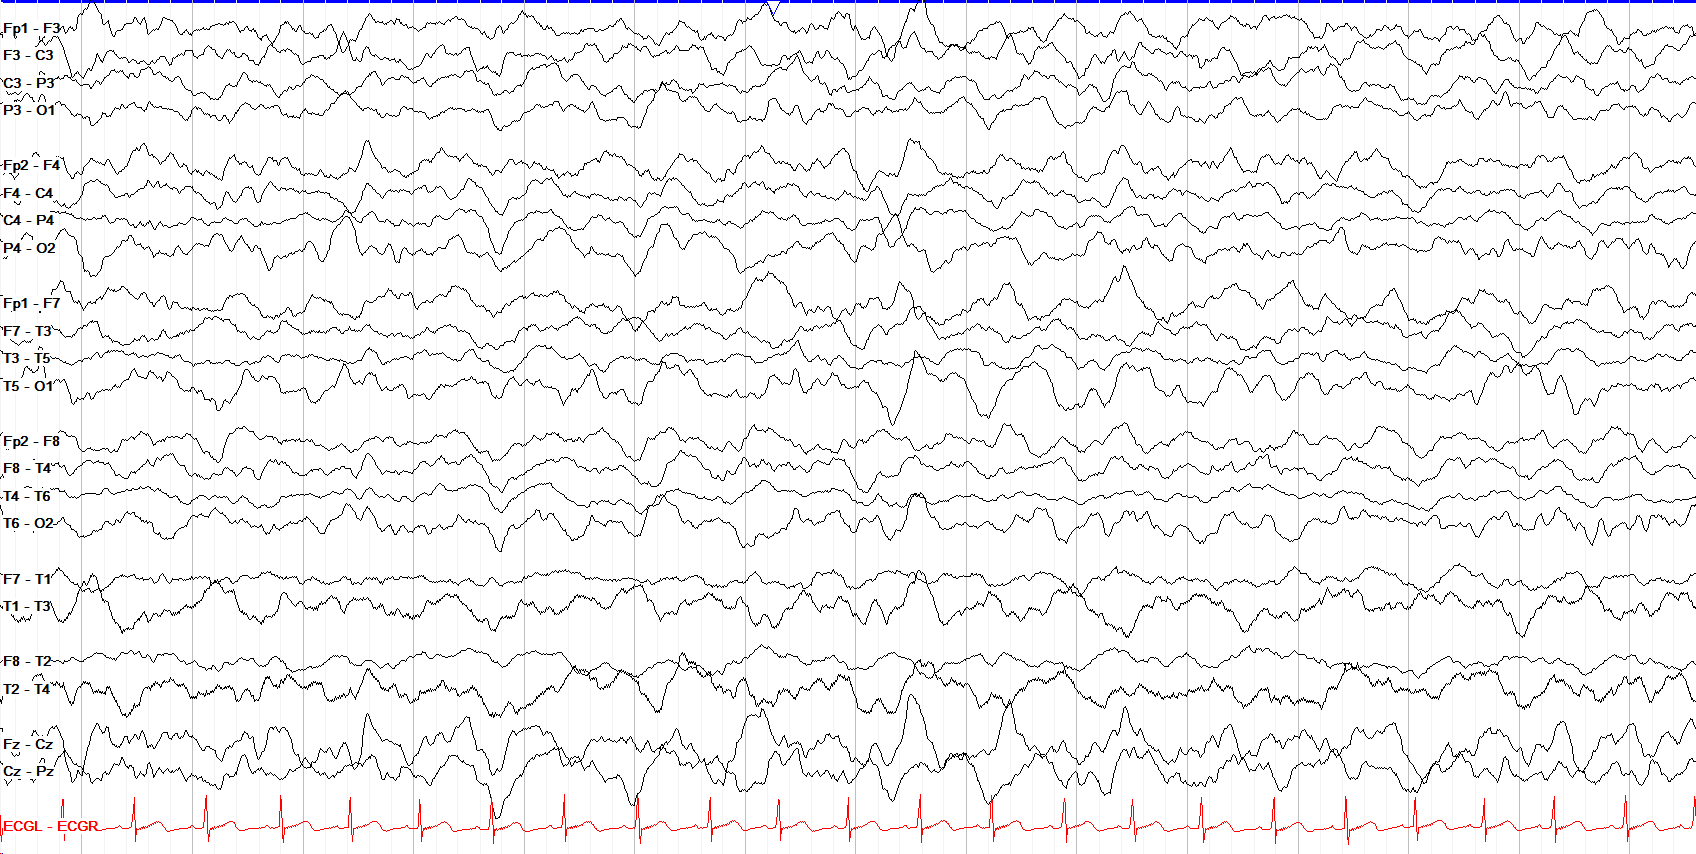
Often, sleep architecture from earlier phases of sleep recedes and becomes less apparent or organized in slow wave sleep, as in this example of a very poorly formed vertex wave
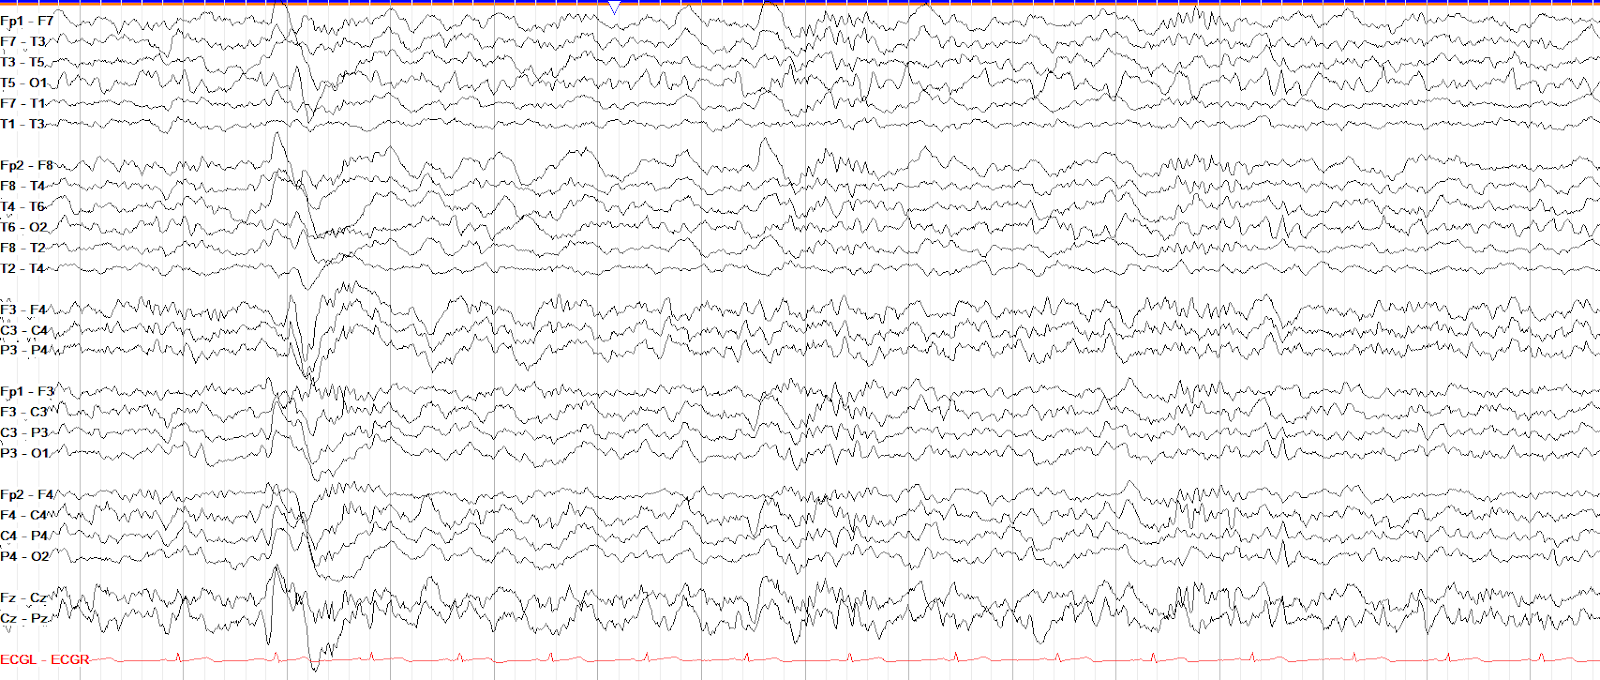
In the transition from stage II to slow wave sleep, the architecture from prior stages is more clearly preserved among the beginning of the higher, synchronized delta activity of slow wave sleep.
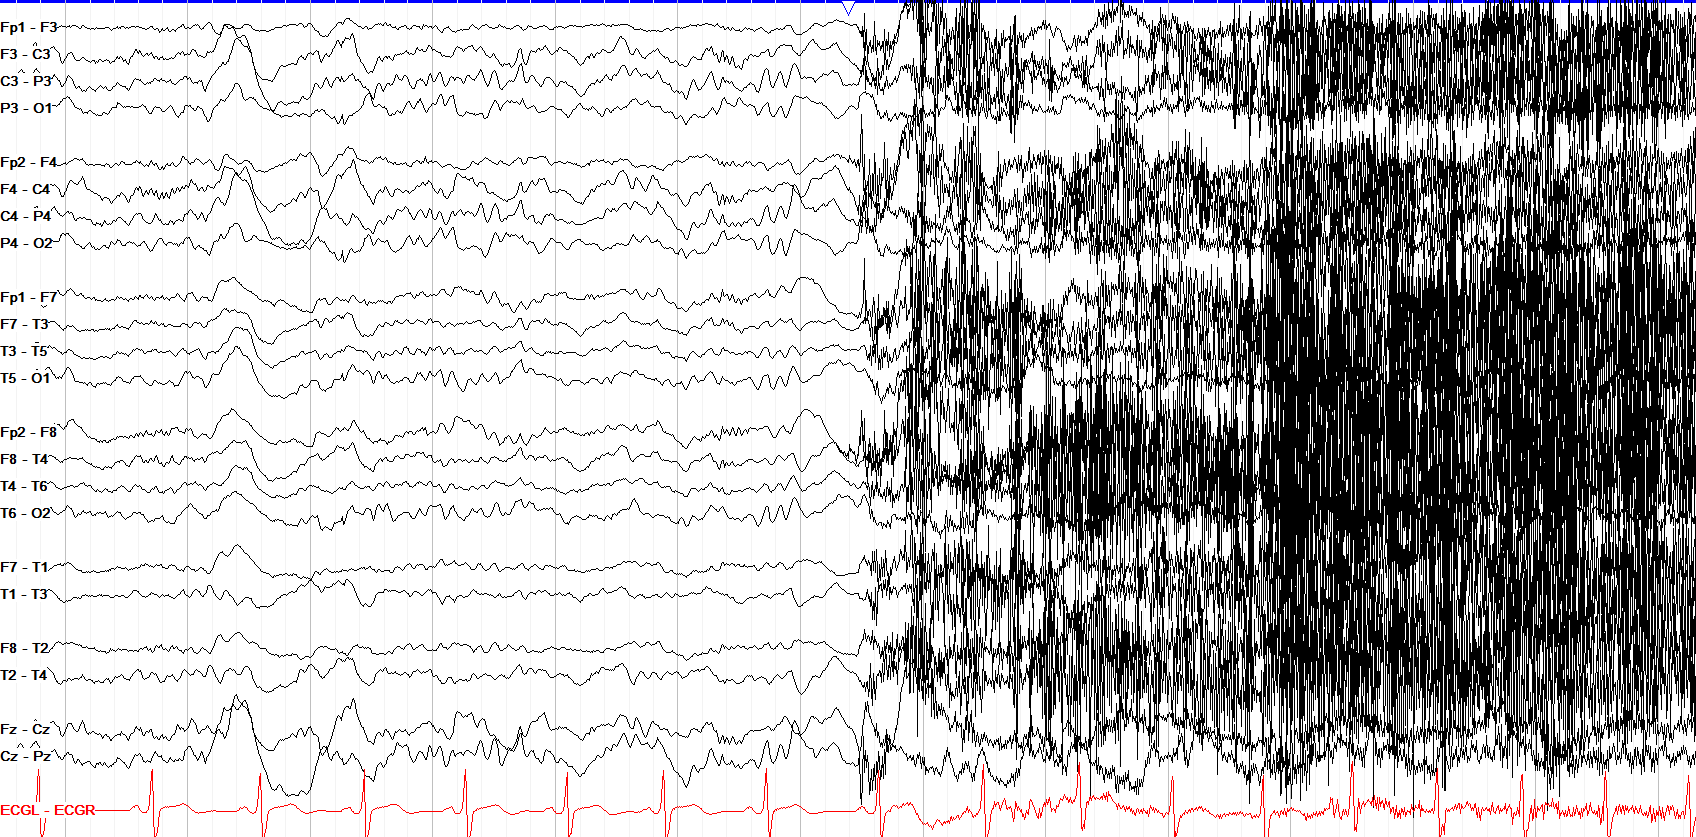
Arousal from sleep is typically seen as an abrupt cessation of the usual sleep architecture, along with myogenic artifact movement artifact, eye blinks and other signs of wakefulness.
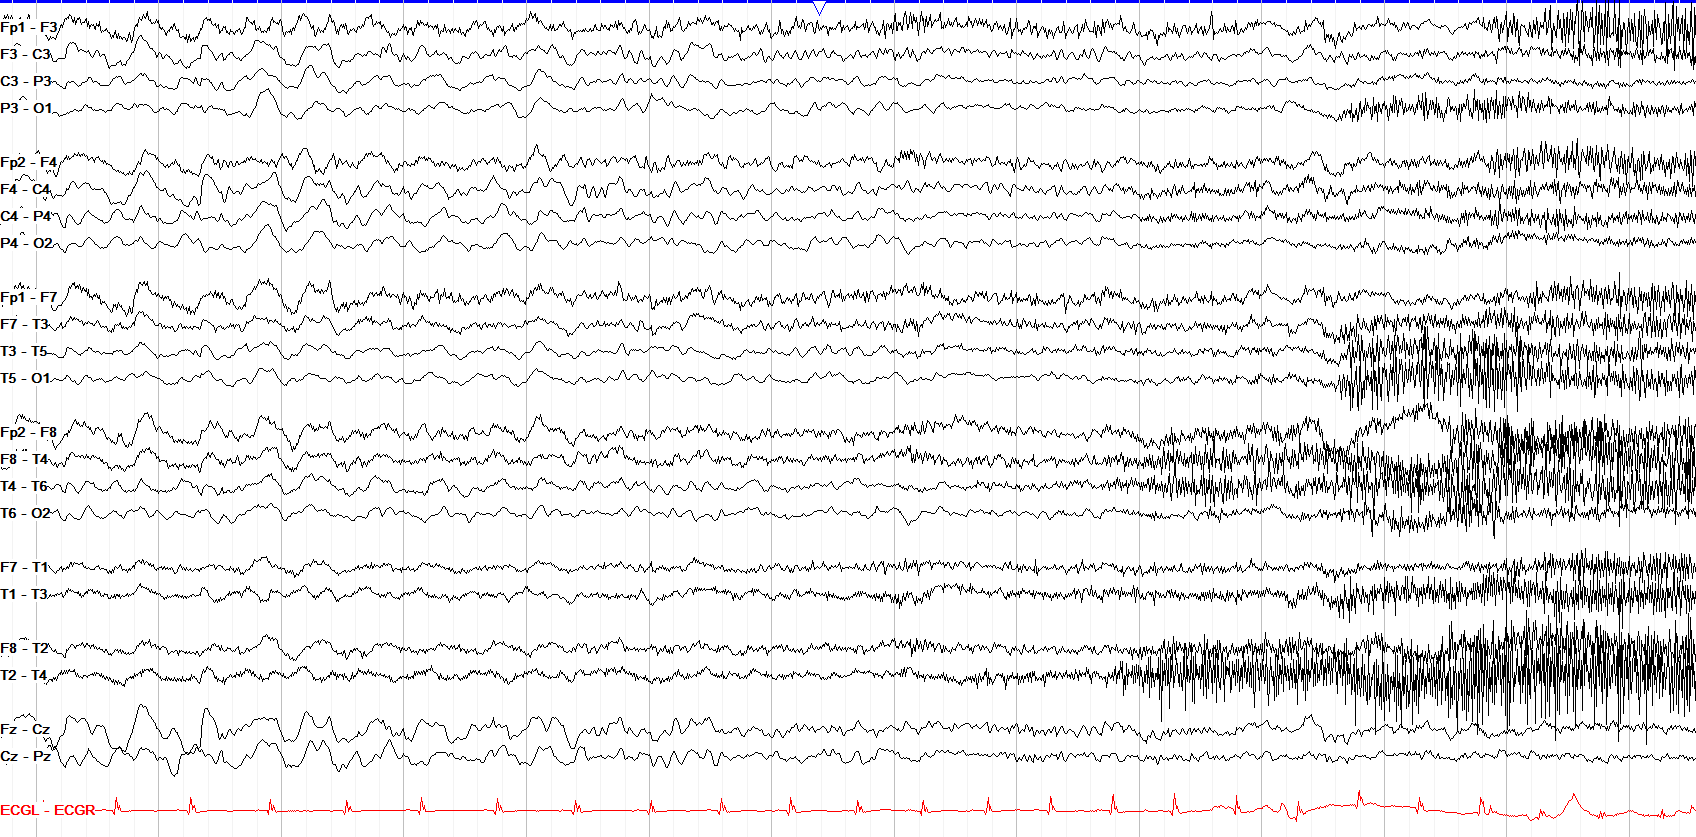
Another example of arousal from slow wave sleep; note the loss, over several seconds, of the diffuse delta activity of slow wave sleep, and re-emergence of faster activities and myogenic artifact.
REM sleep
2 patterns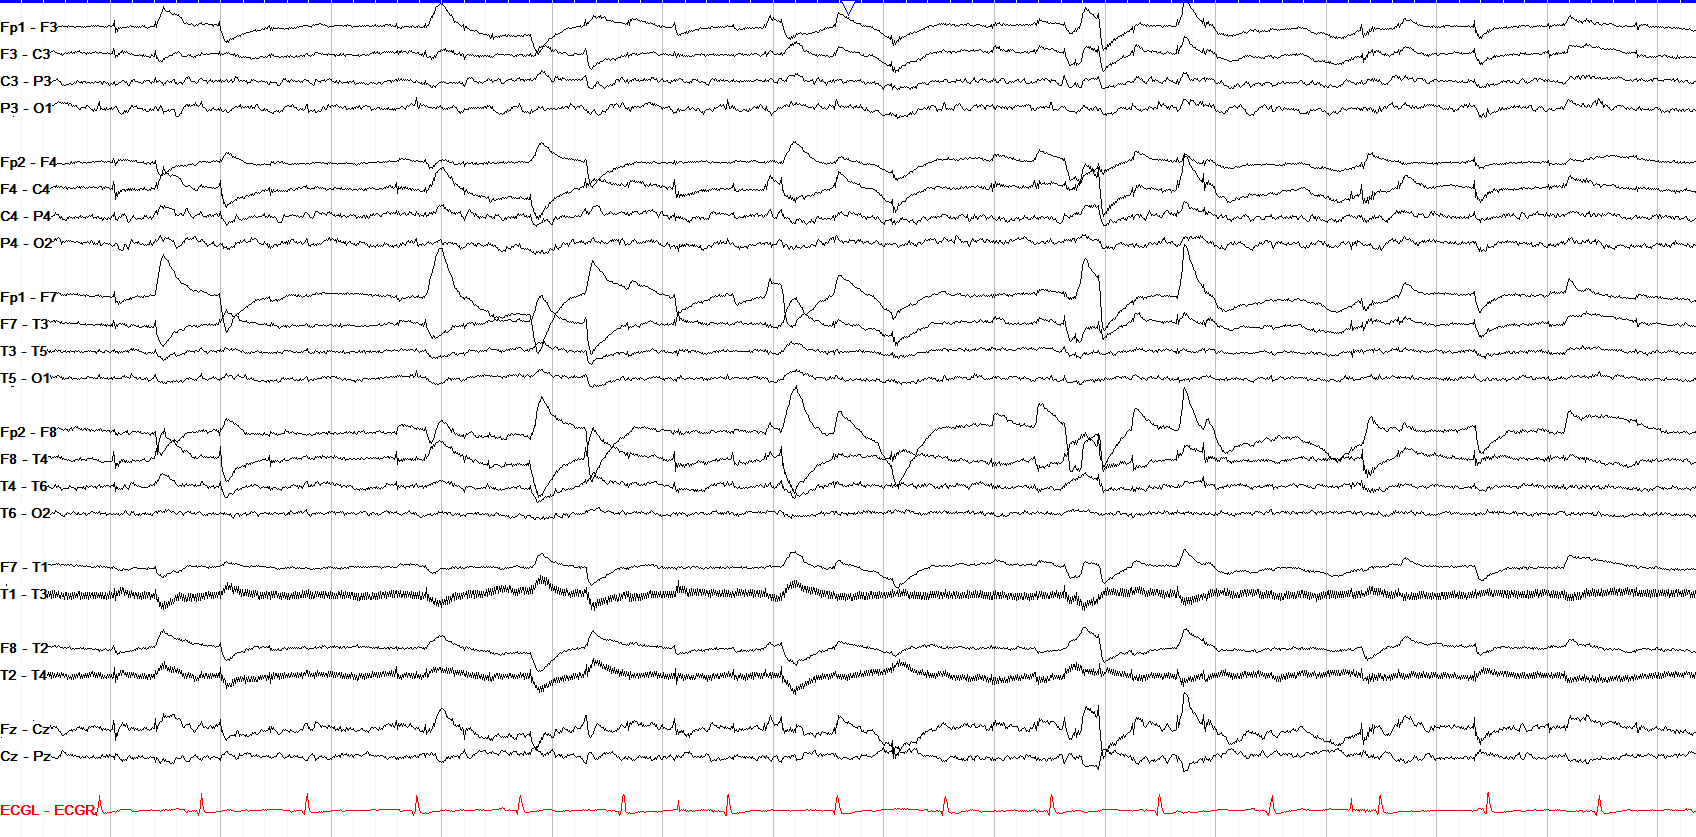
REM sleep is characterized by lateral eye movements, seen on EEG as opposing polarities at F7 and F8. This happens because the cornea is positive, so when the eyes look to the right, F8 sees a positive and F7 sees a negative charge.
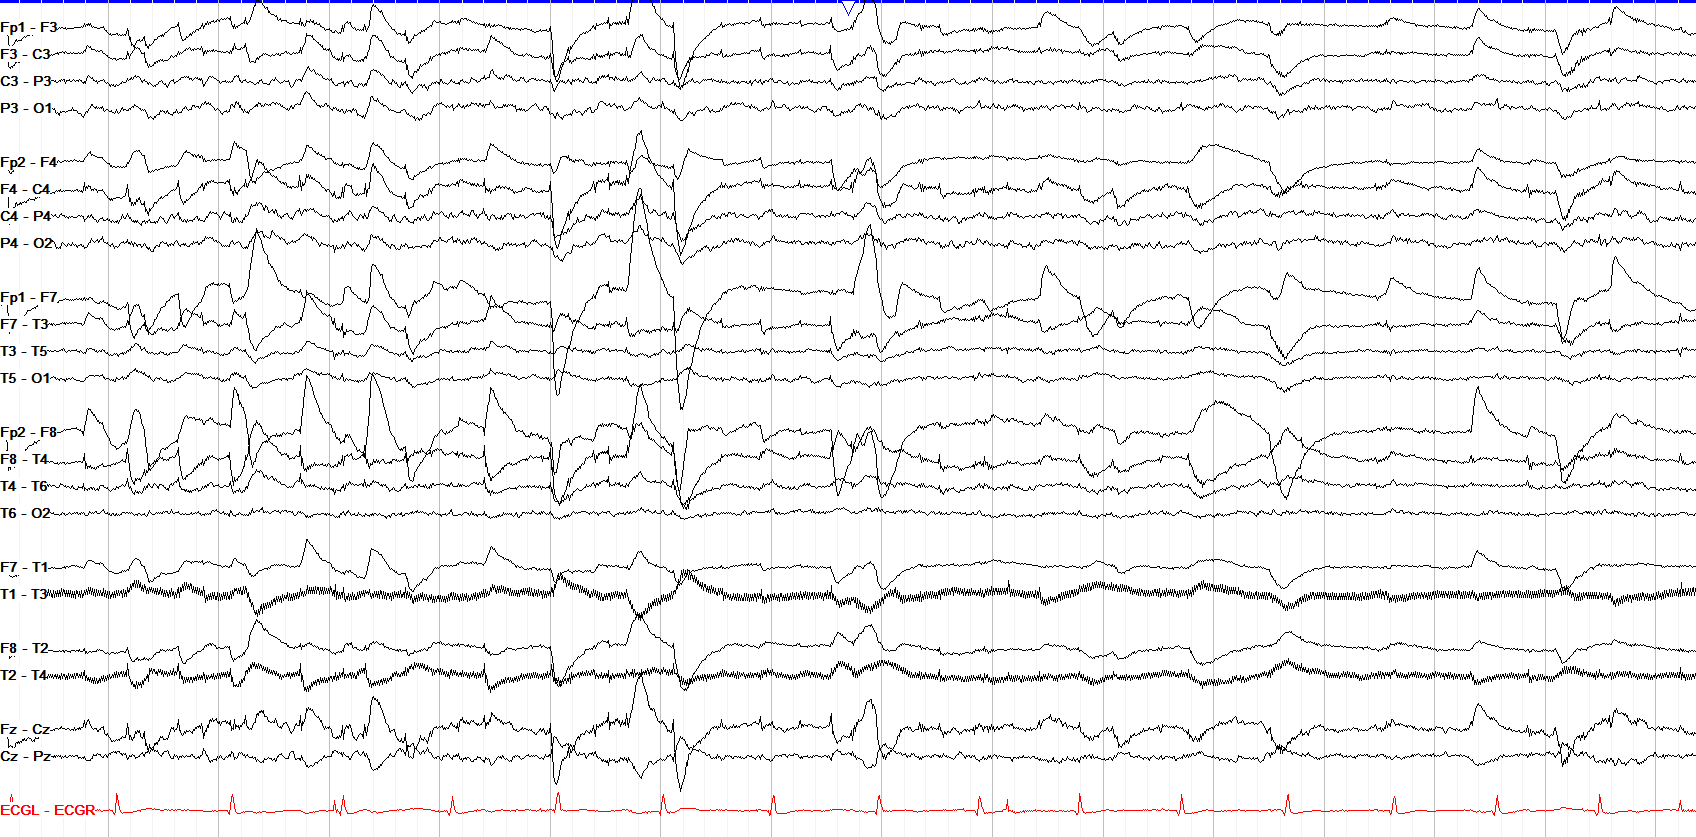
Another way to think about lateral eye movements is that the side where the frontal waves diverge is positive and that's the side to which the eyes are looking, and the side where the waves converge is negative and that's the side from which the eyes are looking away.
eye movements
5 patterns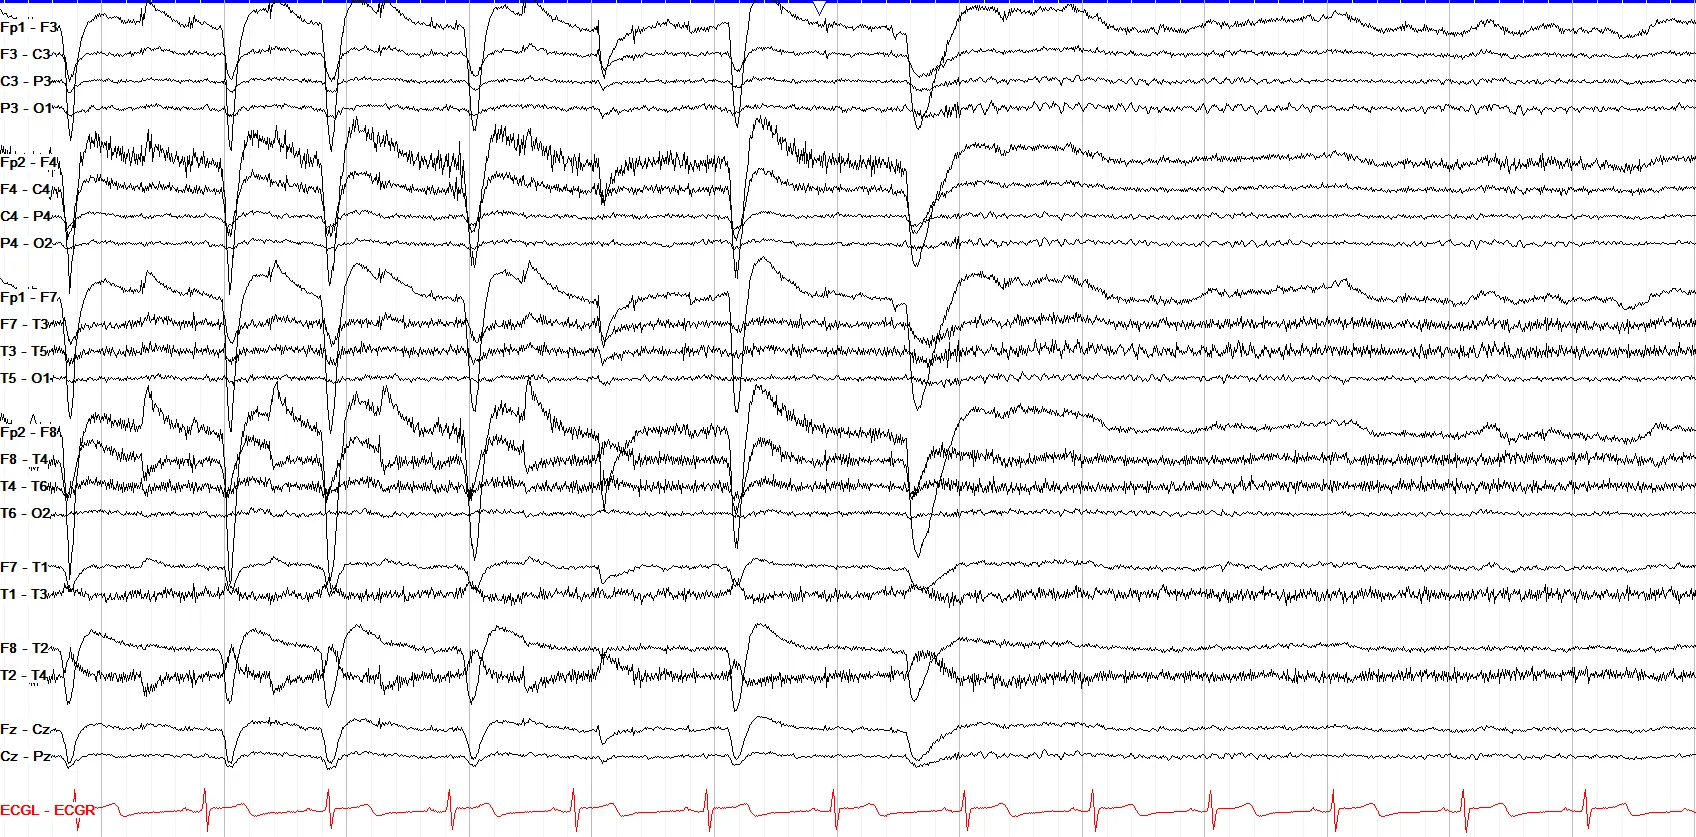
Eye blinks are a large positive frontal deflection, due to Bell's Phenomenon. When you blink, the eye rolls slightly up and the negative retina moves away from the Fp1 and Fp2 electrodes, which thus become relatively positive.
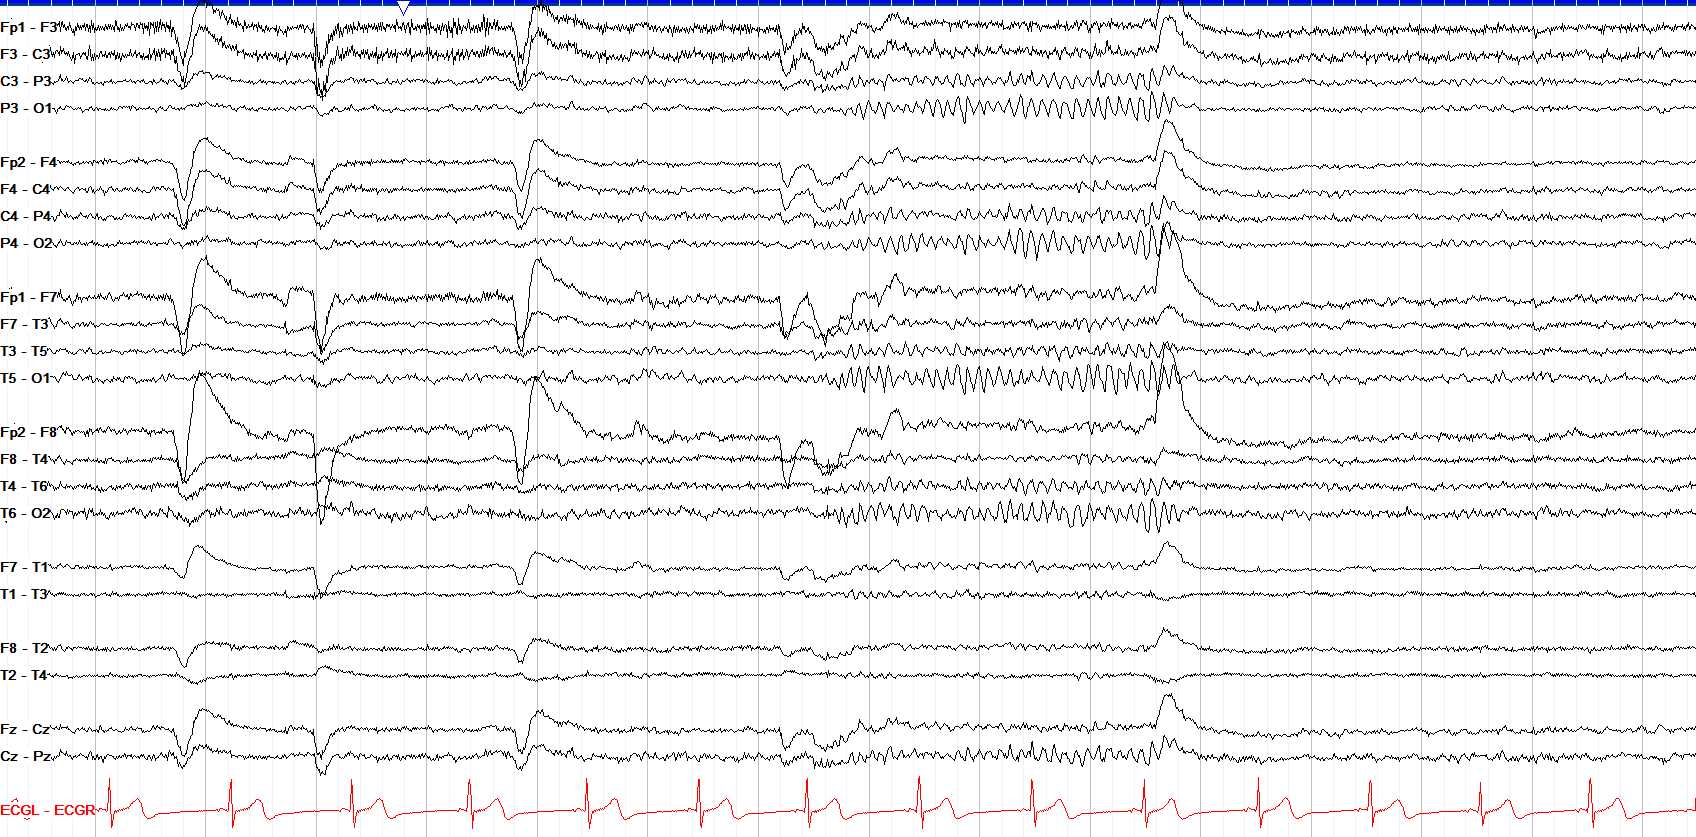
Eye closing corresponds to a large frontal positive deflection, and eye opening to an opposing negative deflection. Note that eye movement artifact doesn't have a significant field posteriorly.
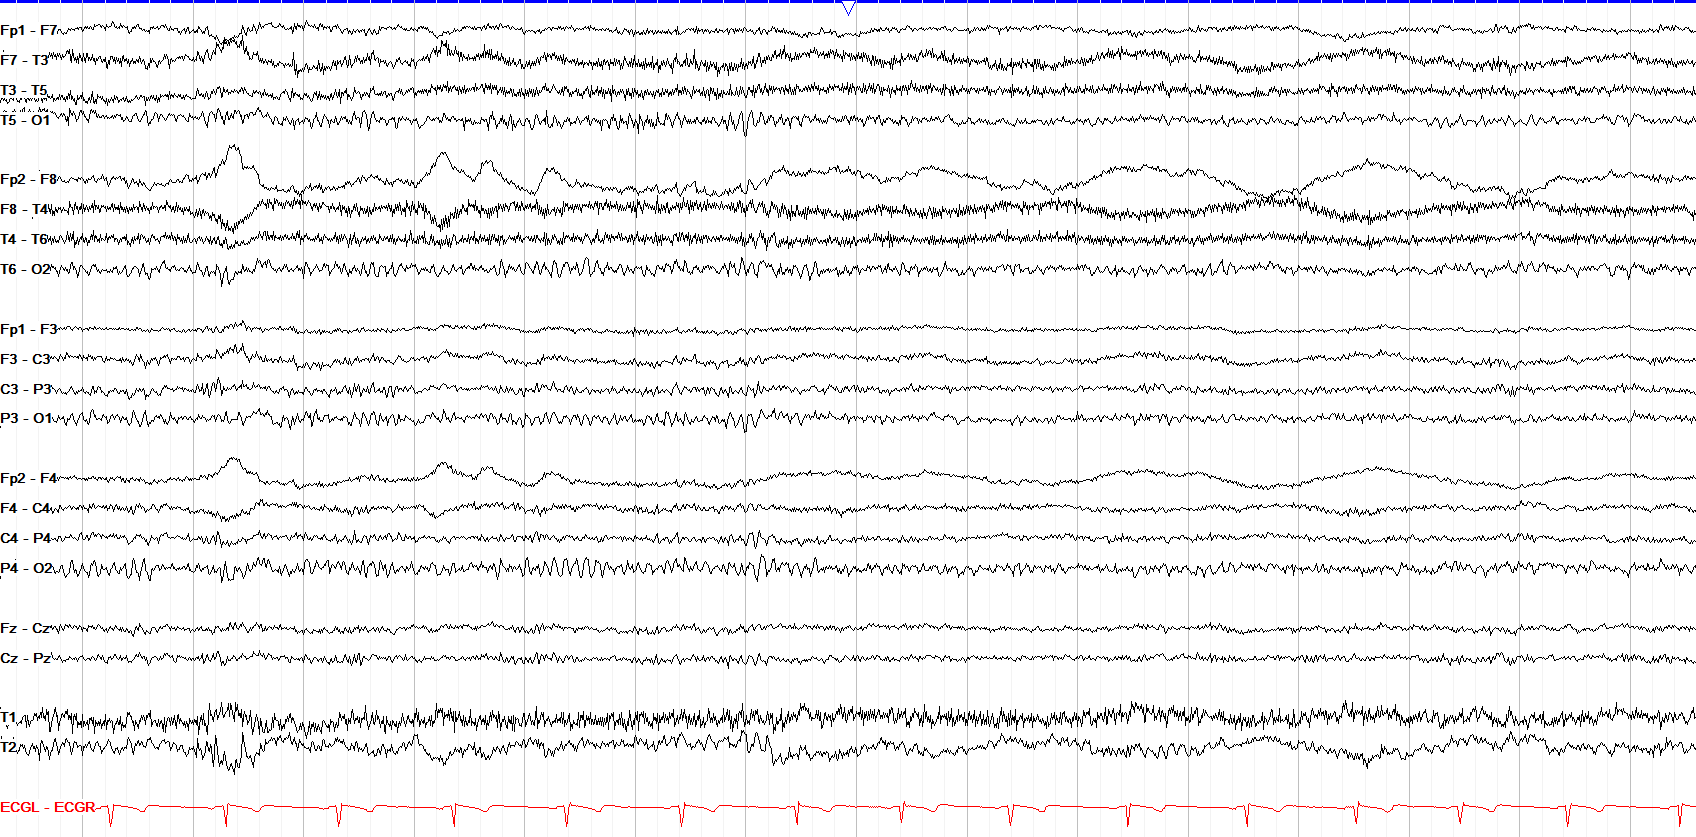
Lateral eye movements are marked by a frontal (F7/F8) positive deflection on the side to which you look with a contralateral negative deflection, due to the cornea's positive charge.
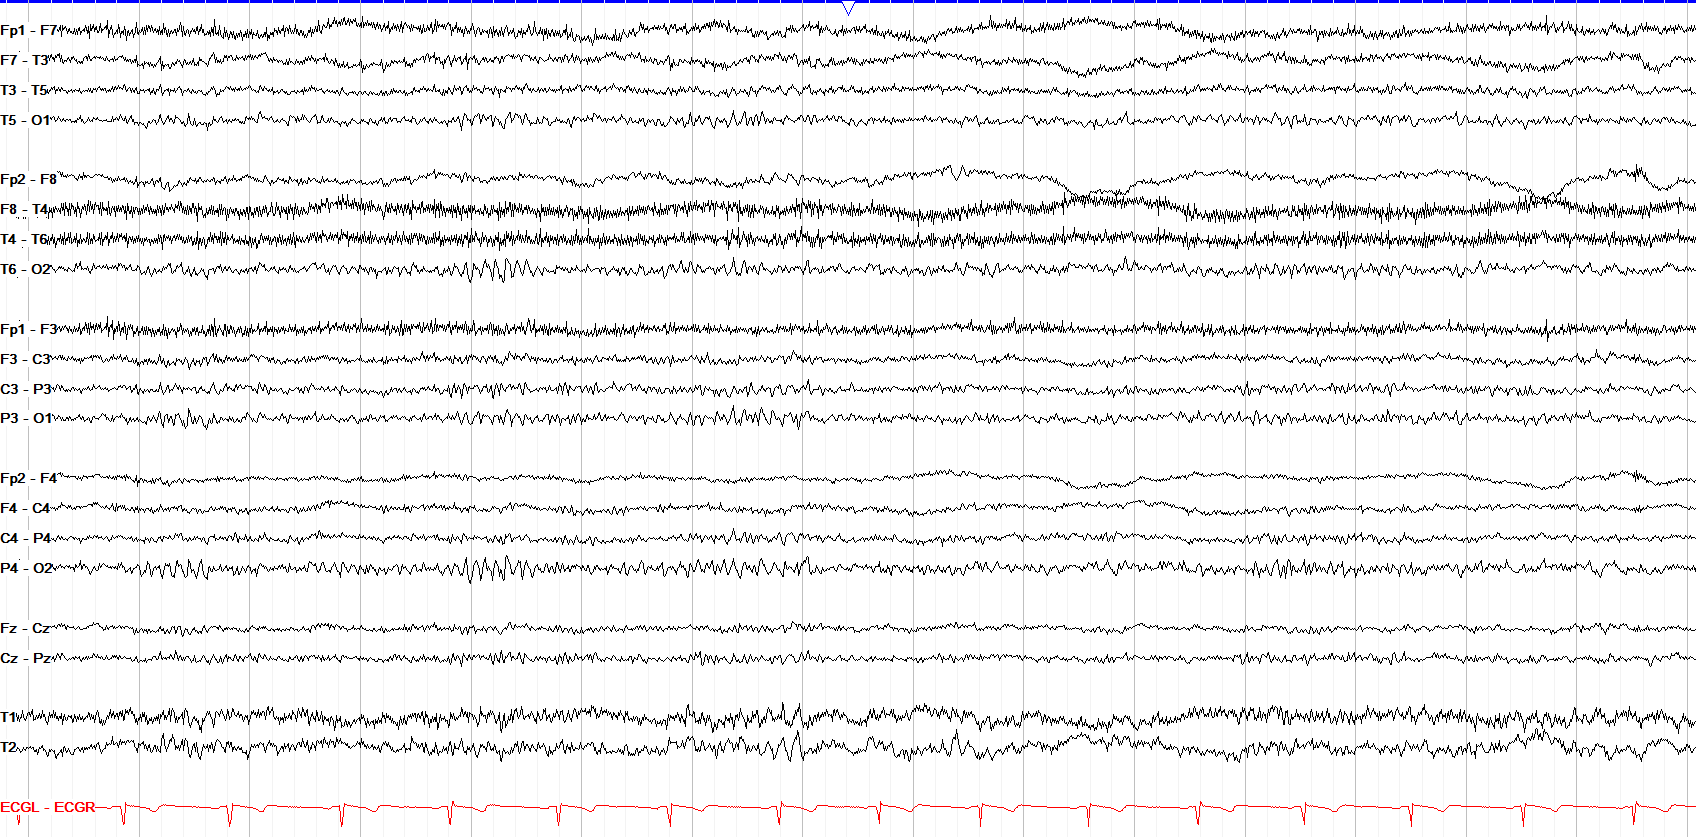
With lateral eye movements, you look to the positive side. Lateral eye movements are most easily seen in REM sleep, but in drowsiness you also see slower, roving lateral movements.
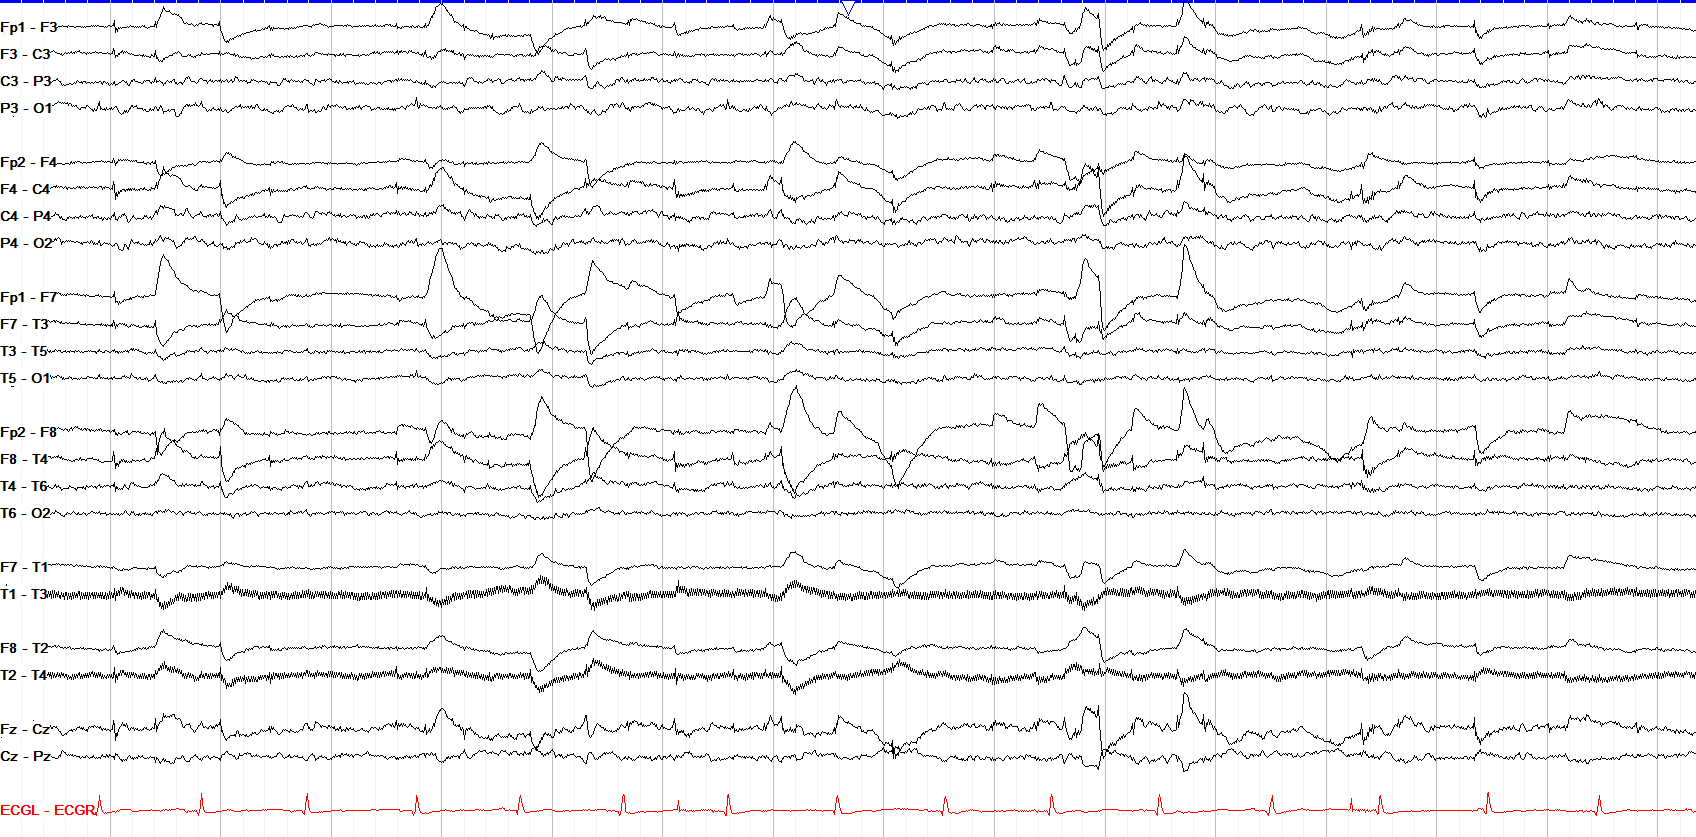
Note that most lateral eye movement artifact has a steeper upslope than downslope. Don't mistake lateral eye movement for electrode pop, which looks similar but is confined to a single electrode.
physiologic & movement
12 patterns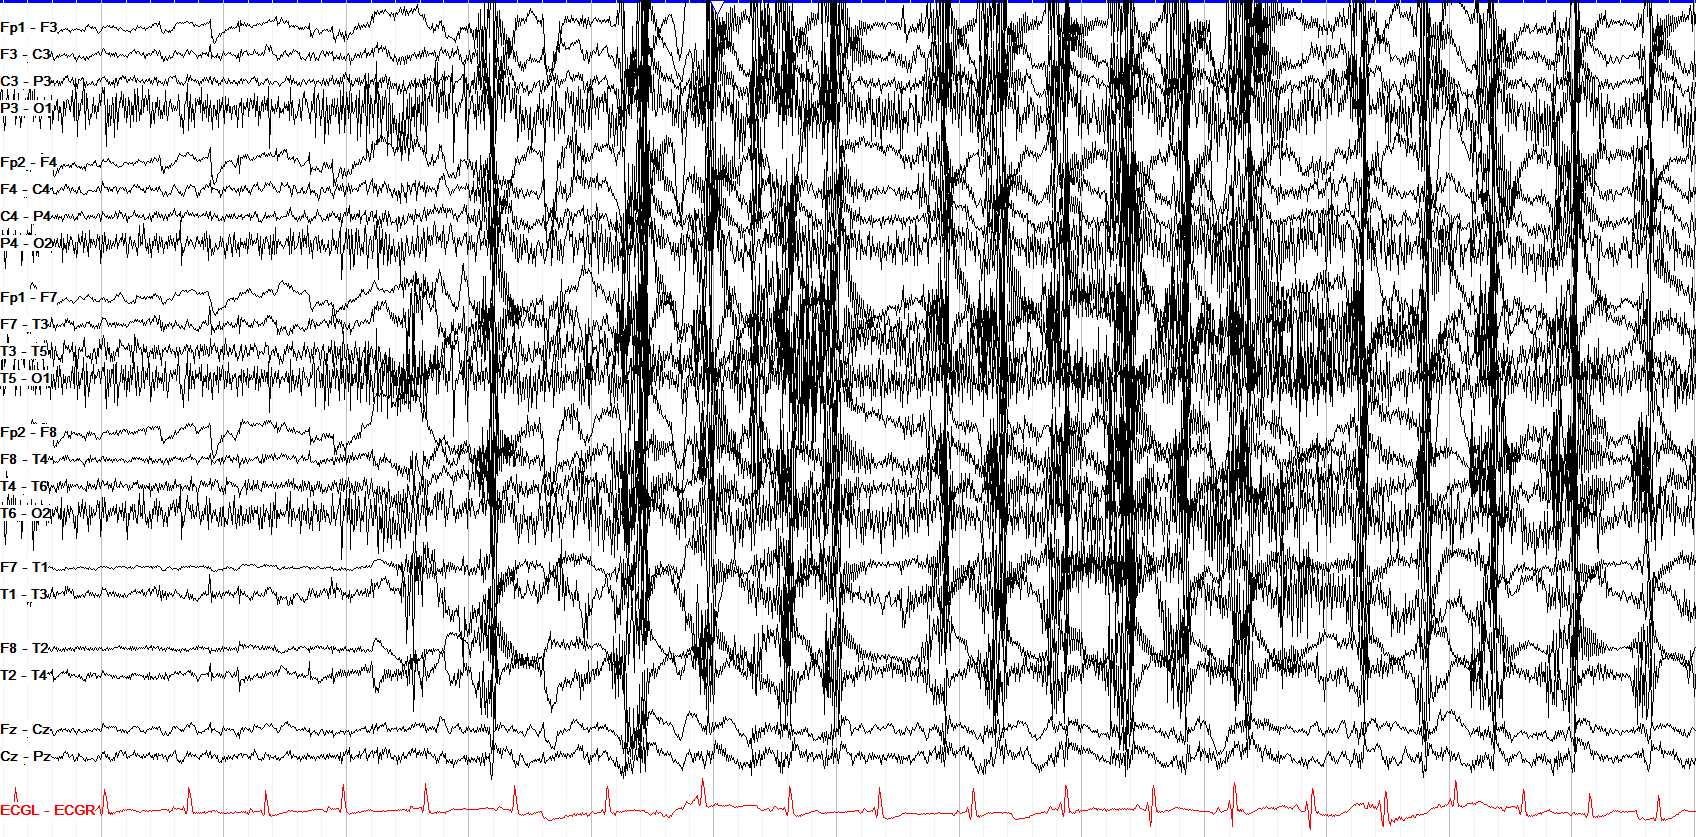
Chewing artifact arises from the myogenic activity of the temporalis muscles while you chew. Its marked by bursts of generalized fast activity, often with underlying hypoglossal artifact.
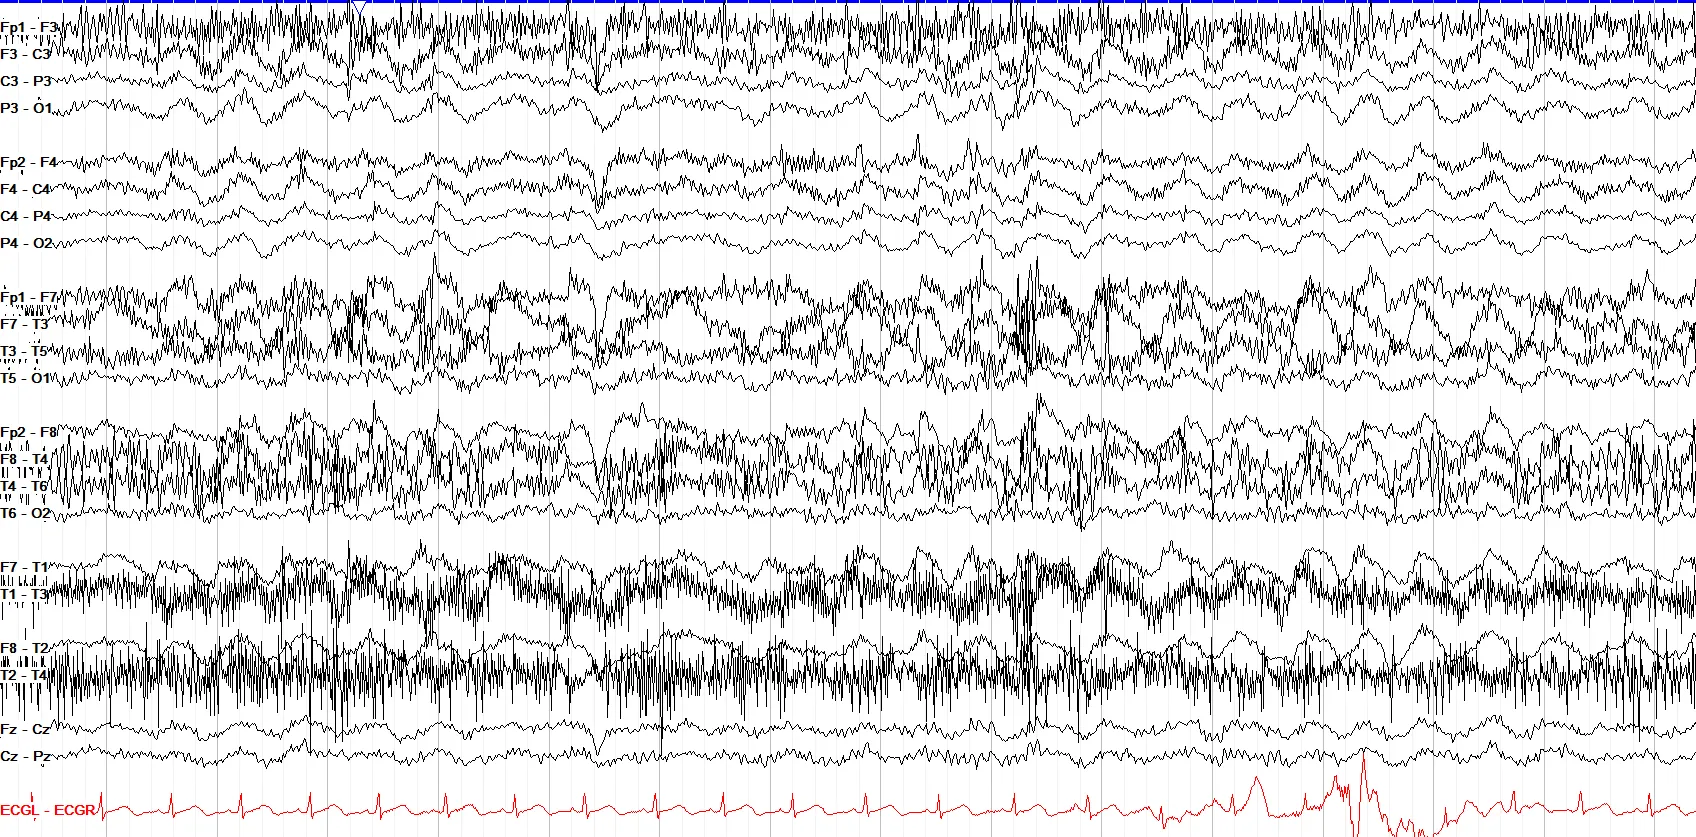
Hypoglossal, or tongue, artifact is seen as diffuse slow, synchronized activity. It arises from the mechanical movement of the tongue itself.
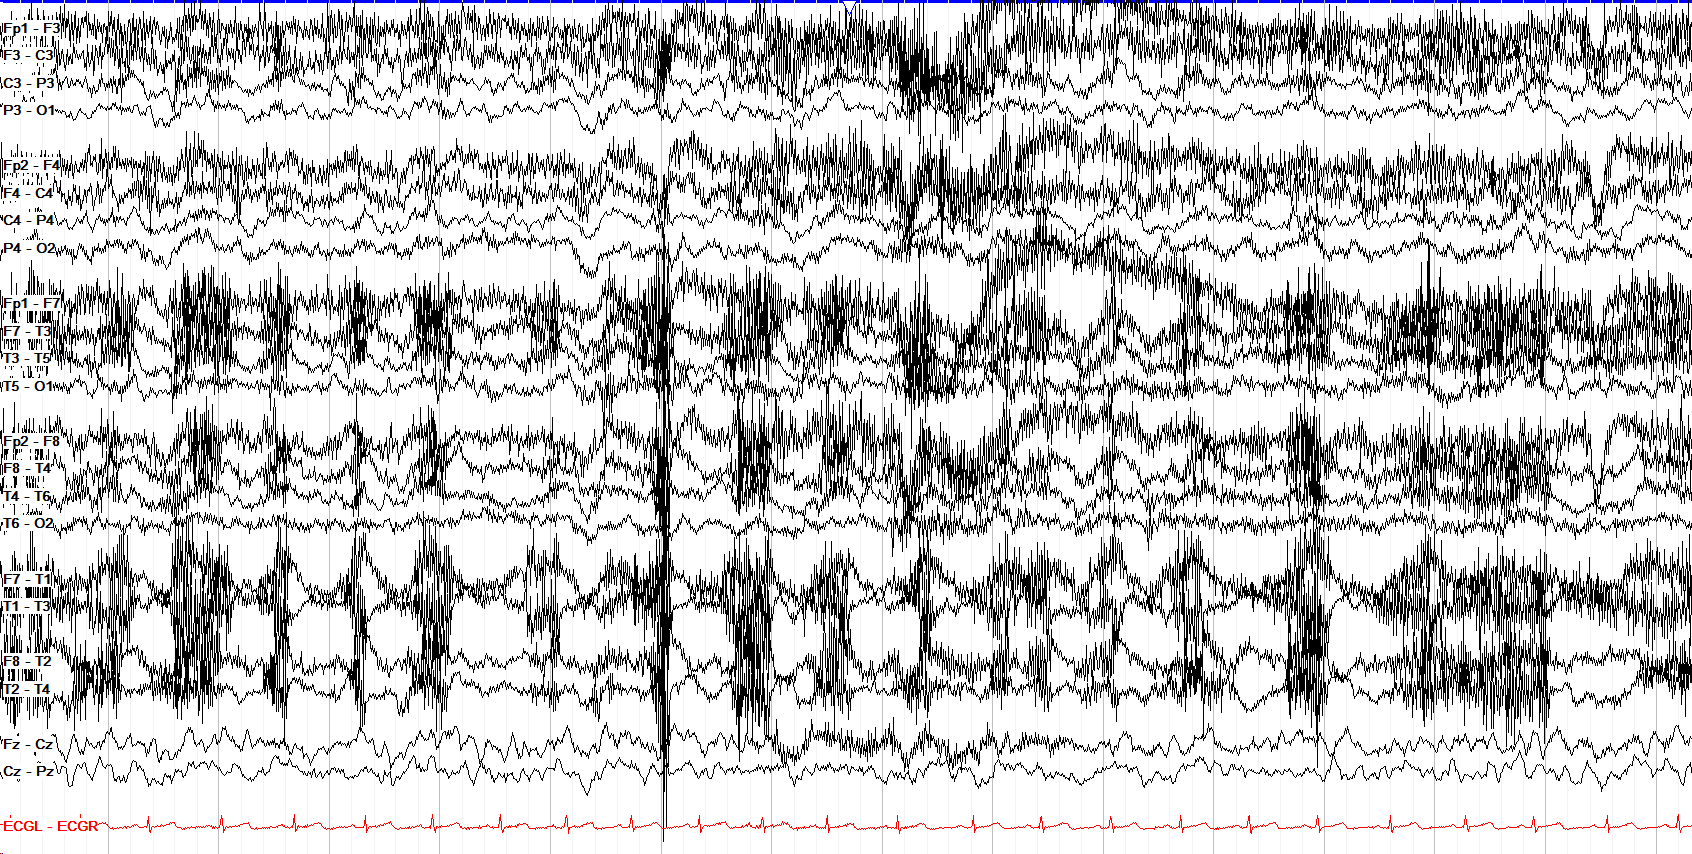
Tongue and chewing artifact often, but don't always, come together. Obviously, they are seen more during eating.
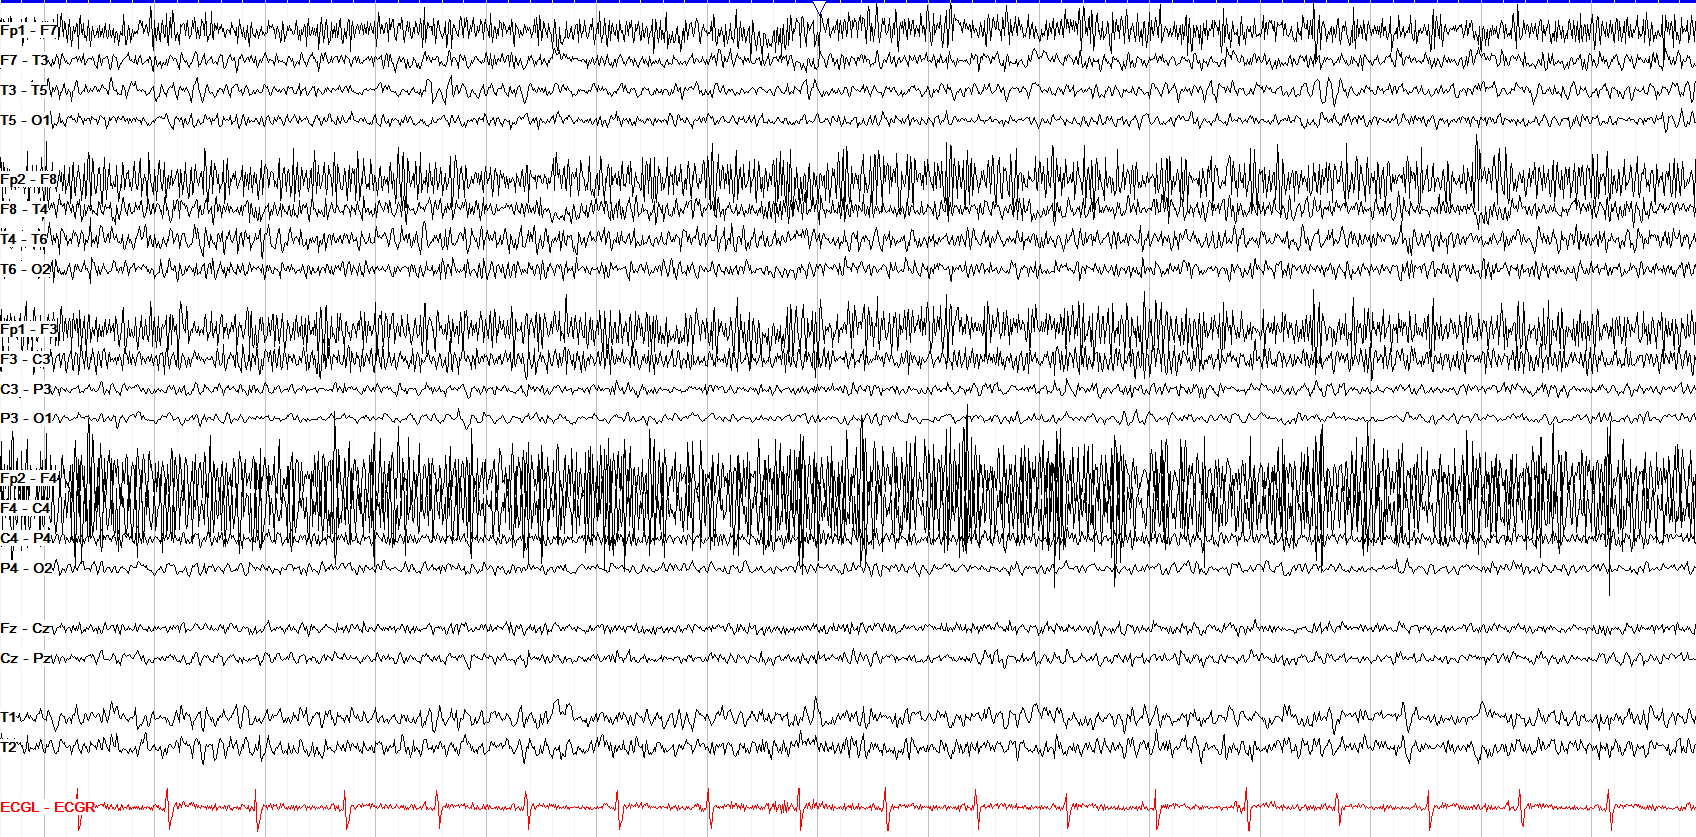
Muscle, or myogenic, artifact is seen as very fast activity often overlying the normal cerebral rhythms. It tends to be more prominent frontally, and is minimal at the vertex.
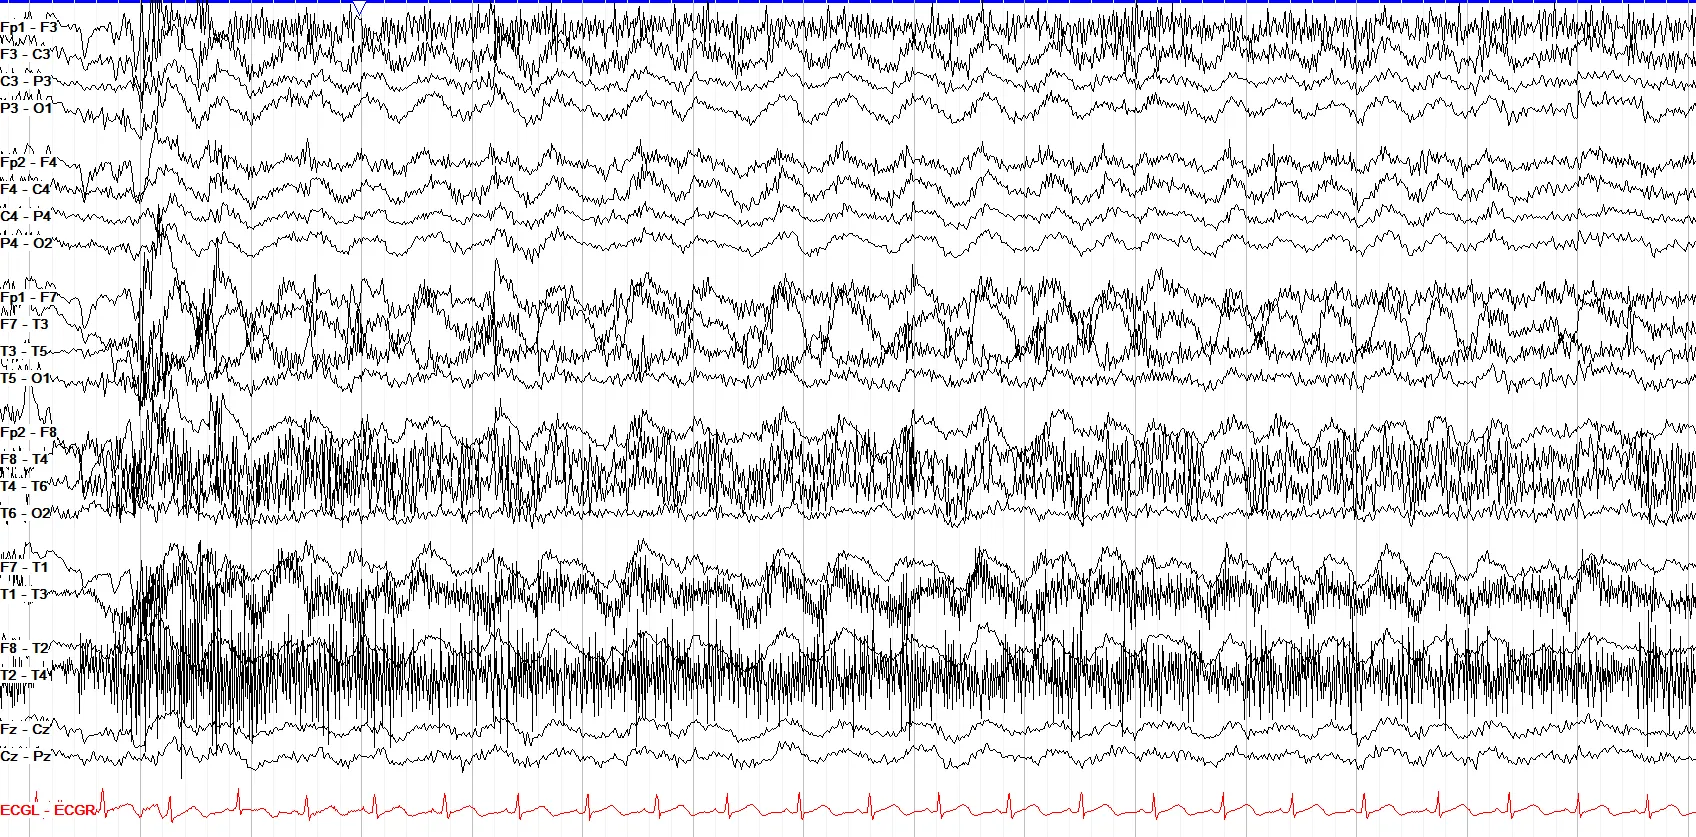
If you're not sure if something is tongue artifact, ask the patient to say "la la" or push their tongue into their cheeks to see if the EEG changes.
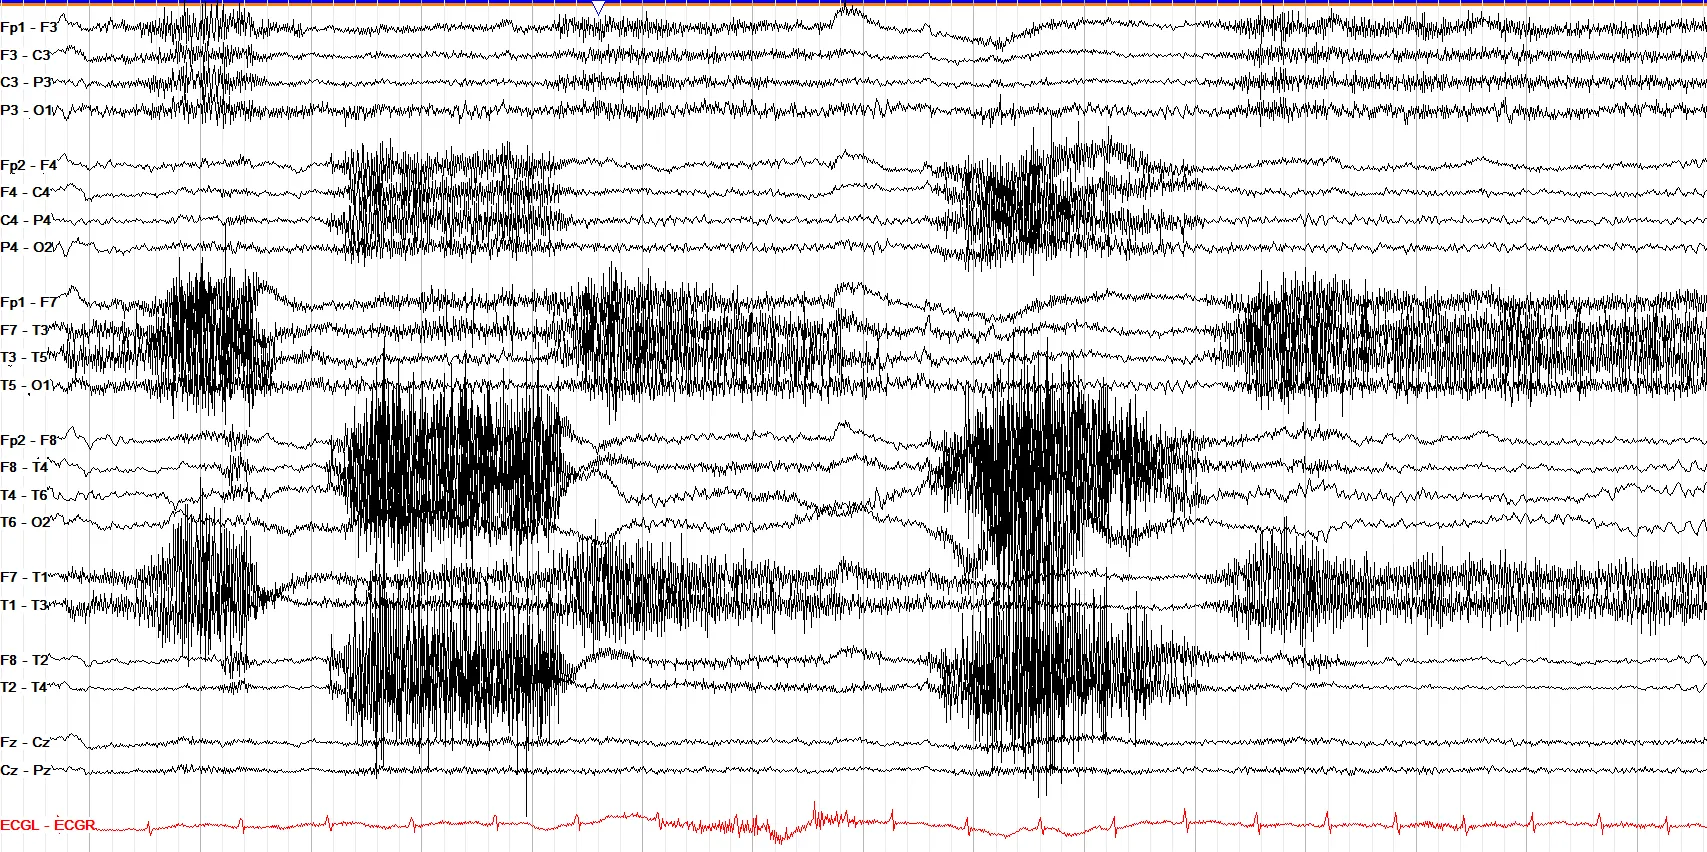
Bruxism, or tooth grinding artifact, is seen as a broad checkerboard pattern of alternating, lateralized myogenic activity that arises from the alternating contraction of masticatory muscles.
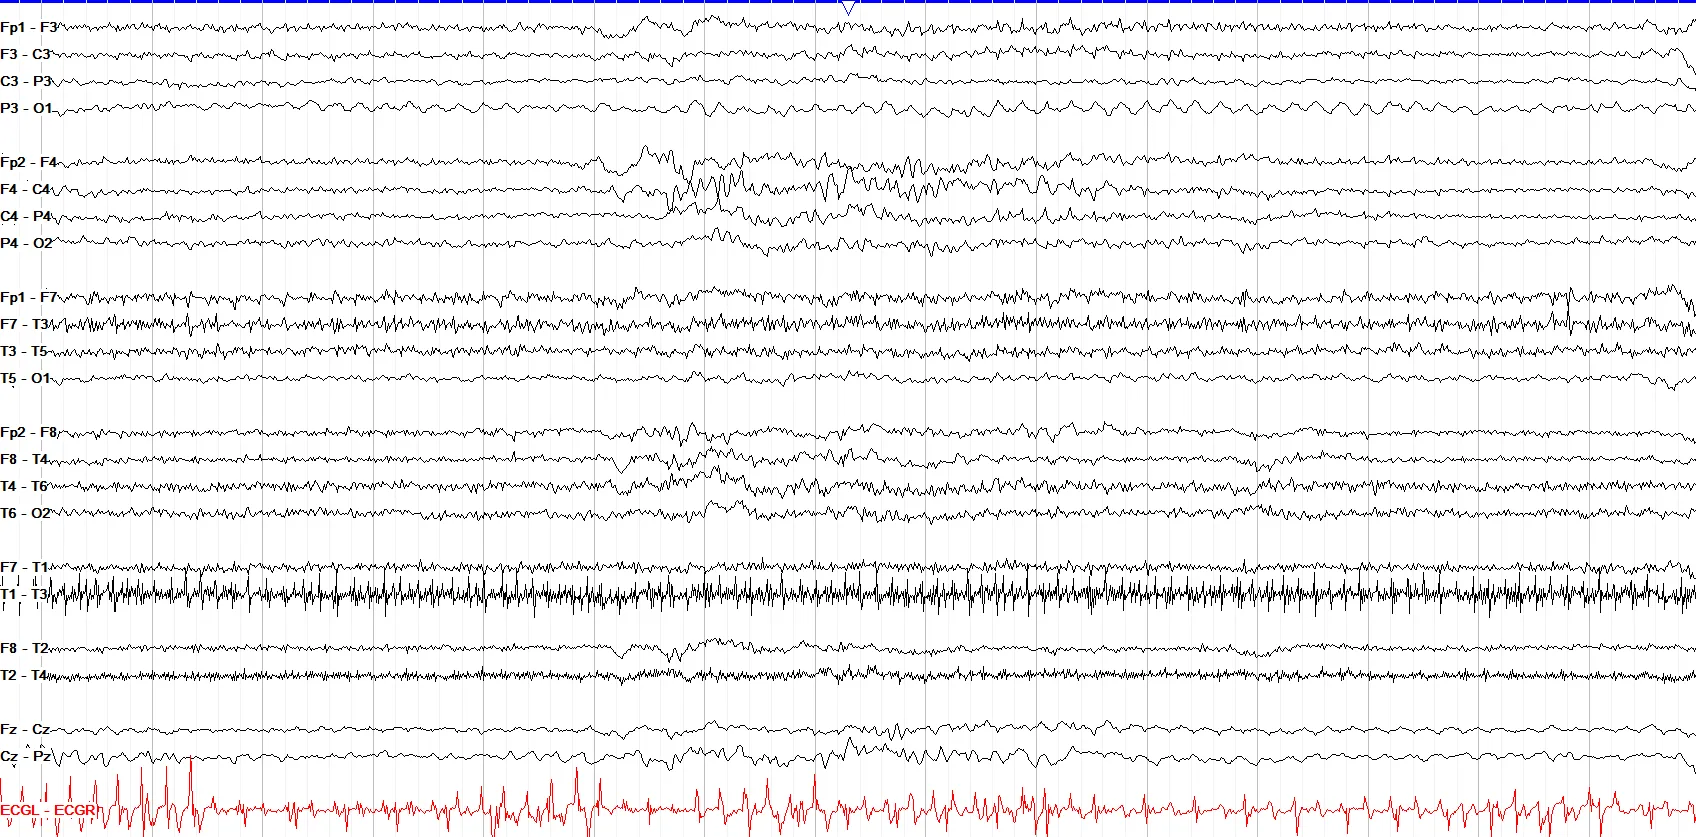
Chest PT is done by repetitive tapping on the chest, and can appear as rhythmic movement artifact on EEG. Don't confuse it for seizure, which requires evolution in time and location.
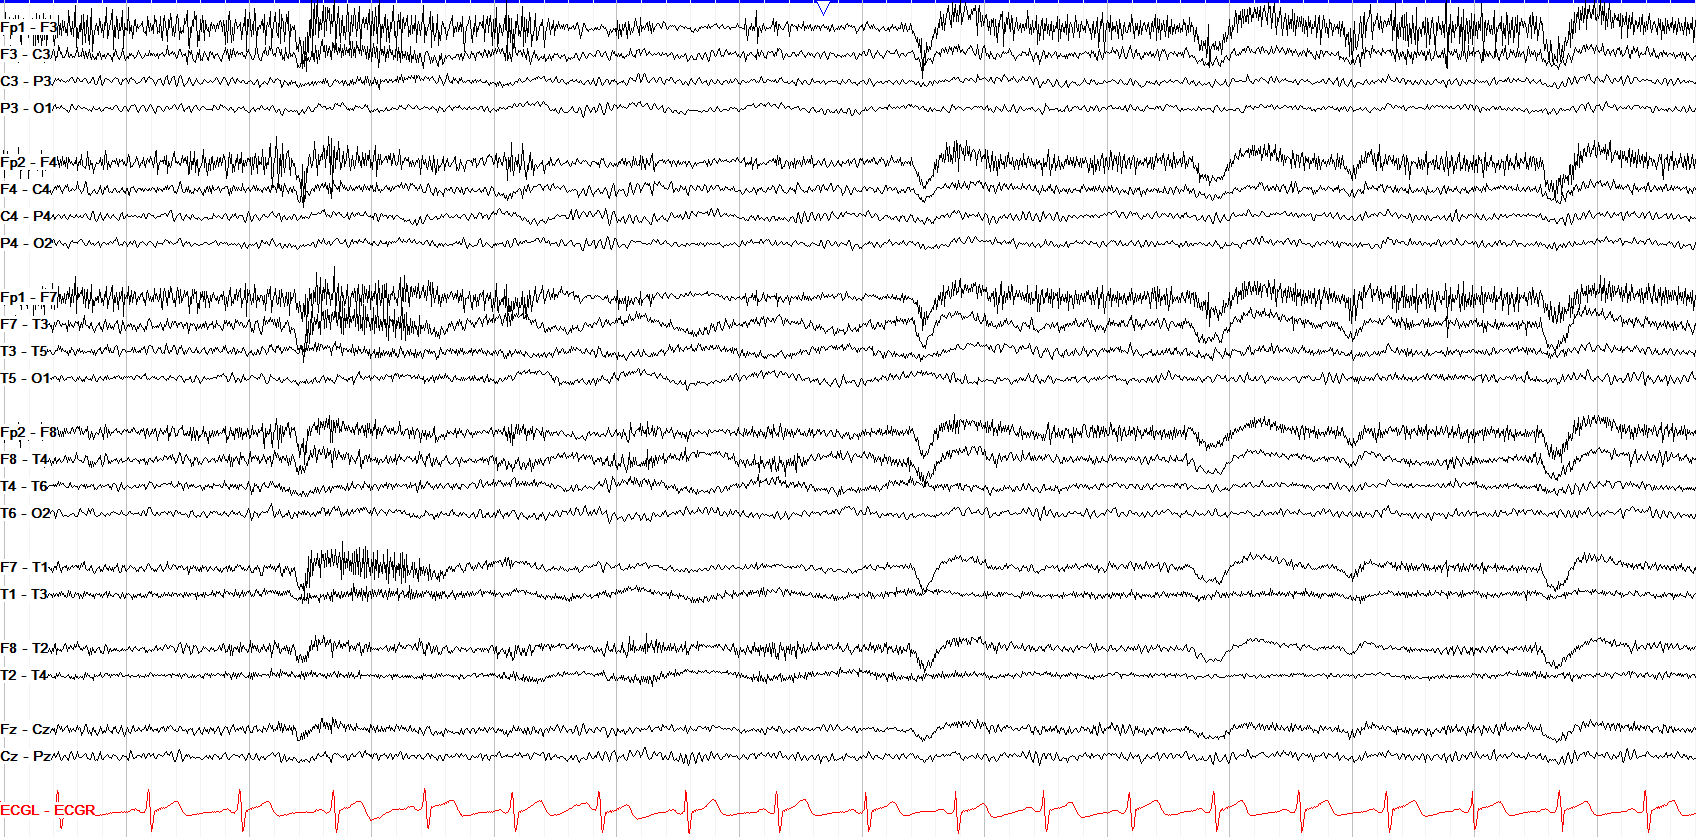
Head shaking is just a type of movement artifact, but because we often shake our head yes or no in a rhythmic fashion, it appears rhythmic on EEG.
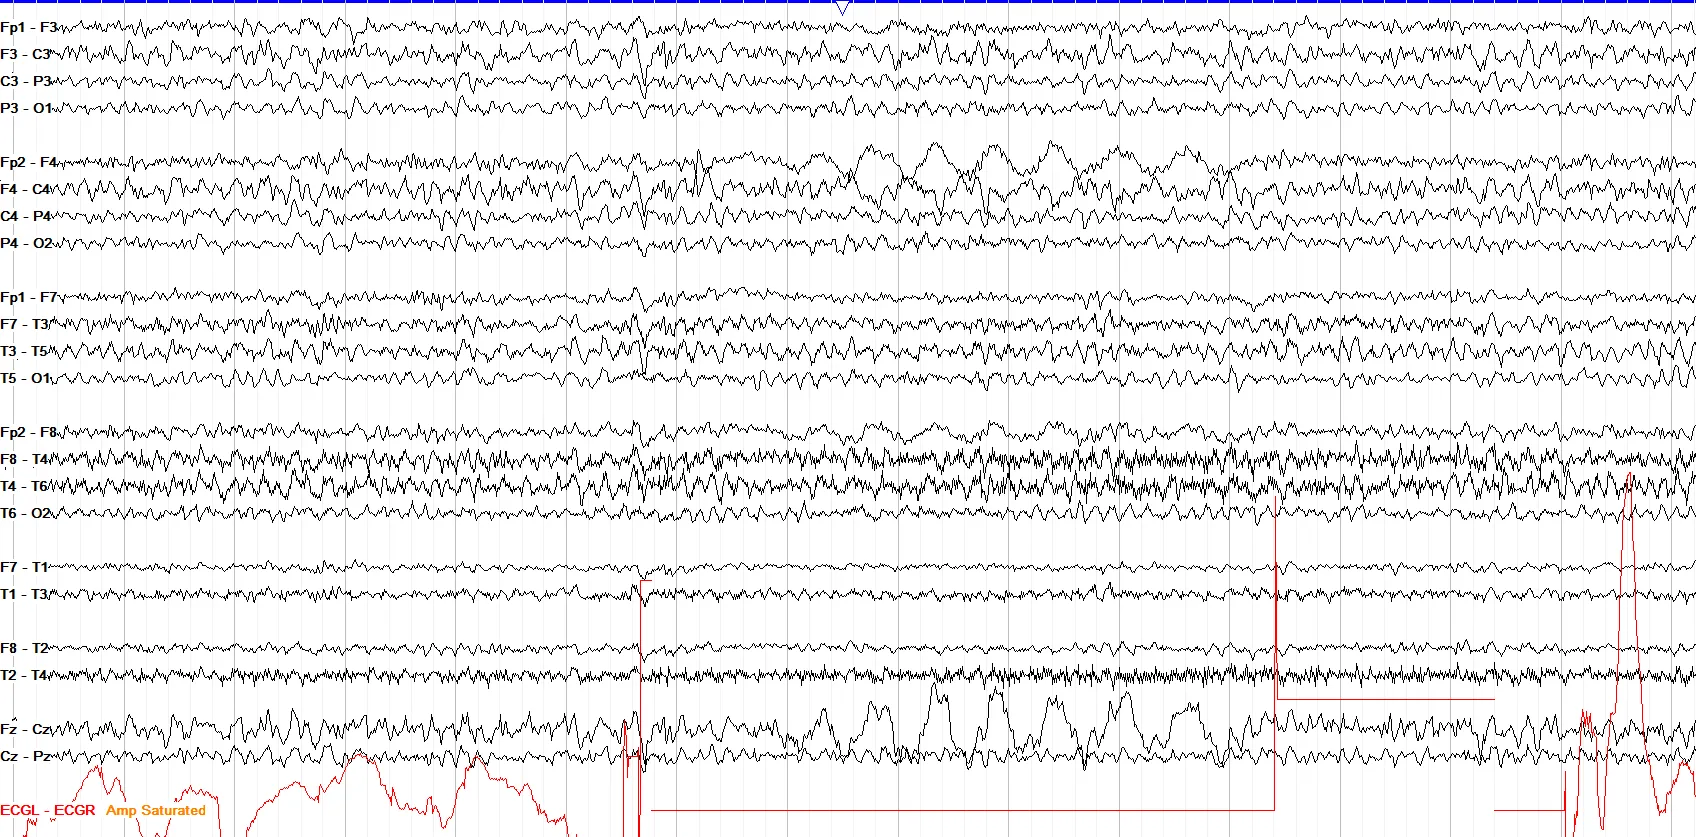
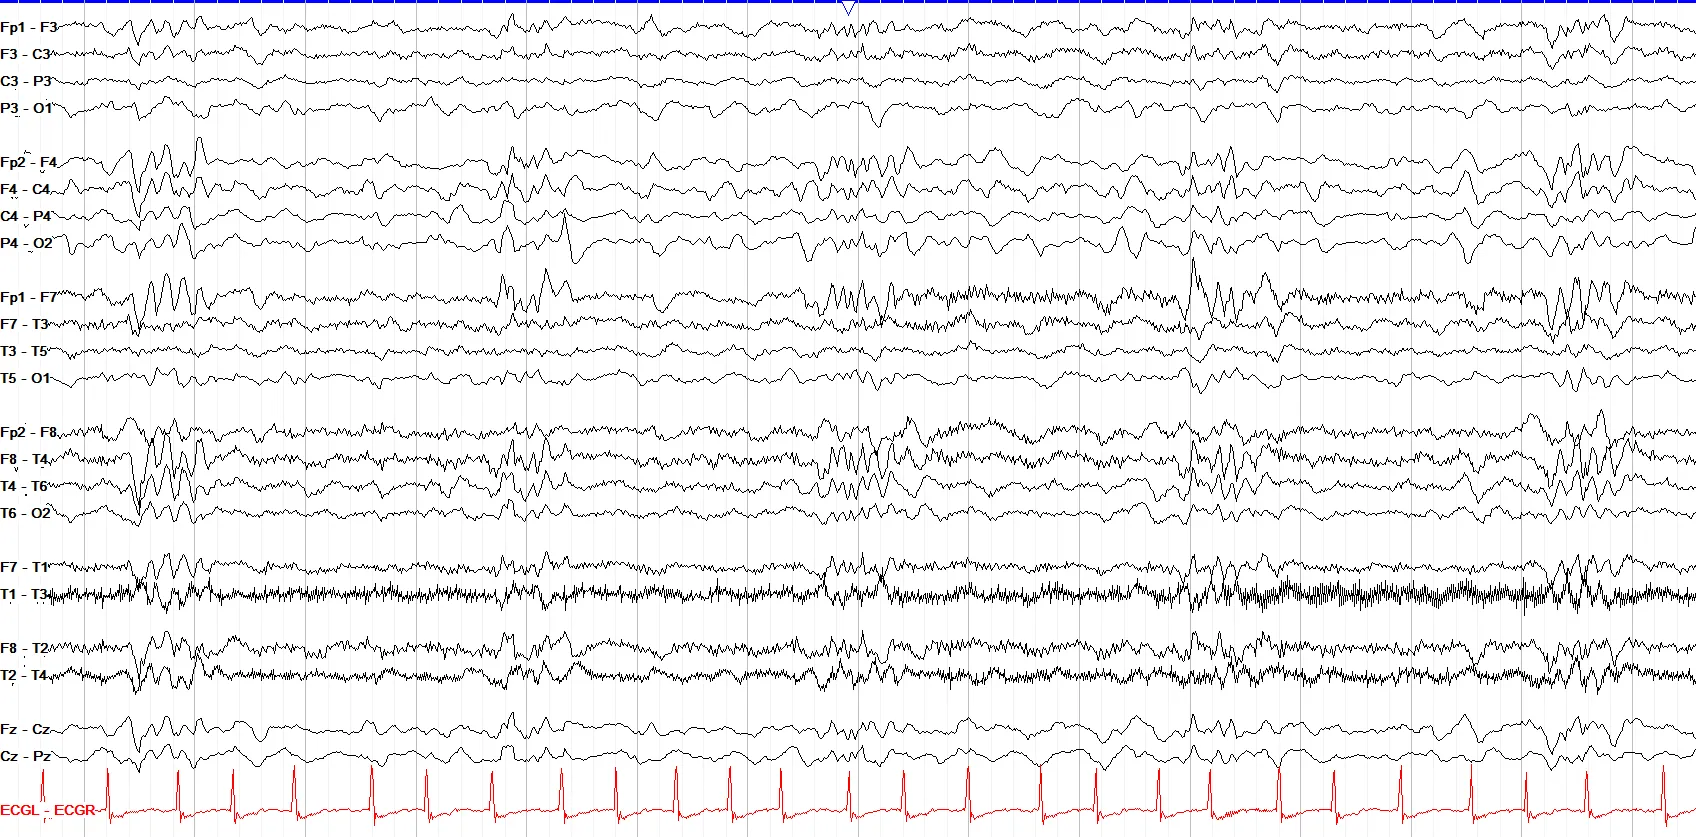
This burst of right frontally predominant rhythmic activity at first glance may appear like a lateralized rhythmic delta activity (LRDA). However, note the significant ECG strip artifact in the same period, suggestive of artifact. Moreover, the video of this tracing showed the patient rubbing their head.
In patients intubated and sedated, mucous bubbles in the nose may vibrate with exhalation and inhalation, leading to bursts of activity that are time locked with their breaths.
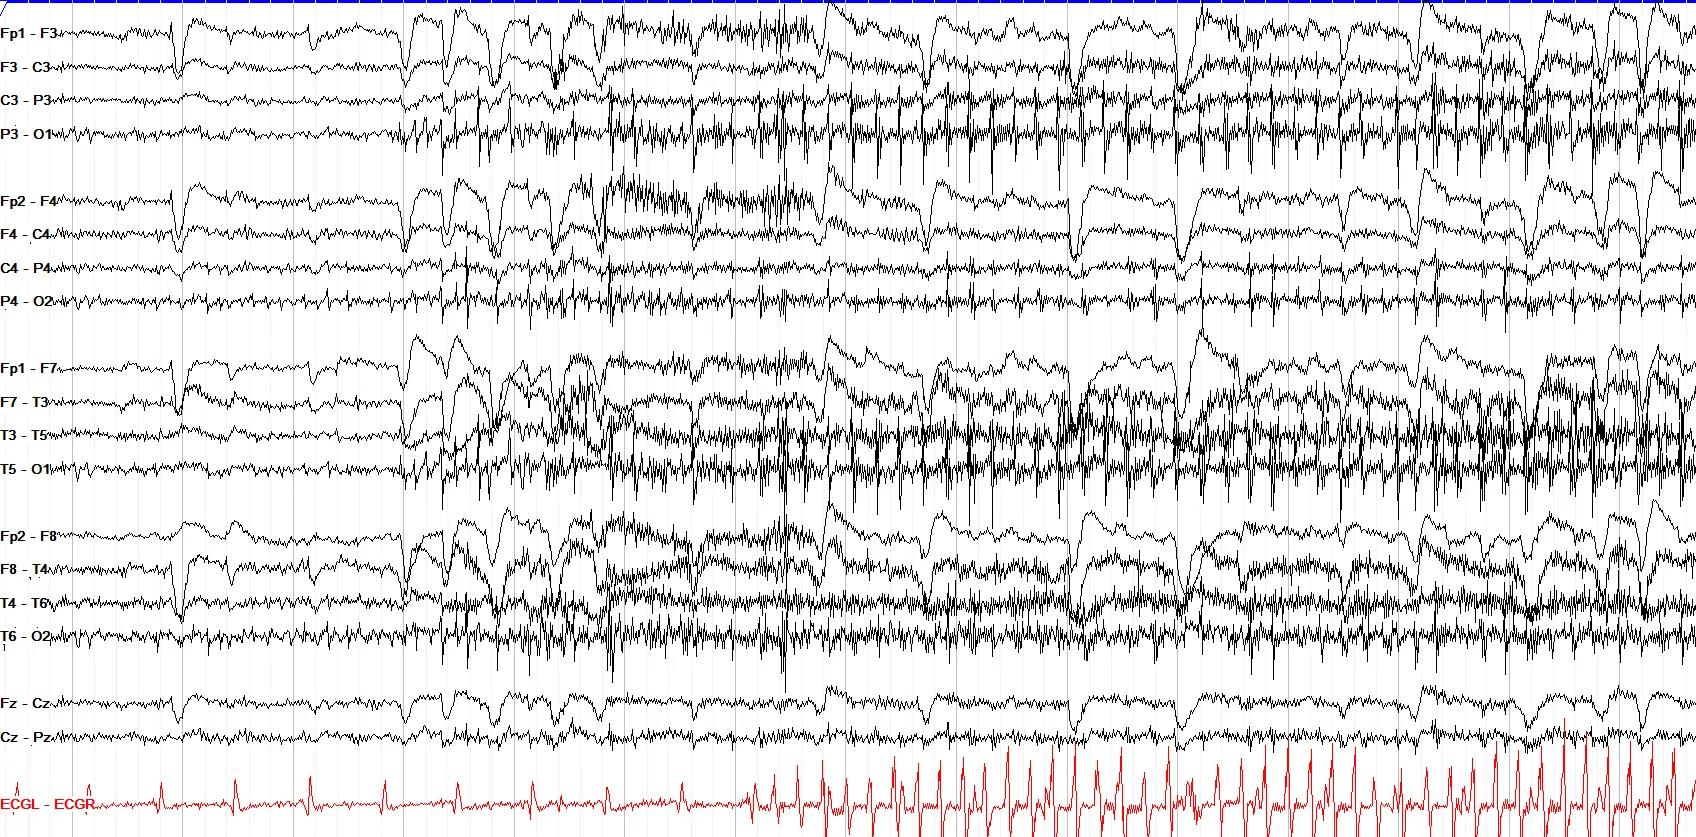
Note here how the sudden onset, diffuse bursts of myogenic fast activity coincide with similar artifact in the ECG strip, and lack any clear evolution as you'd expect with a seizure.
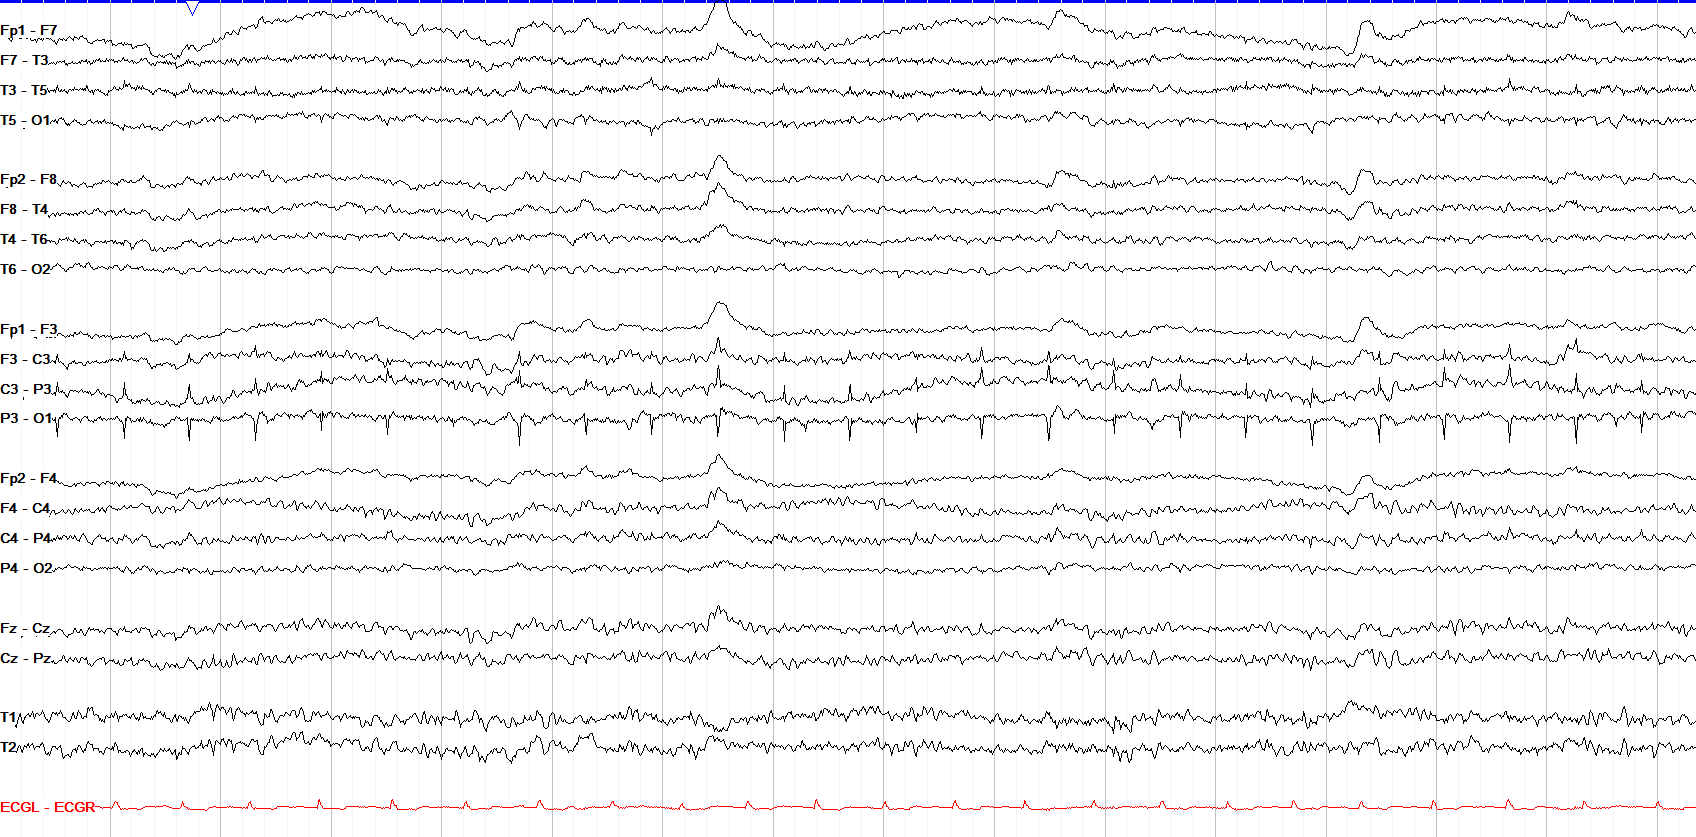
Sweat artifact arises from the sodium chloride in sweat on the skin around the electrodes, and is seen as very slow, usually lower amplitude undulating activity. It can be focal or diffuse. Here we also see P3 electrode pop.
electrical & technical
5 patterns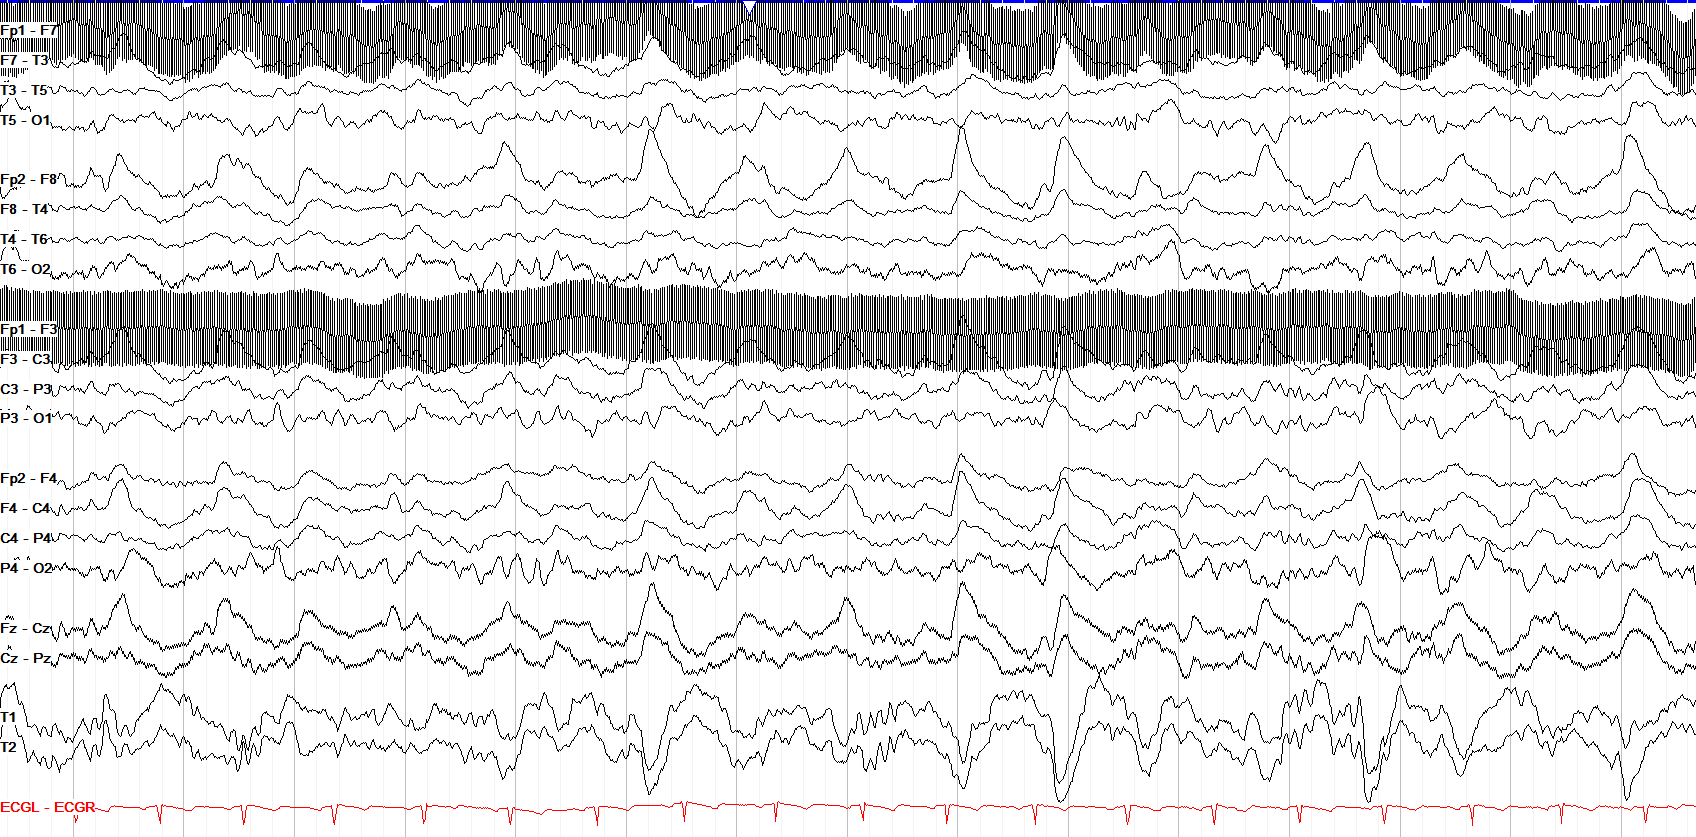
When an electrode gets loose or has insufficient conduction gel, you can see many artifacts, including breakthrough of 60 Hz electrical activity. The notch filter would remove this.
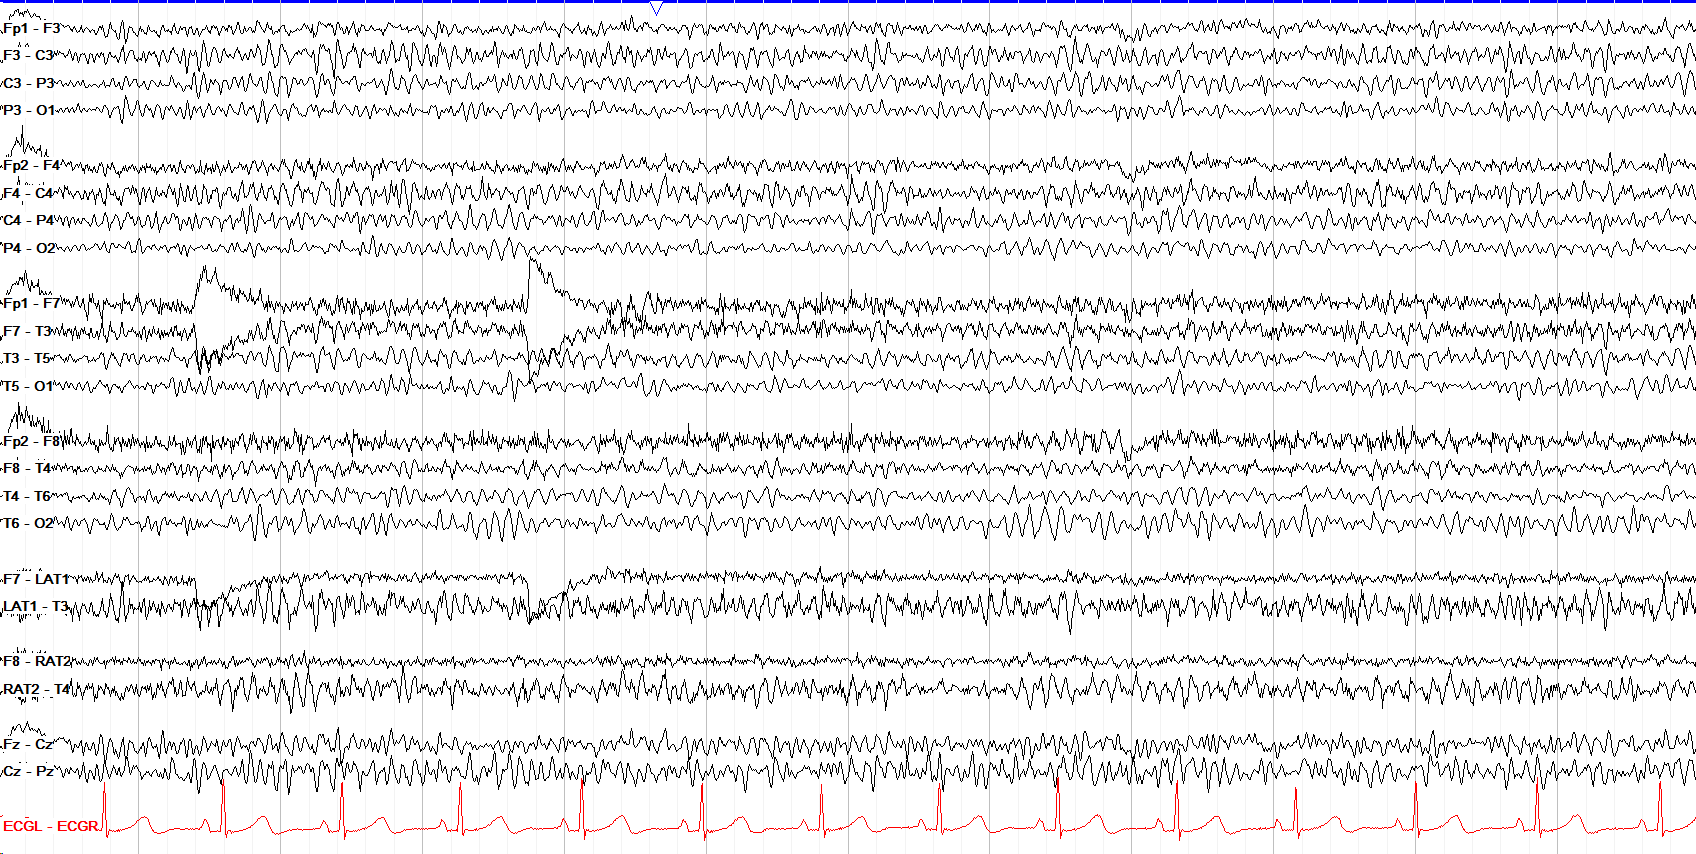
Electrode pop arises most commonly due to a loose electrode, and is marked by a steep positive upslope and slower downslope confined to a single electrode.
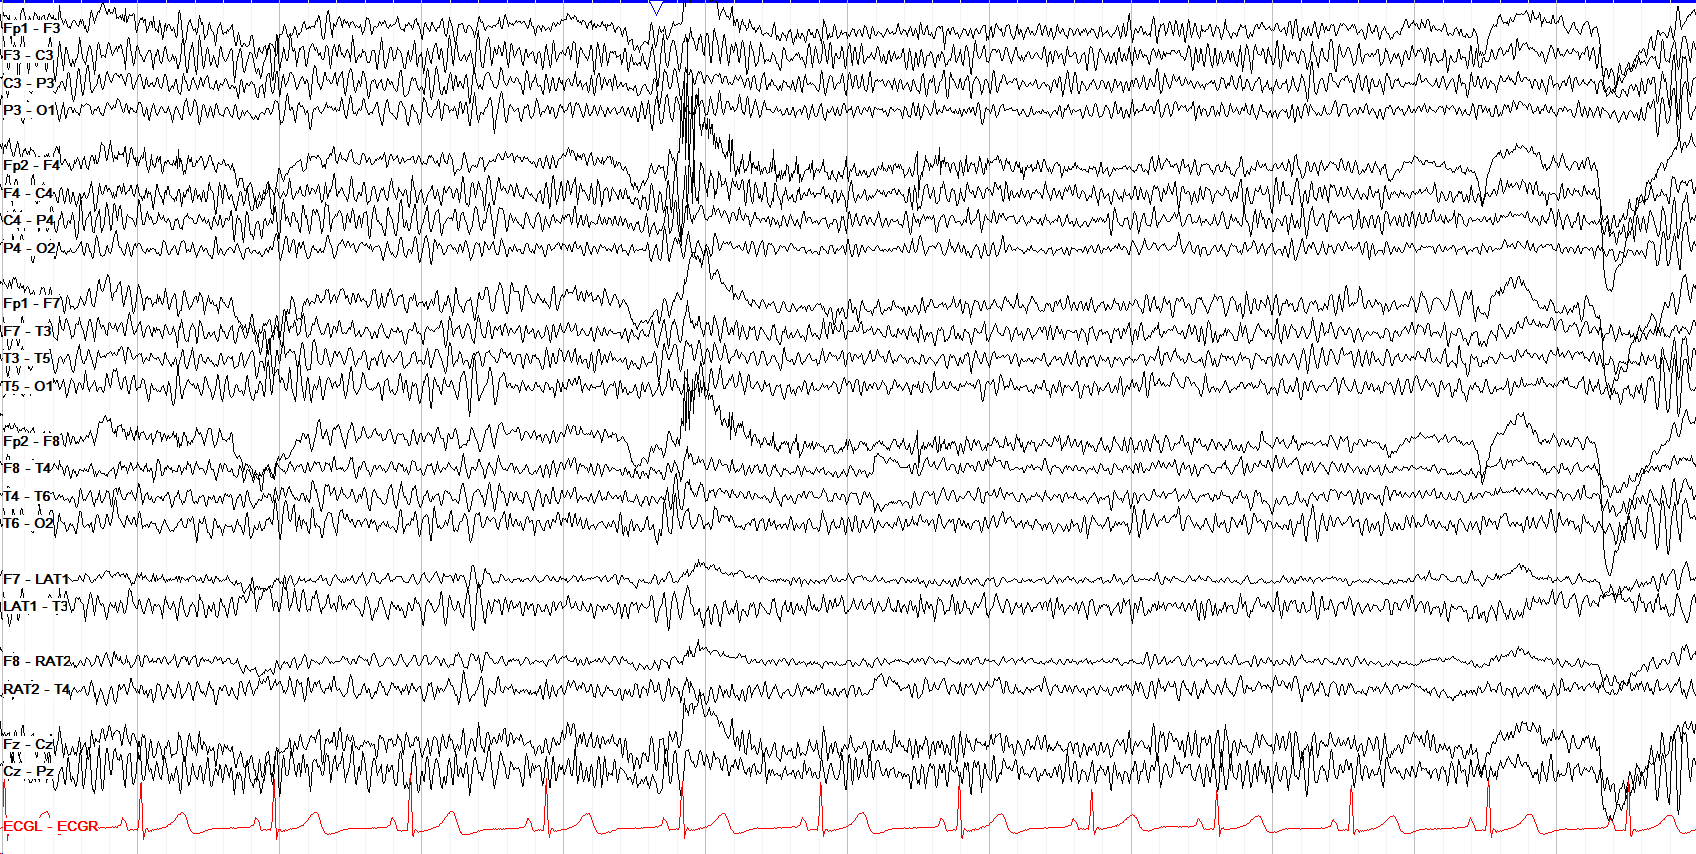
Don't confuse electrode pop for lateral eye movements, which involve the respective contralateral electrode(s). This tracing also has excess background beta activity.
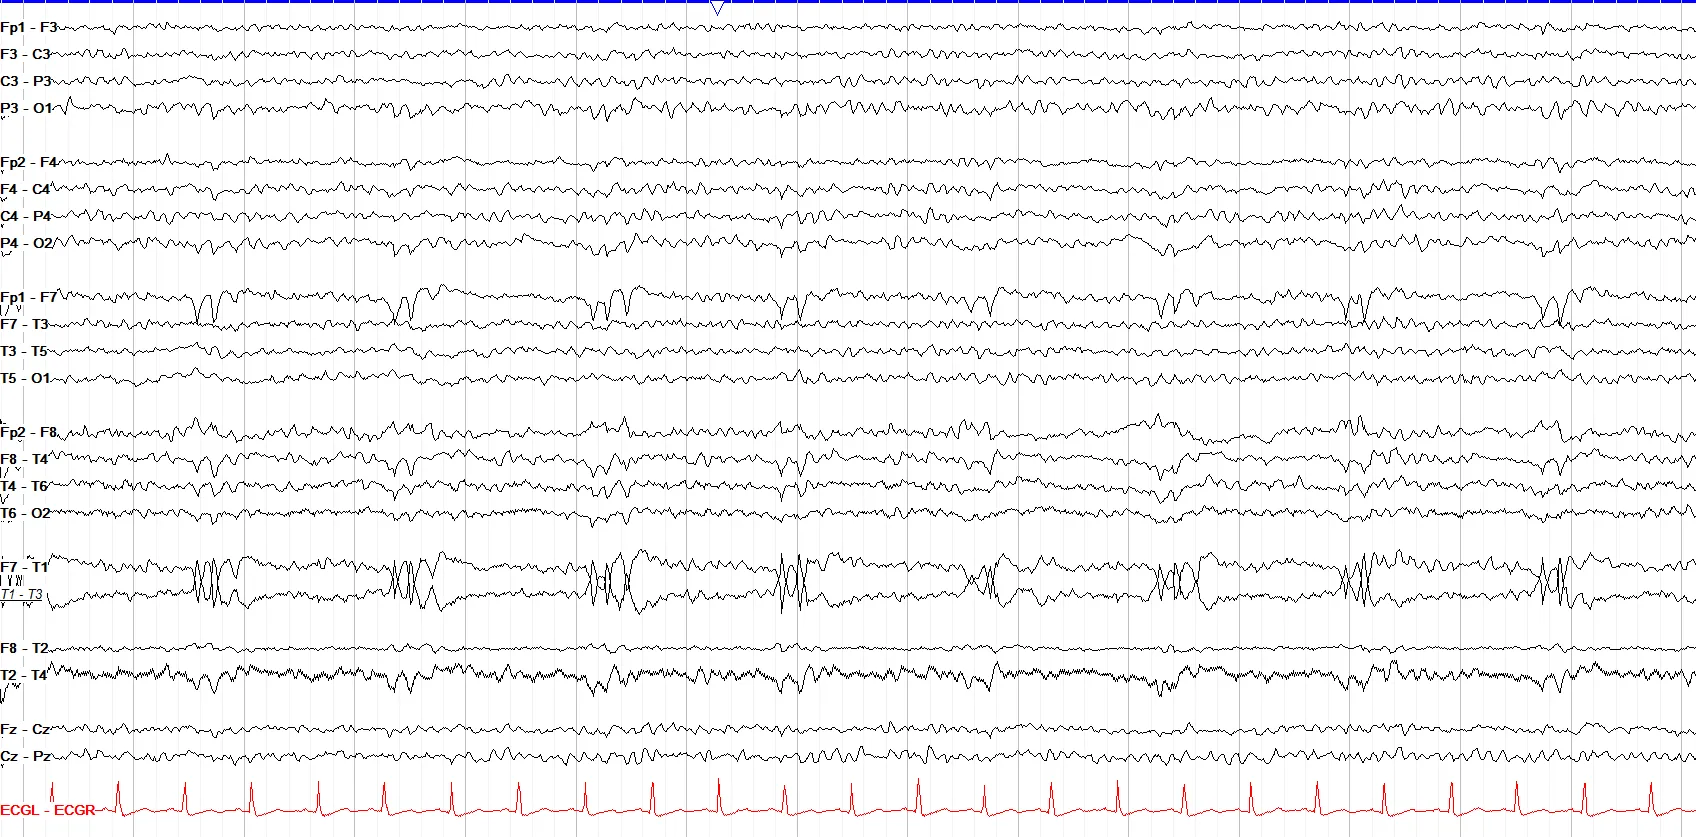
In ICU patients, ventilators can cause a plethora of artifact. Here we see intermittent, periodic bursts of sharp activity, most prominent in the left anterior temporal region that is caused by the motion of the ventilator tubes, along with the condensed water inside them.
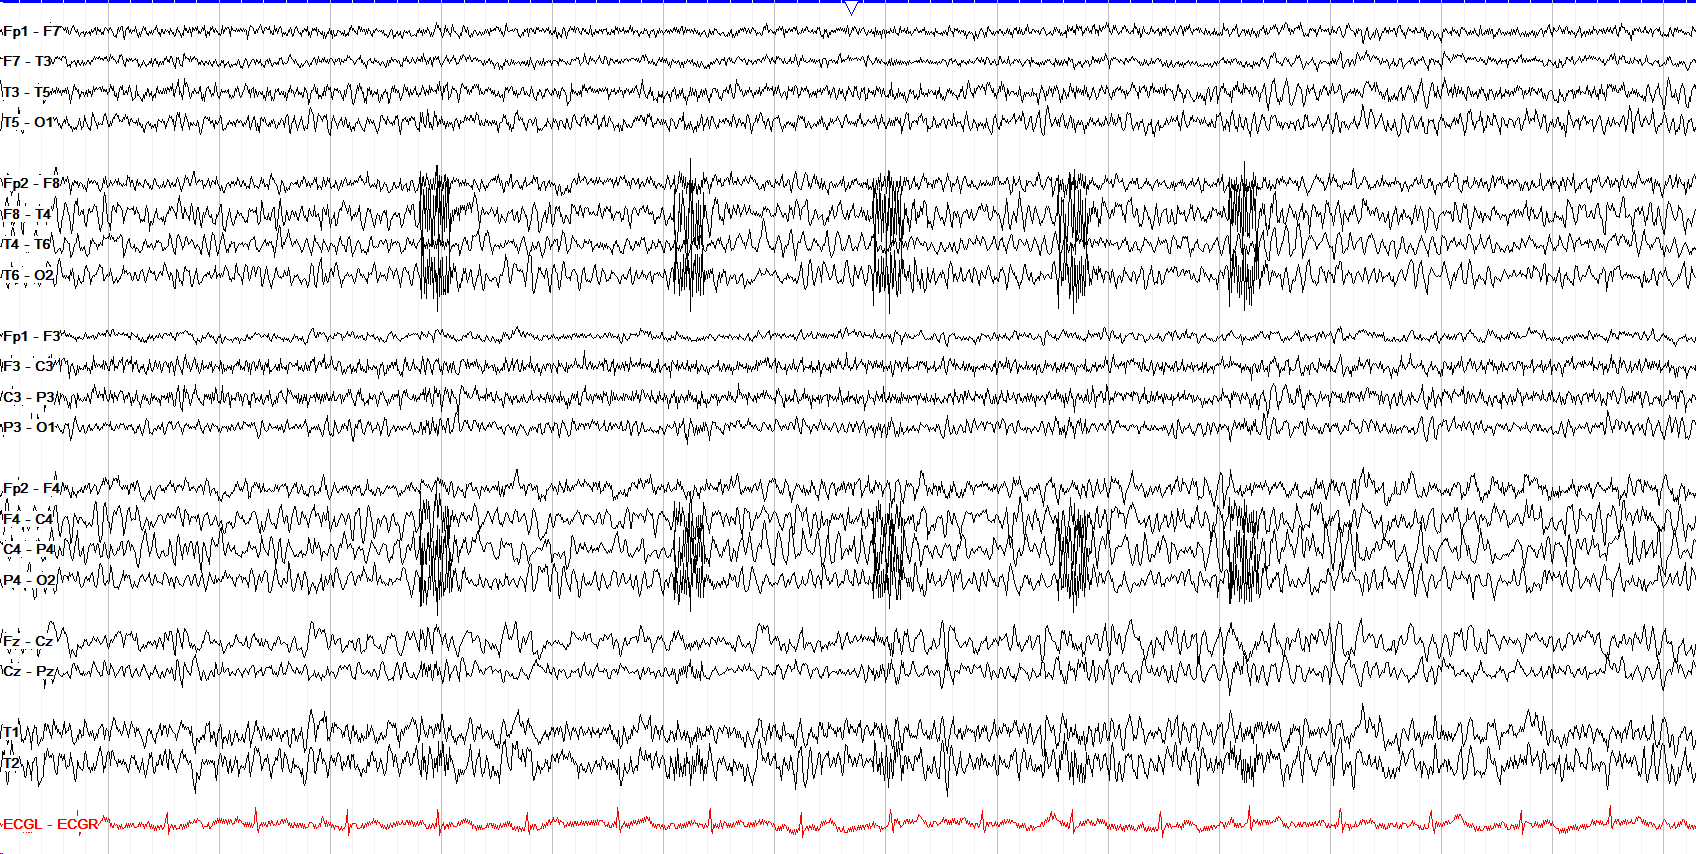
For drug resistant epilepsy, an RNS (responsive neurostimulator) can be implanted at the site of seizure foci if eloquent cortex at that spot precludes surgical resection. RNS stimulation artifact appears as high amplitude, very fast bursts over the region implanted.
cardiac
2 patterns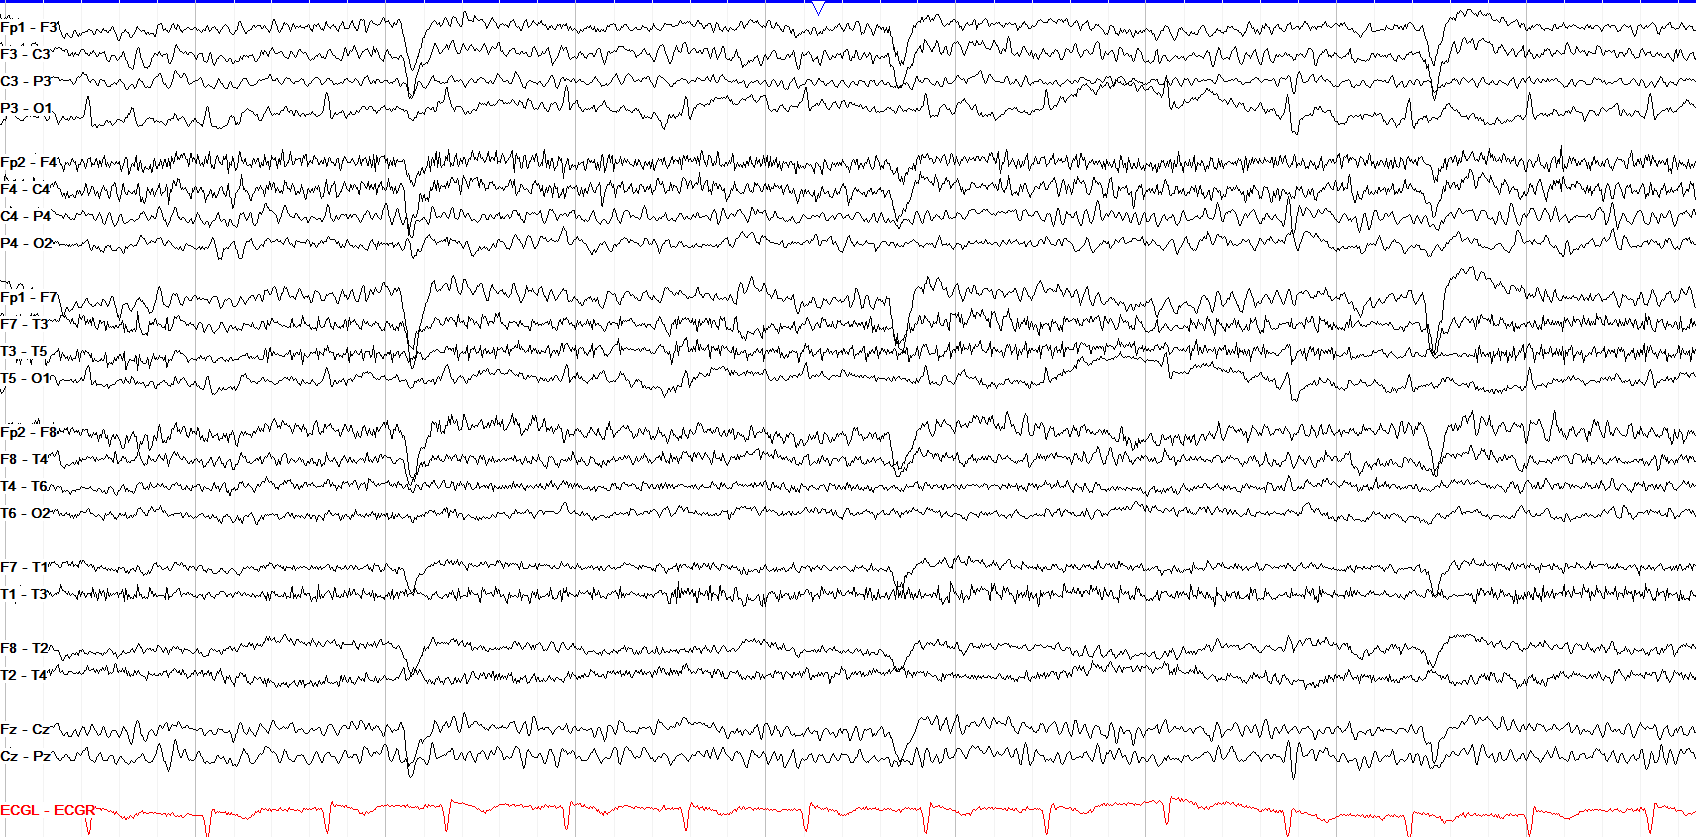
ECG artifact appears as spike-like activity that is time locked to the QRS complex on the ECG tracing, and is more prominent on the left side because the heart is on the left.
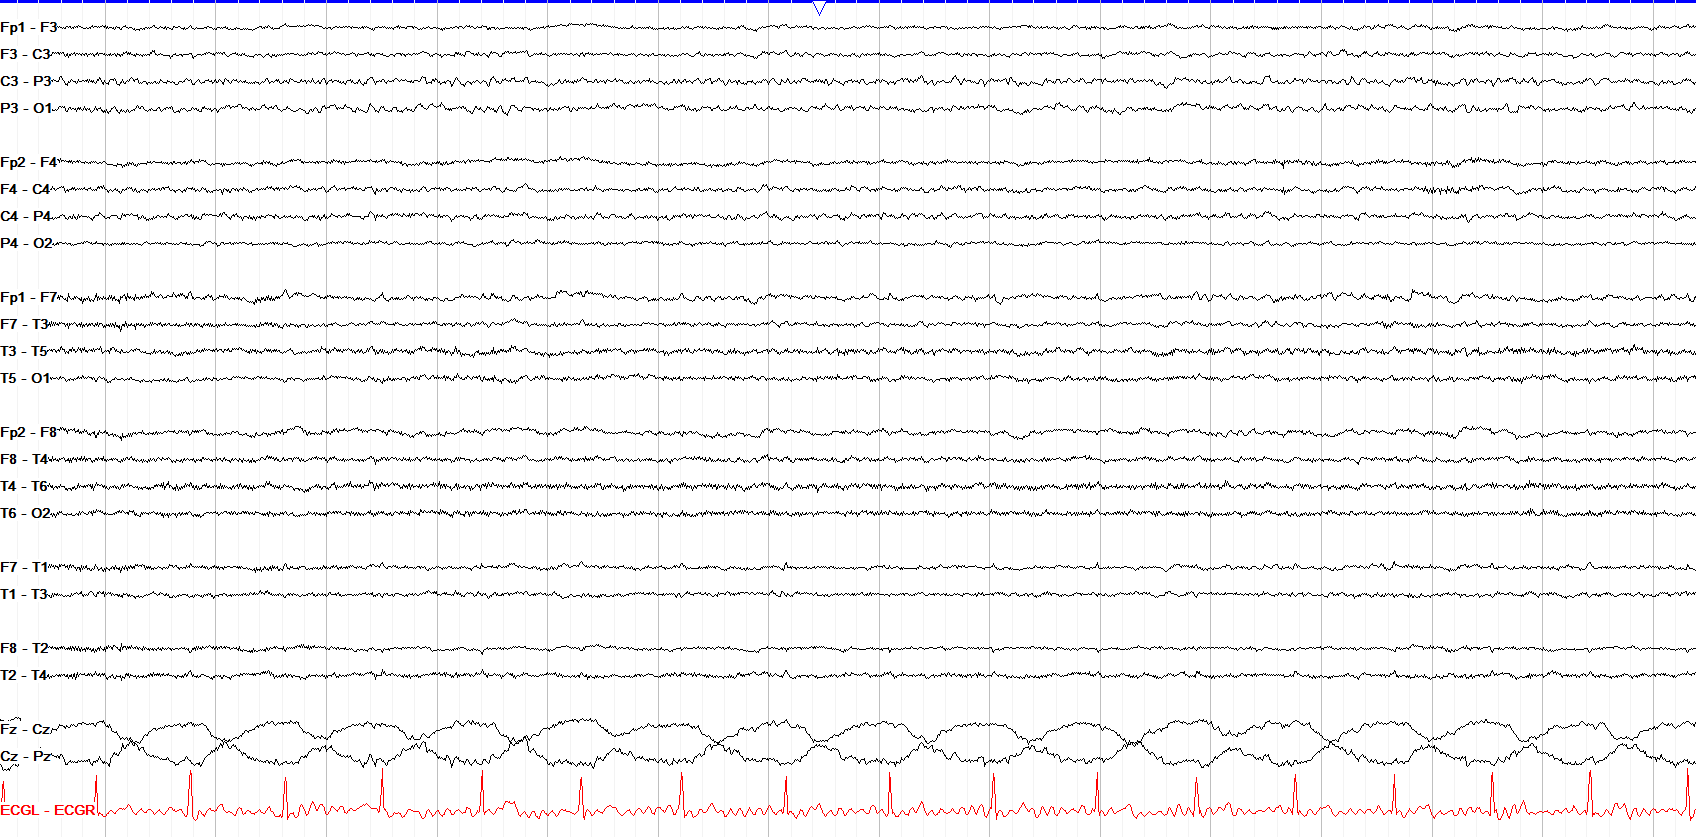
Cardioballistic artifact is also time locked to the QRS complex. It comes from the pulse pressure of an artery or arteriole close to an electrode, which picks up the pulse.
mu rhythm
3 patterns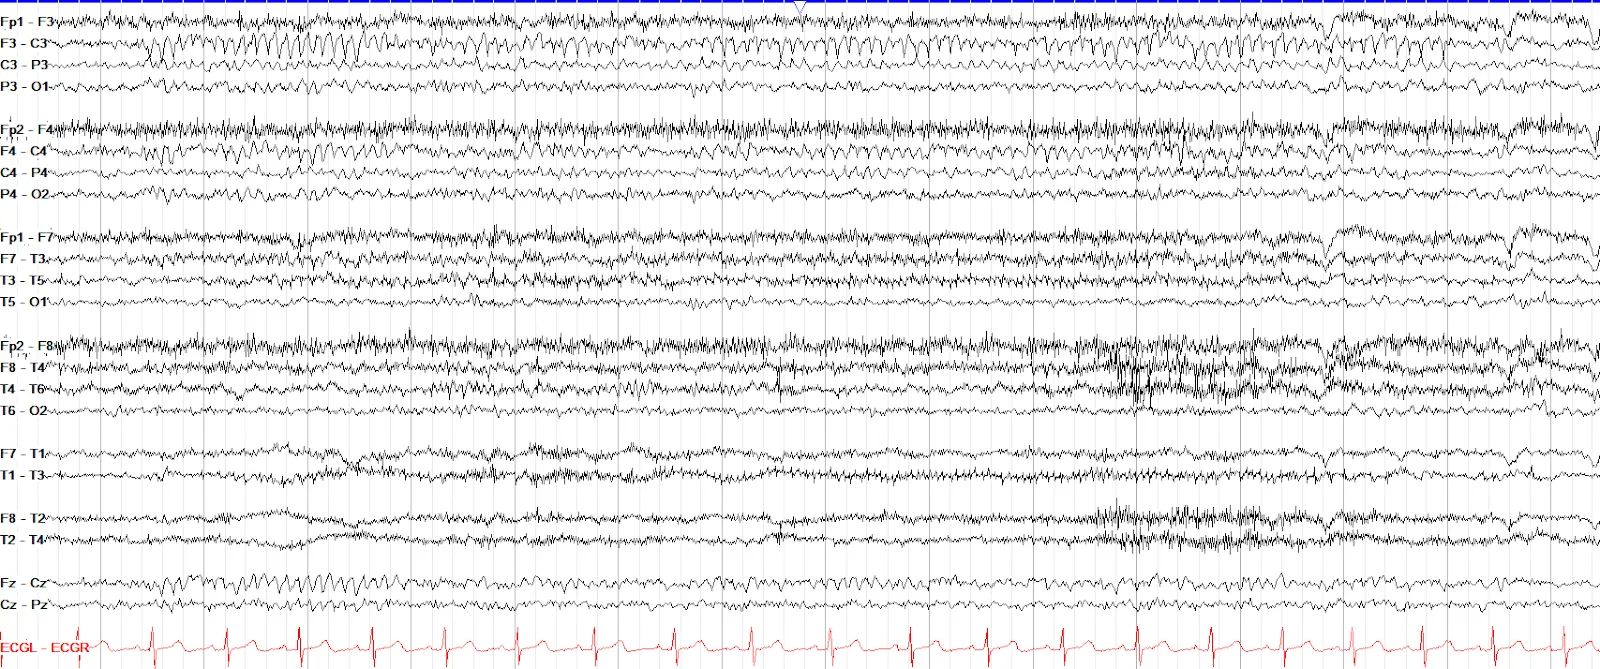
Mu rhythm is the resting activity of the sensorimotor cortex. It appears as arch-like, sharply contoured alpha activity in the bilateral or unilateral parasagittal regions, maximal over the centroparietal leads.
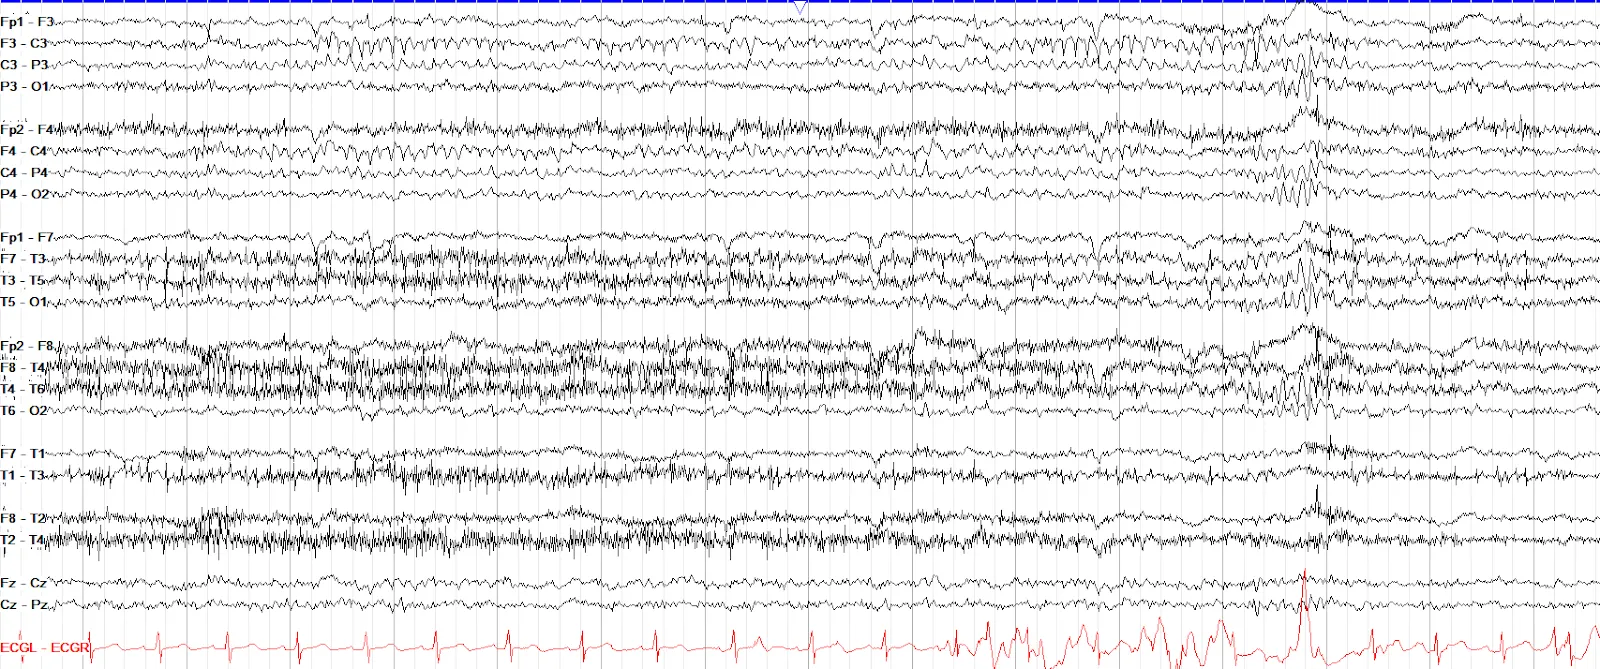
Mu will recede with thoughts of movement or actual movement, and can be unilateral, bilateral or a blend of both.
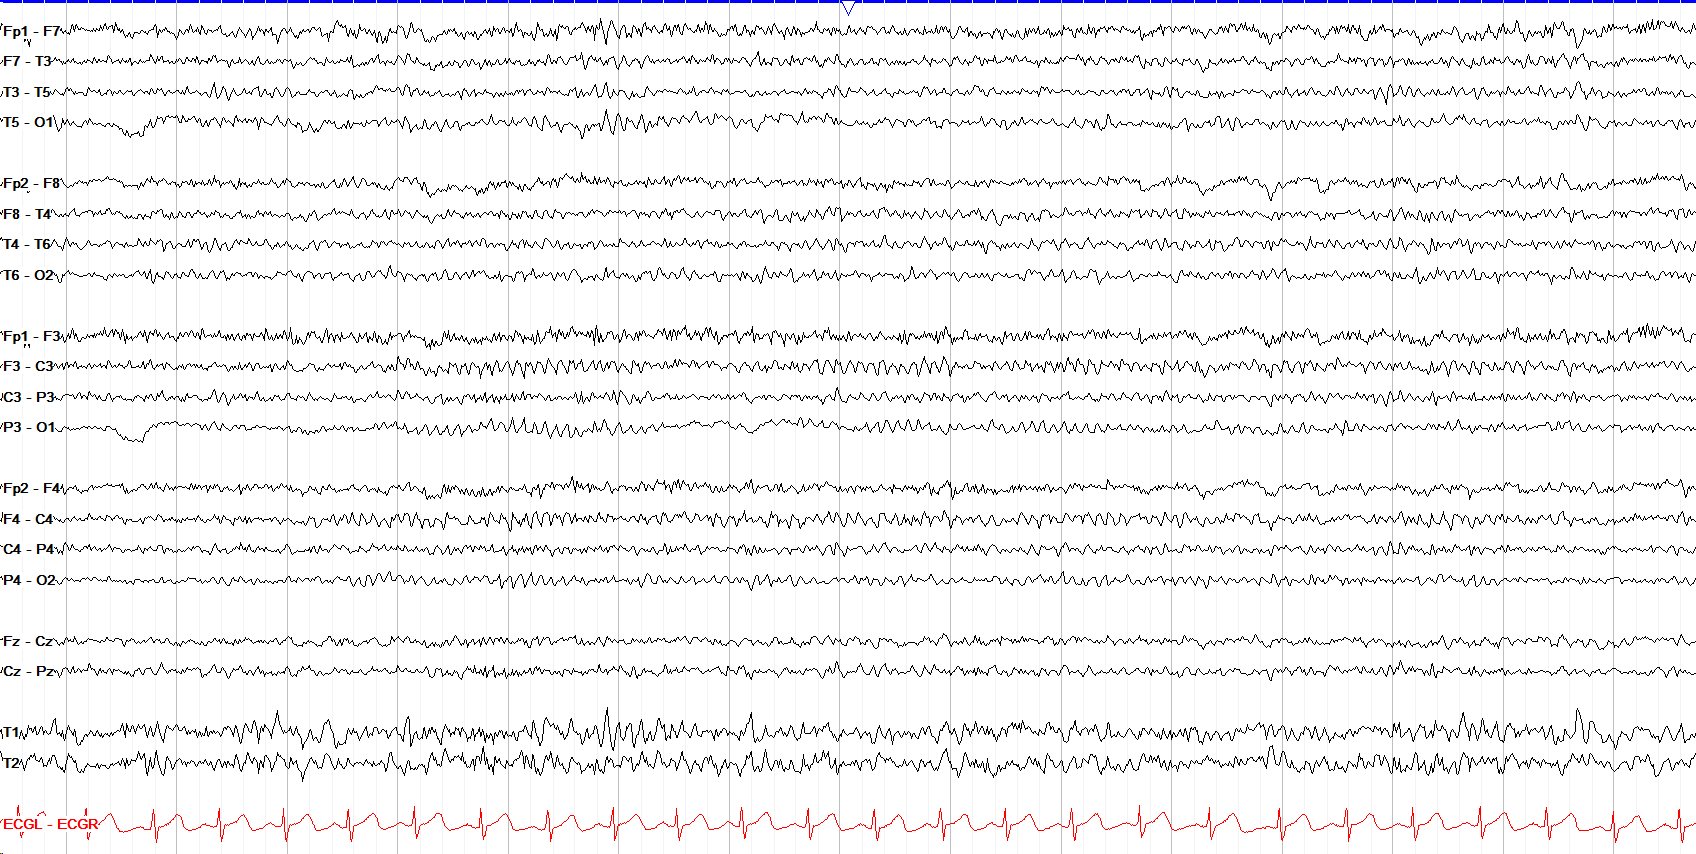
Don’t mistake mu for wickets, even though both have an arciform morphology. Mu is over the parasagittal chains, while wickets are a temporal phenomenon and typically come in shorter intervals.
wicket waves
4 patterns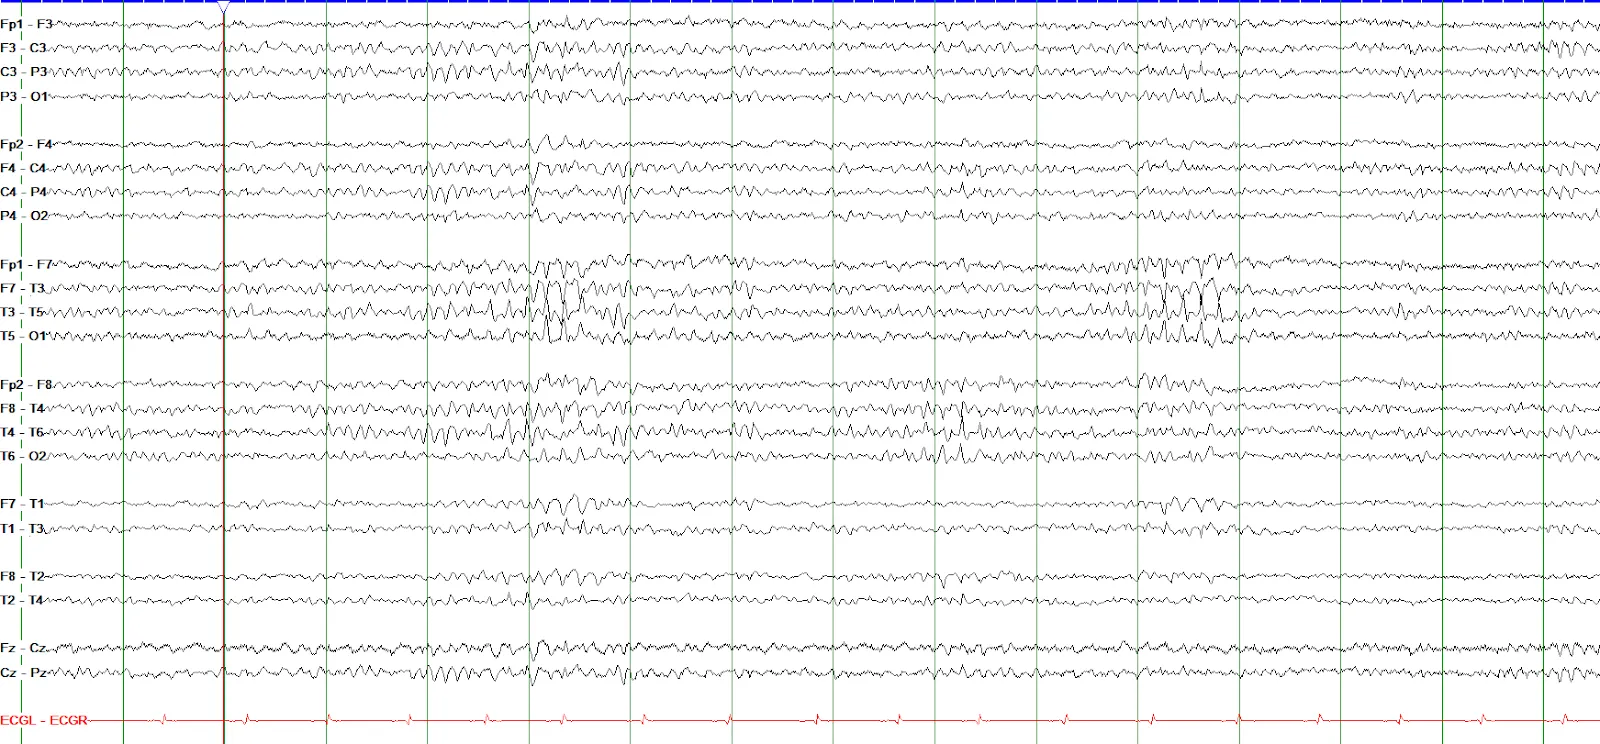
Wicket waves are sharp, temporal alpha frequency waves that can be rhythmic in appearance and are named for their arch shape, like a croquet wicket (a hoop in the ground). Each wicket should be the same duration.
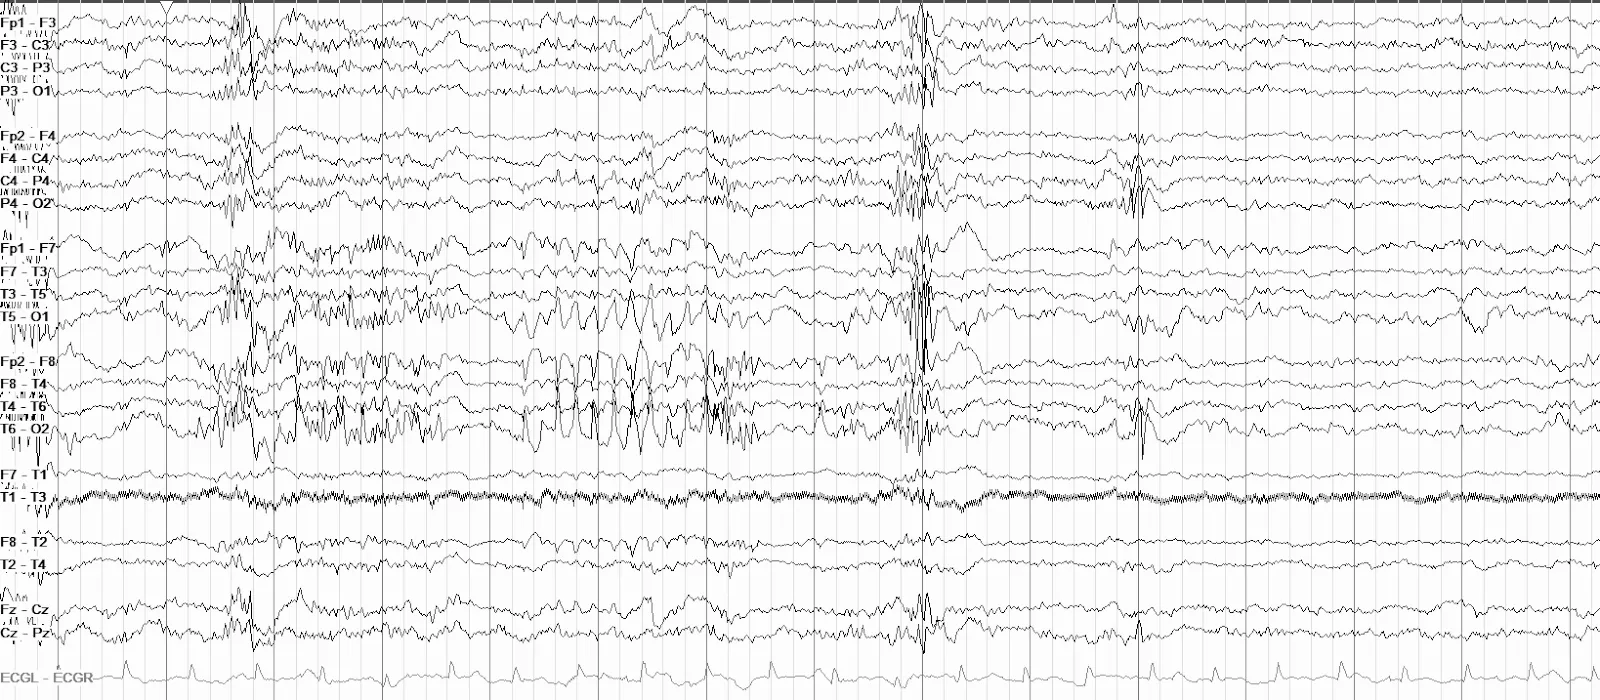
Wickets are a normal finding and can be symmetric or unilateral, and more commonly seen in drowsy states. Note that wickets are temporal, and mu (which can look similar) is more central.
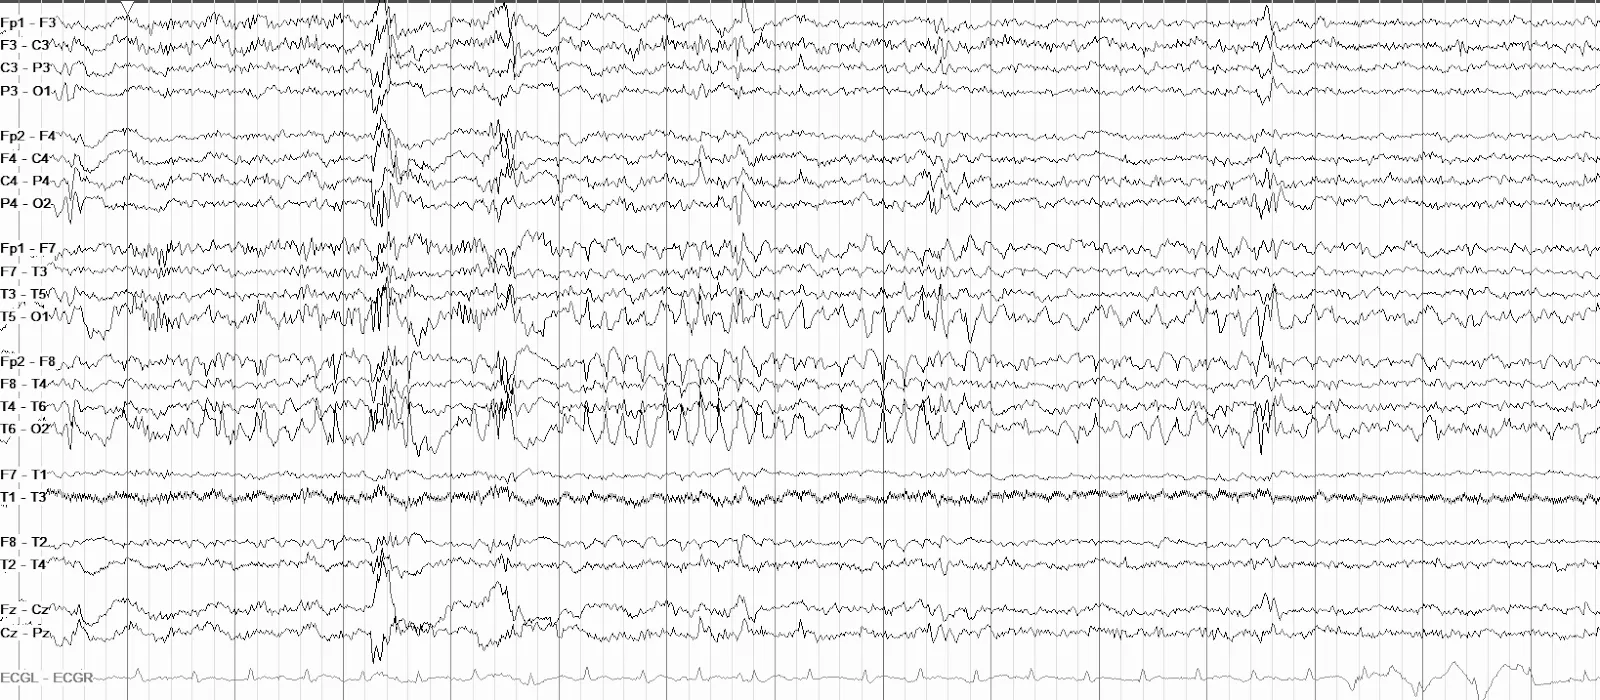
Wickets can look similar to epileptiform activity, but wickets tend to come in non-evolving runs and do not have the aftergoing slow wave that epileptiform discharges often do.
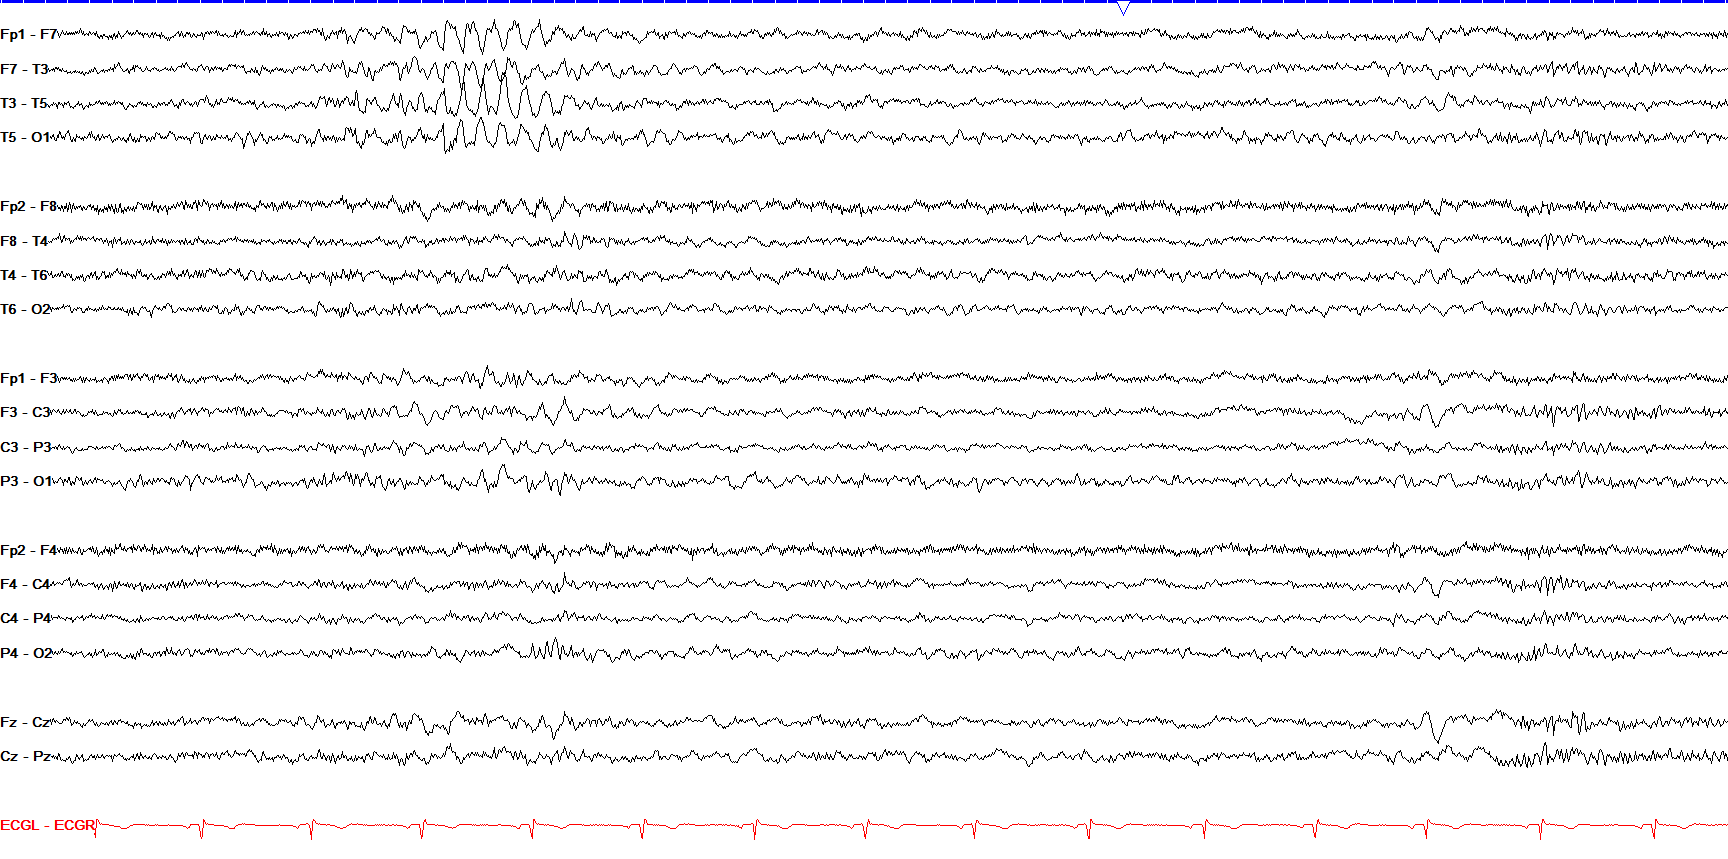
Wickets typically show classic mid-temporal predominance, sharp contours with a symmetric up and down slope, and come in very brief non-evolving runs in drowsiness.
lambda waves
3 patterns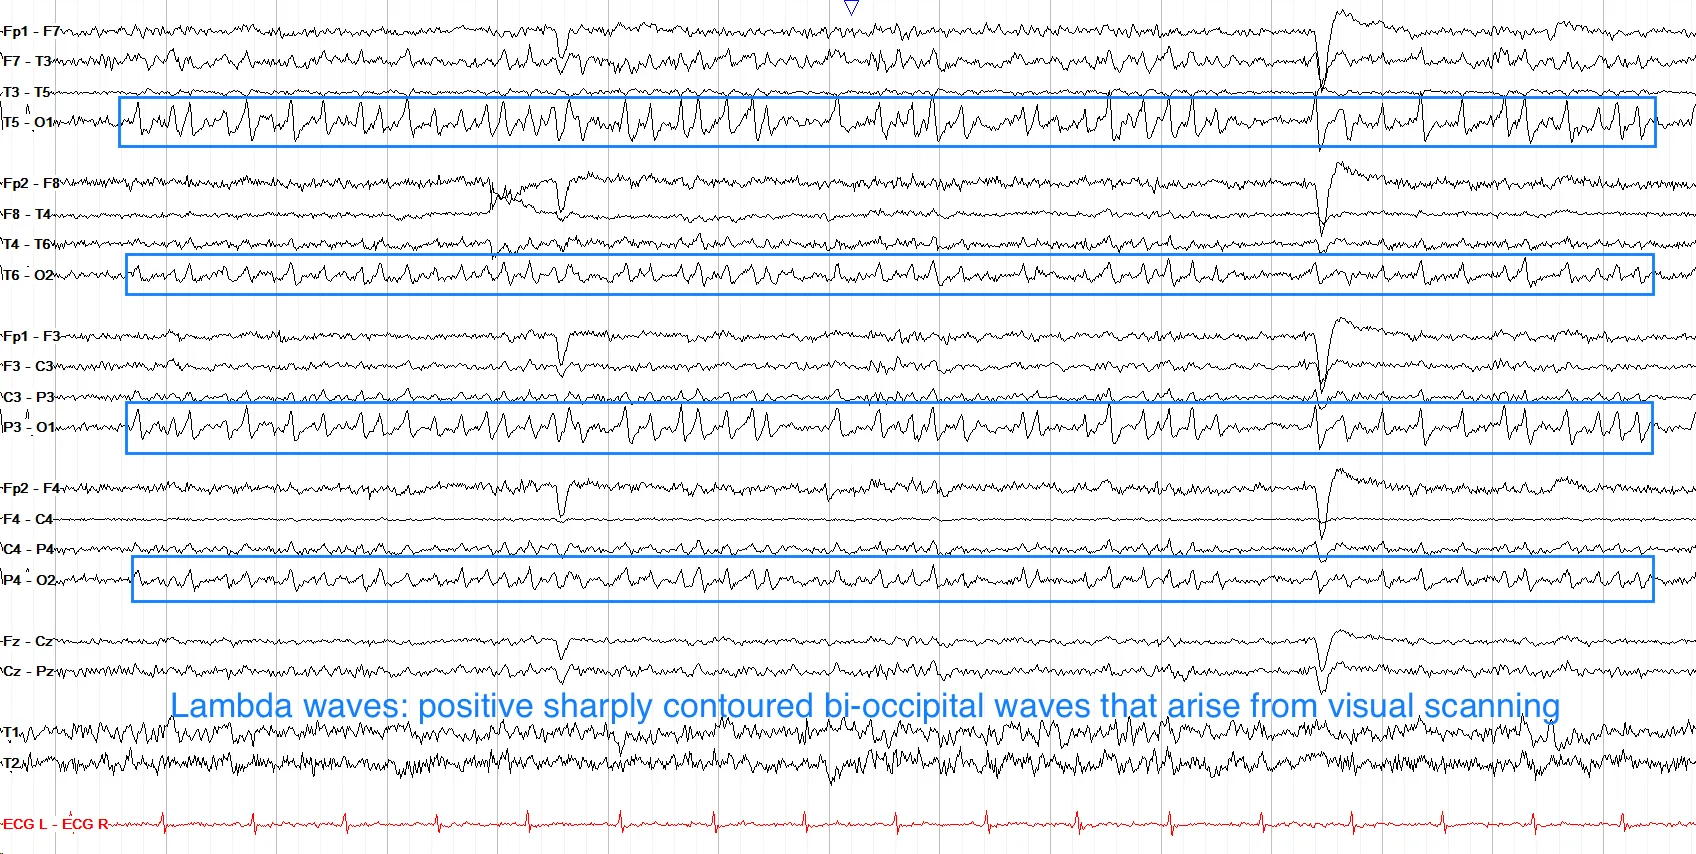
Lambda waves are bilateral, symmetric, positive sharp transients over the occipital regions. They occur during visual scanning and disappear with eyes closed.
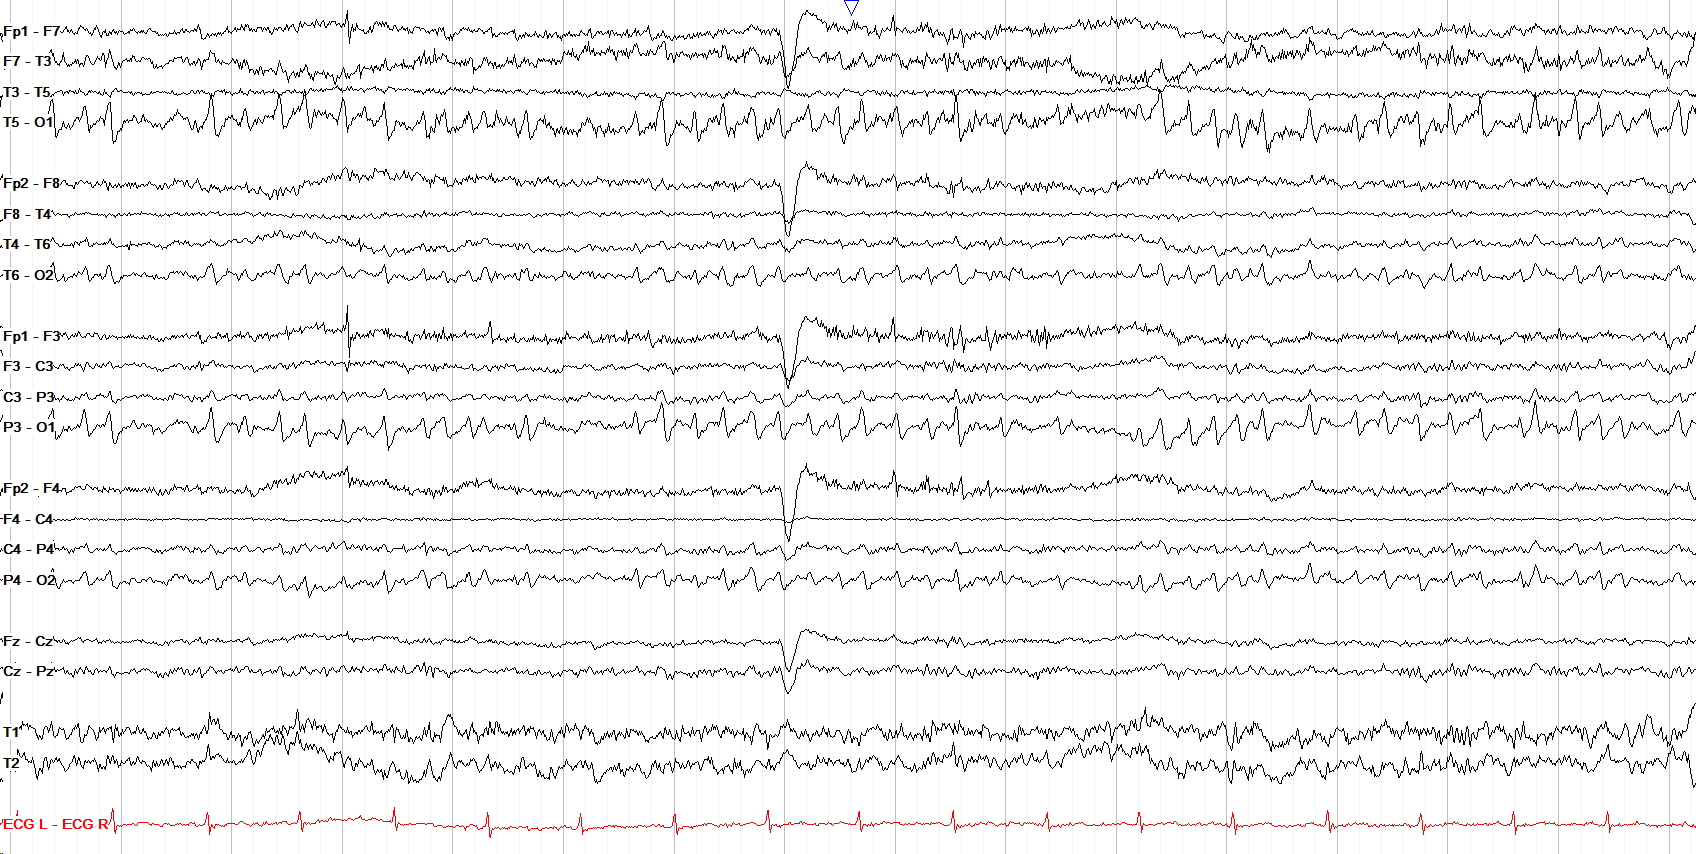
Lambda waves look almost identical to POSTS (a hallmark of stage I sleep), but lambdas come with other evidence of wakefulness such as eye blinks.
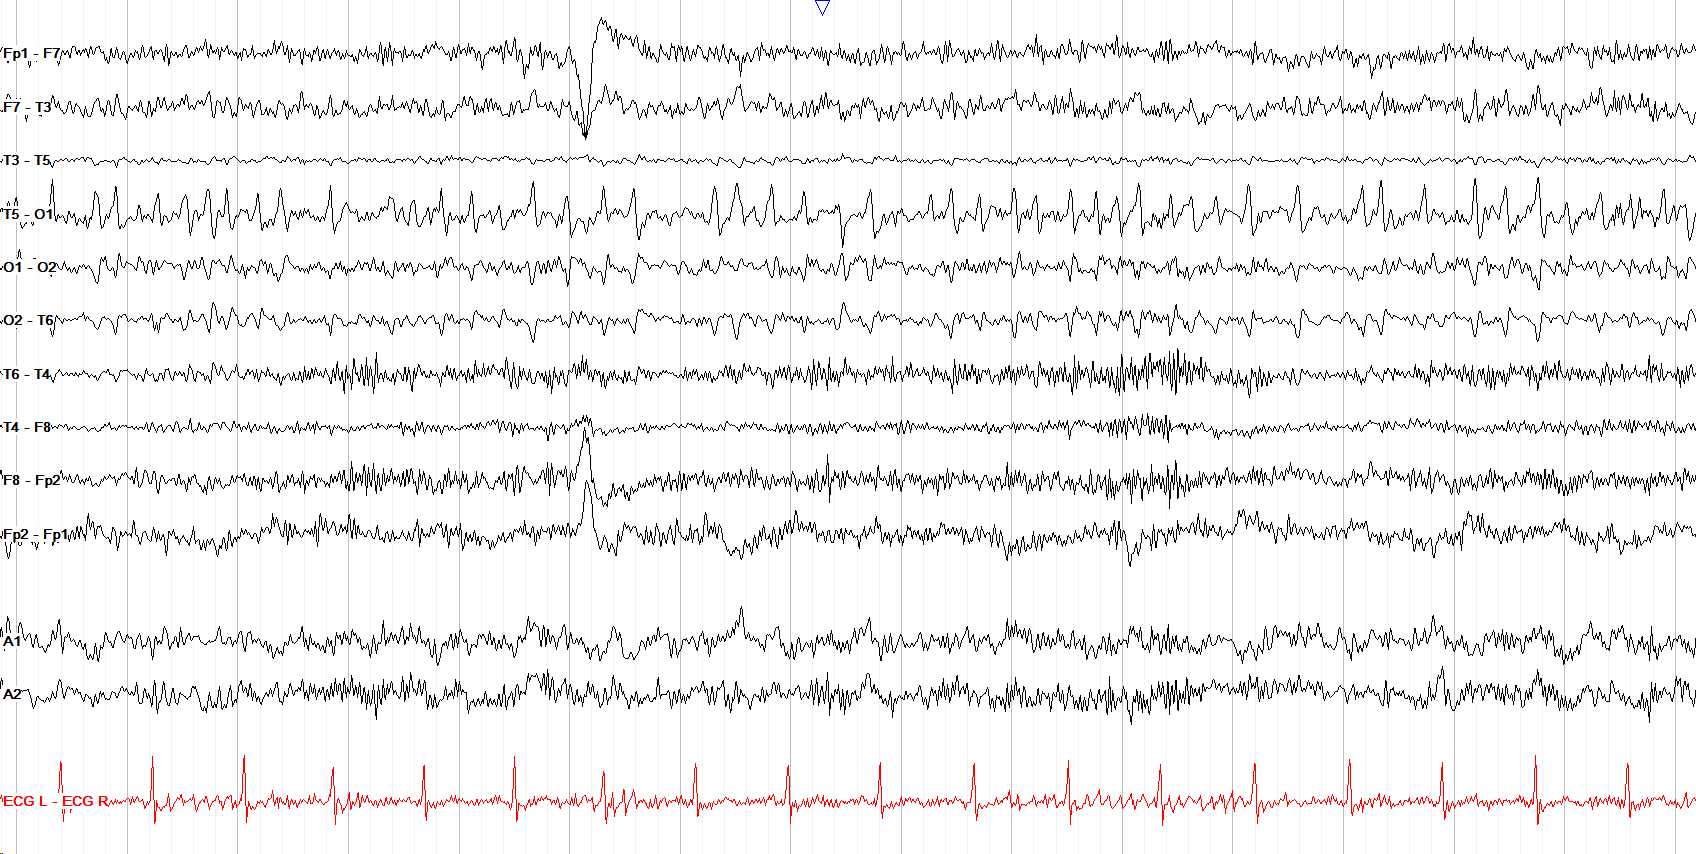
Here we see lambda waves in a circumferential montage, driving home the point that they are very occipitally focused.
RMTD
2 patterns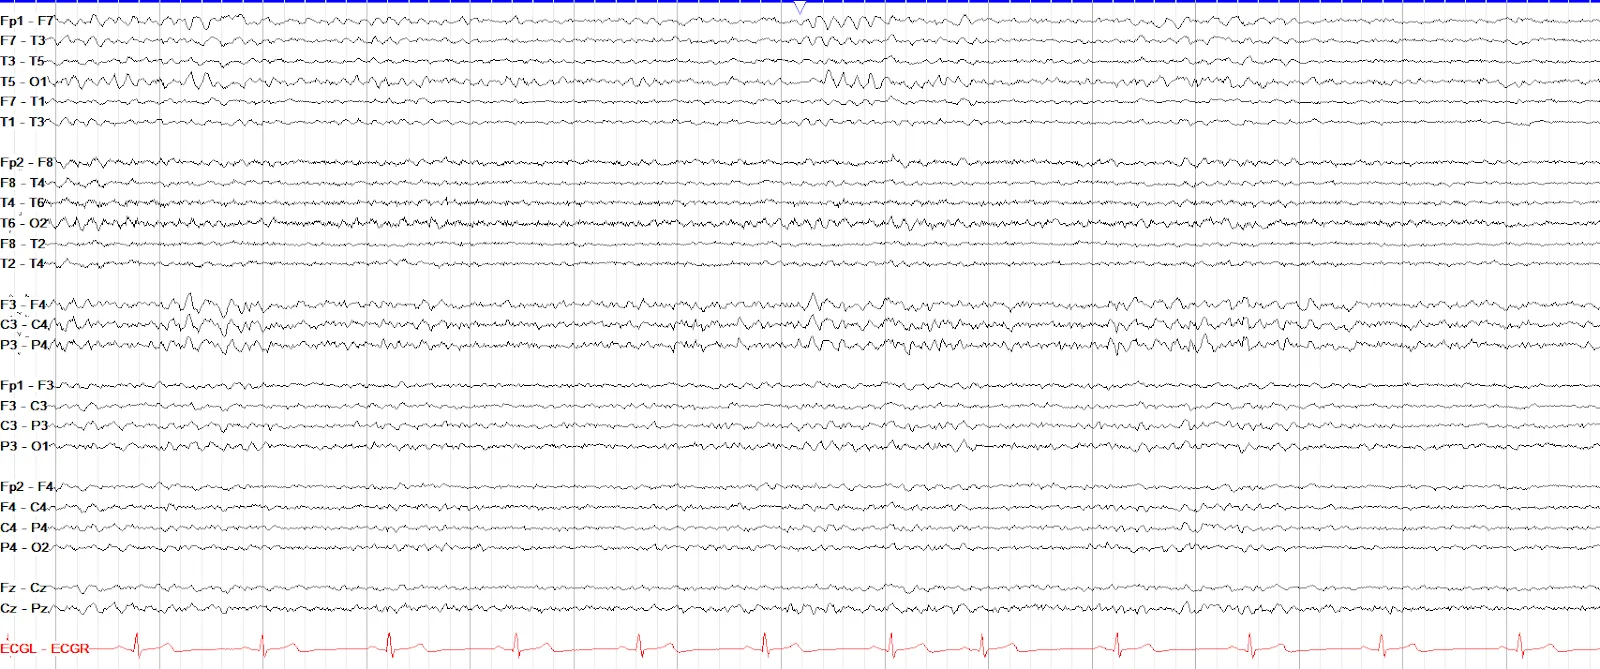
Rhythmic mid-temporal theta of drowsiness (RMTD) is a self-descriptive and normal finding in drowsiness.
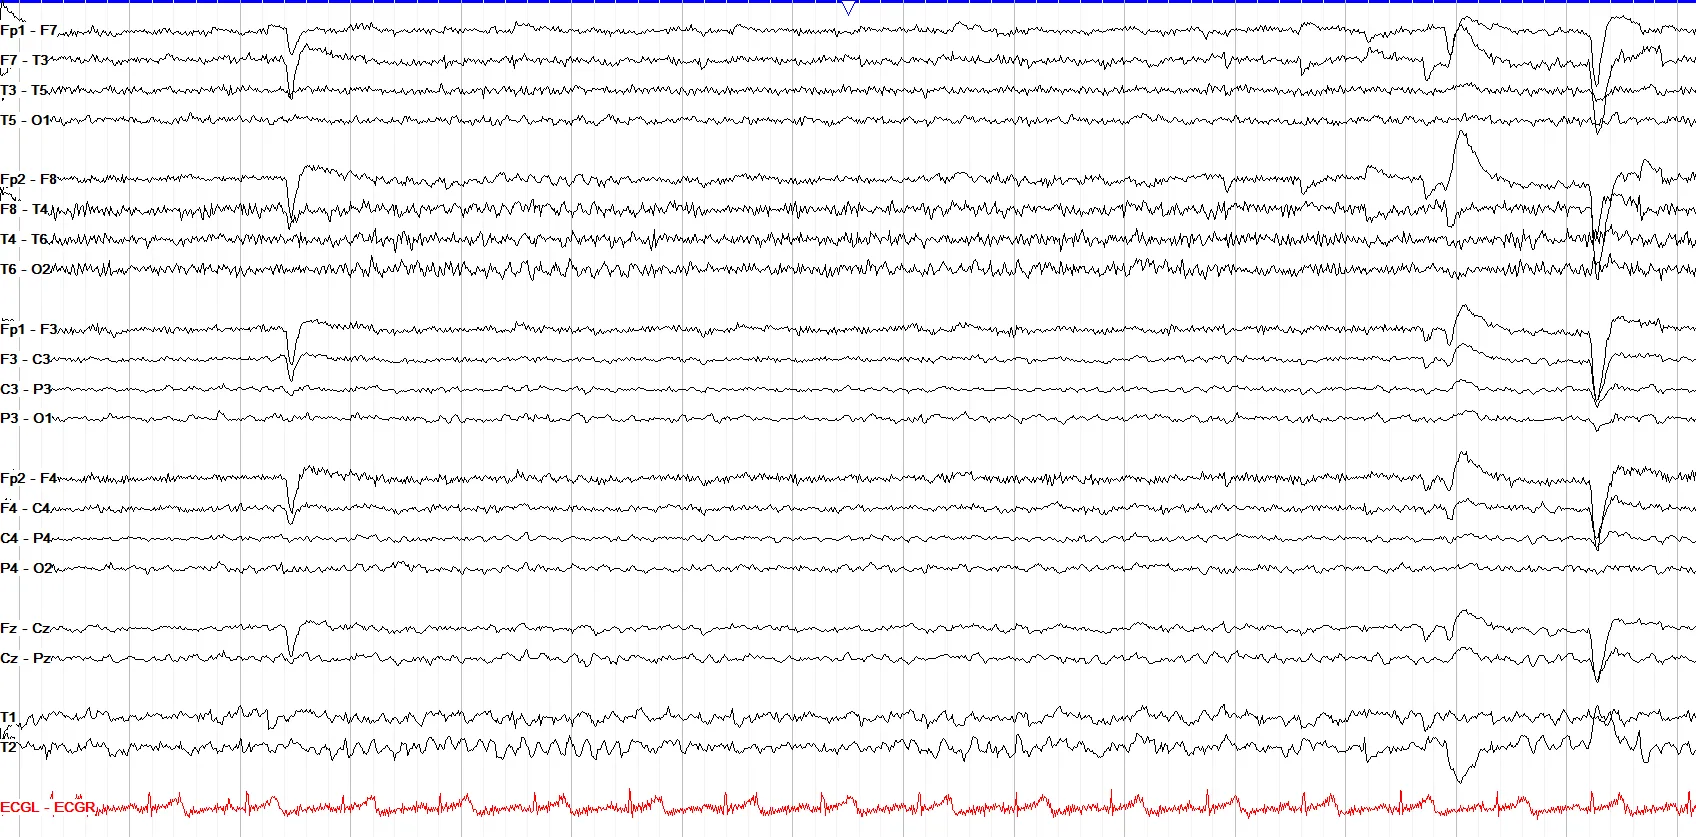
RMTD is common in the mid-temporal region, usually lasts less than 10 seconds, and lacks the evolution or spike-wave morphology that epileptiform activity typically shows.
BETS
2 patterns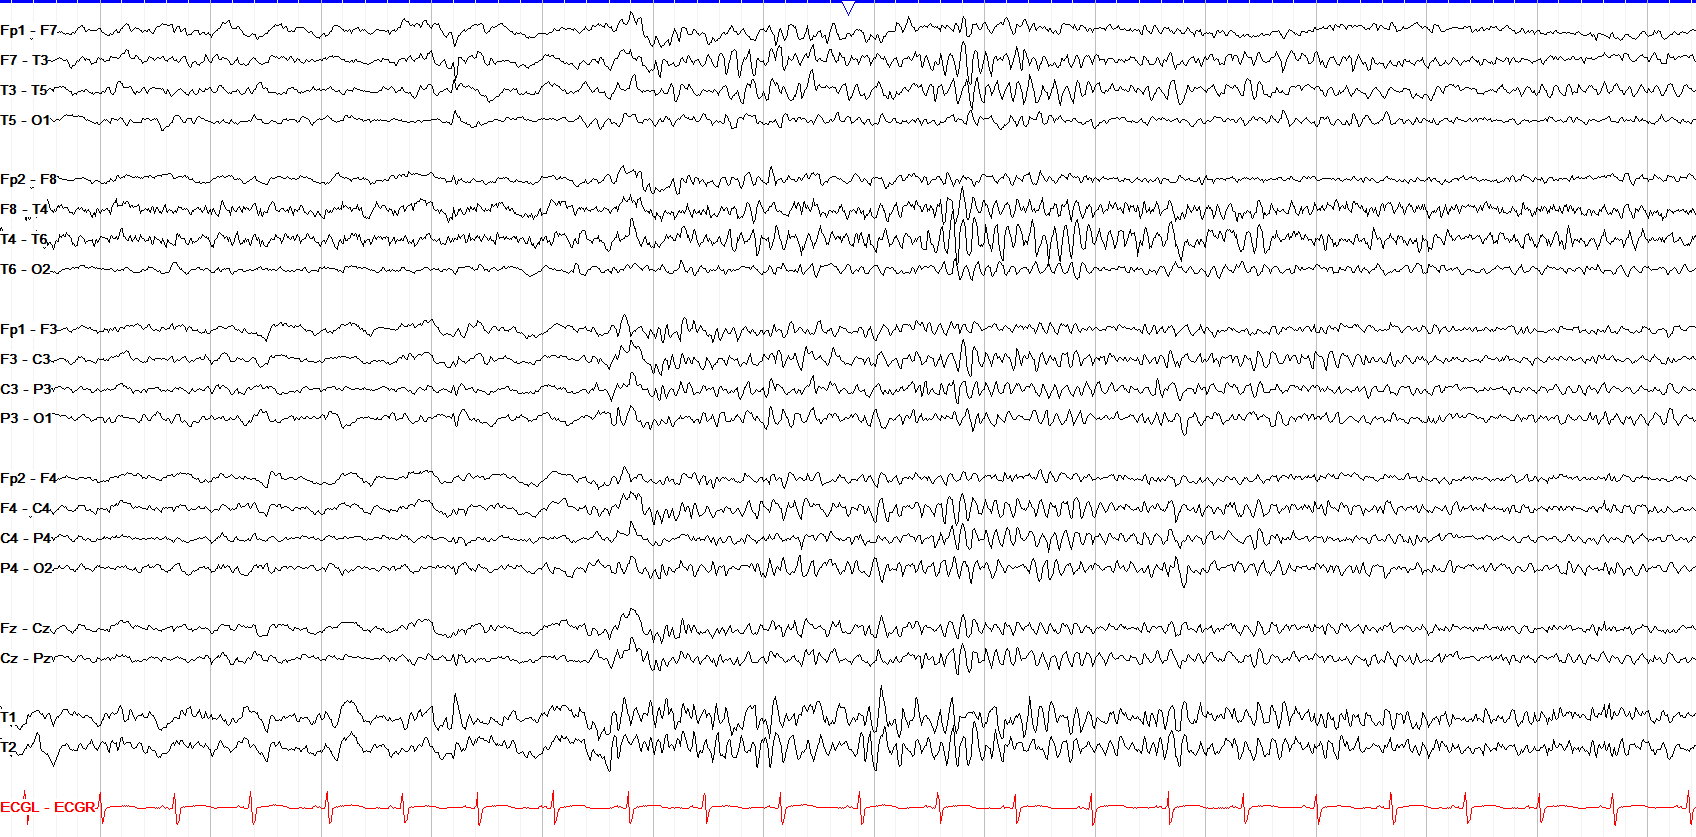
Benign epileptiform transients of sleep (BETS), or small sharp spikes (SSS) are low amplitude, brief sharp transients of drowsiness and light sleep.
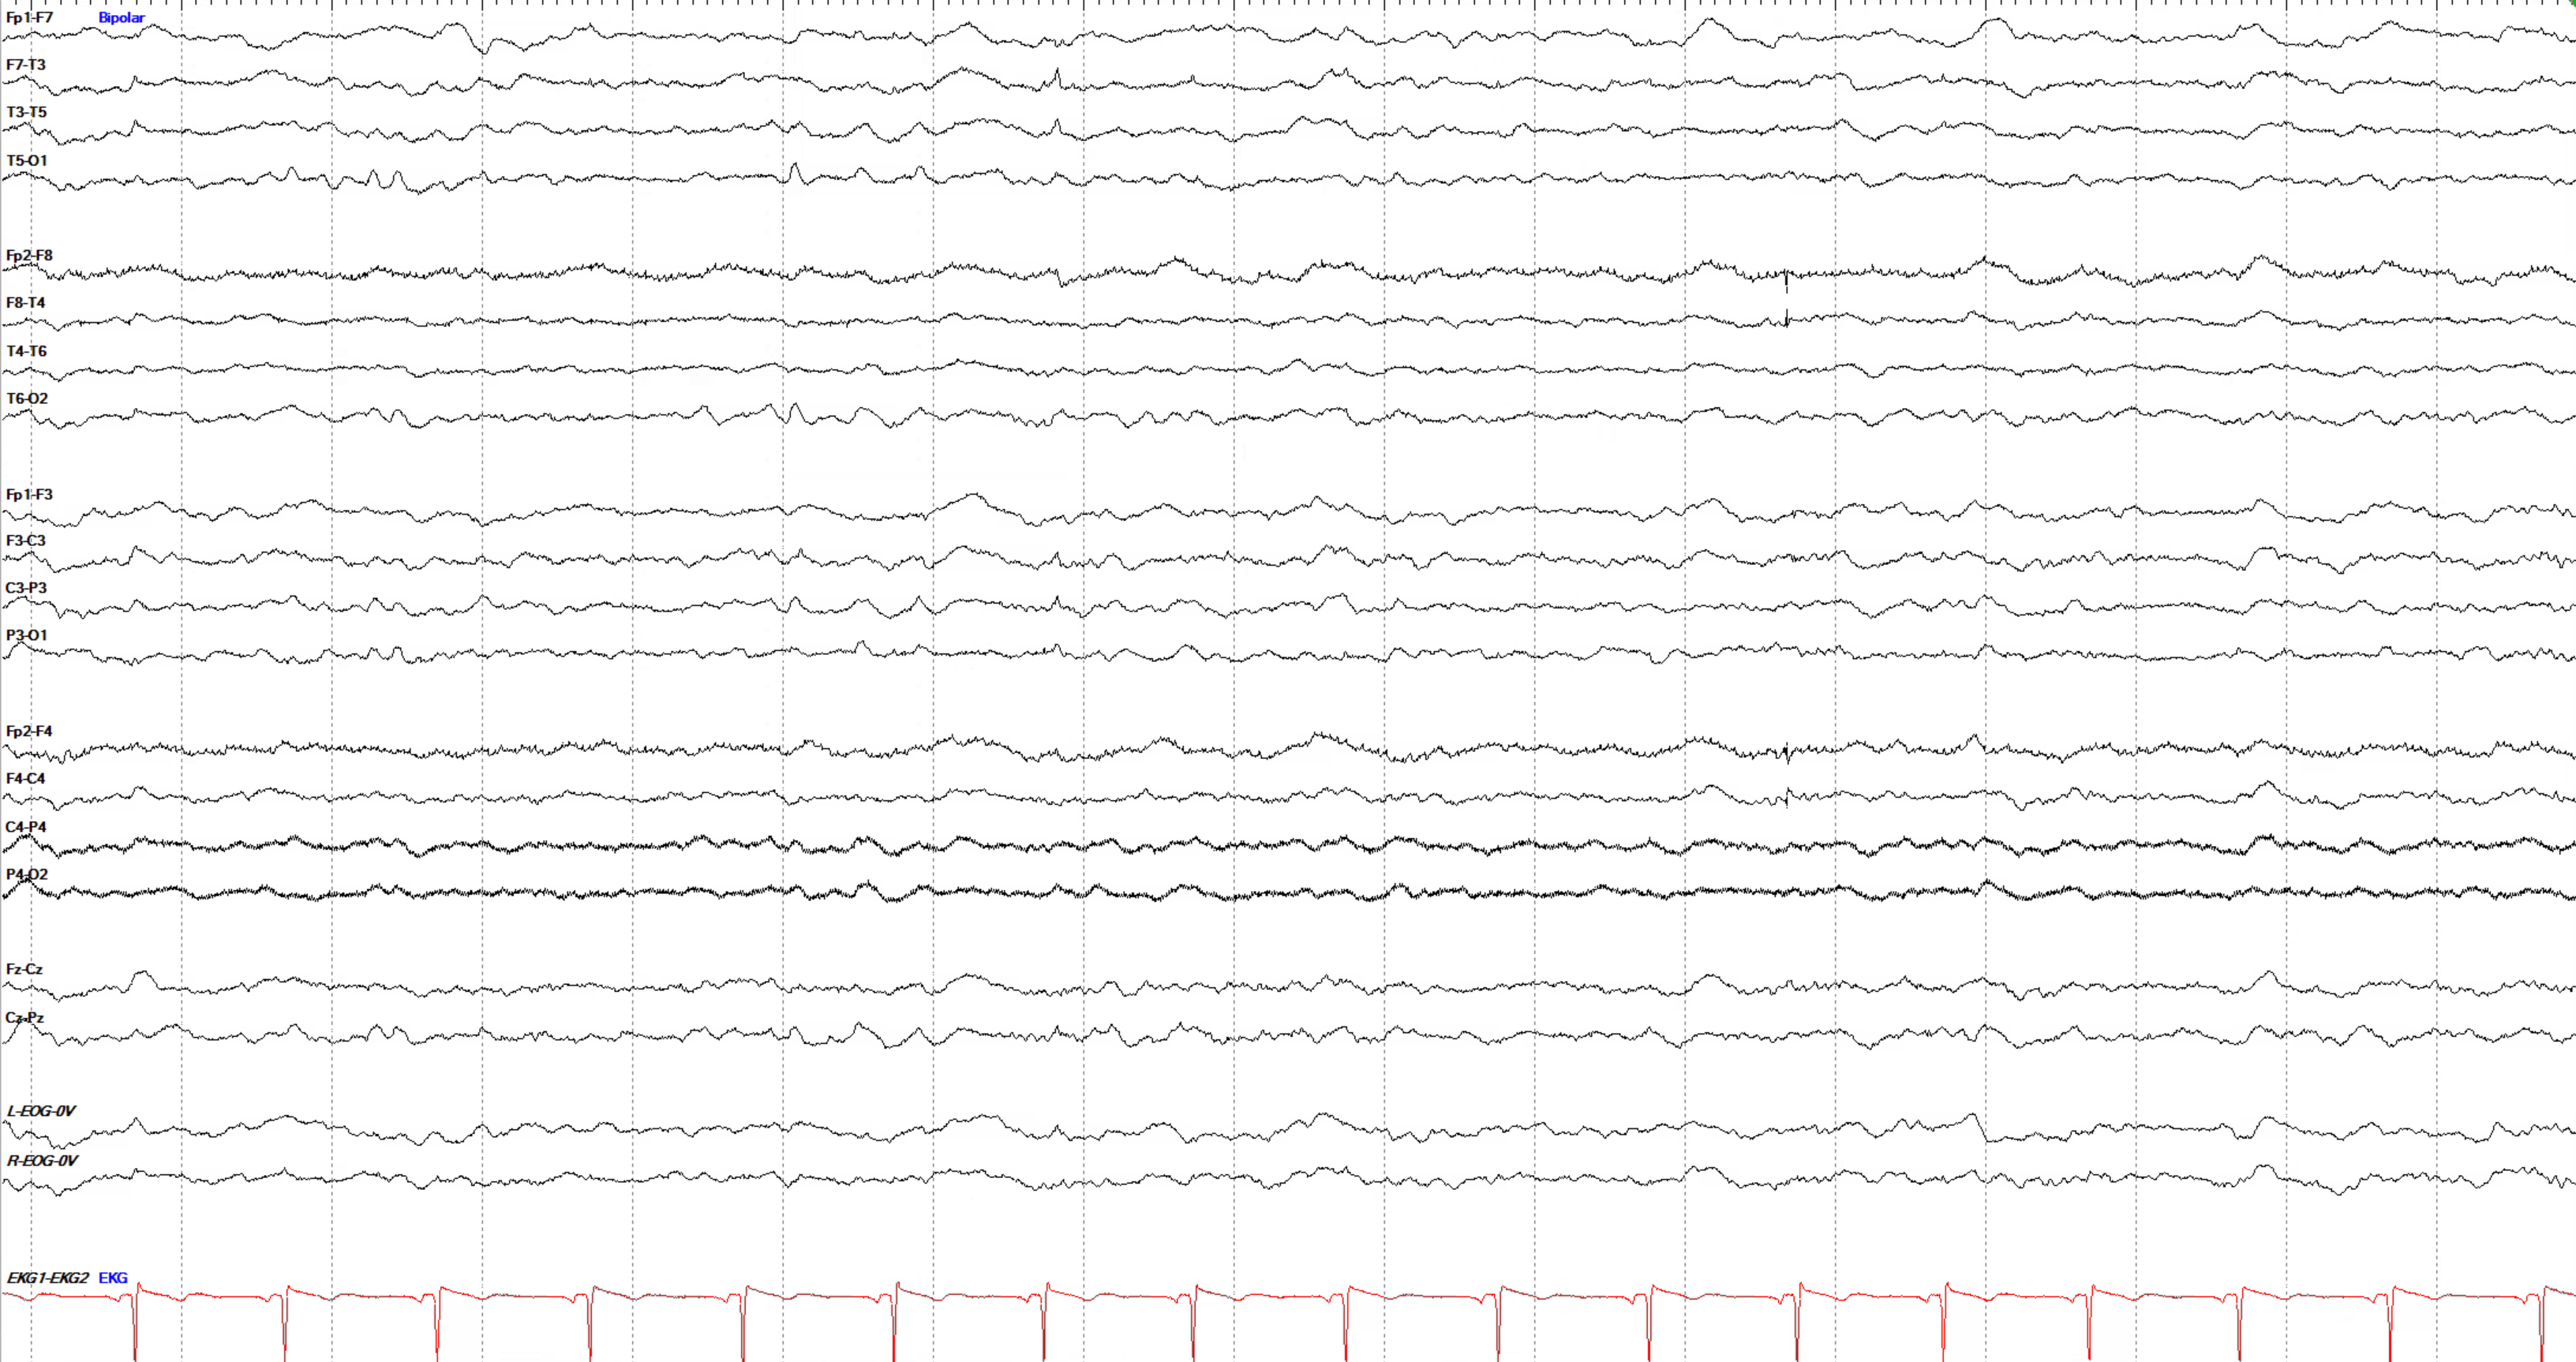
BETs are low amplitude with a biphasic morphology and no after-going slow wave, unlike true epileptiform discharges.
14 & 6 positive spikes
2 patterns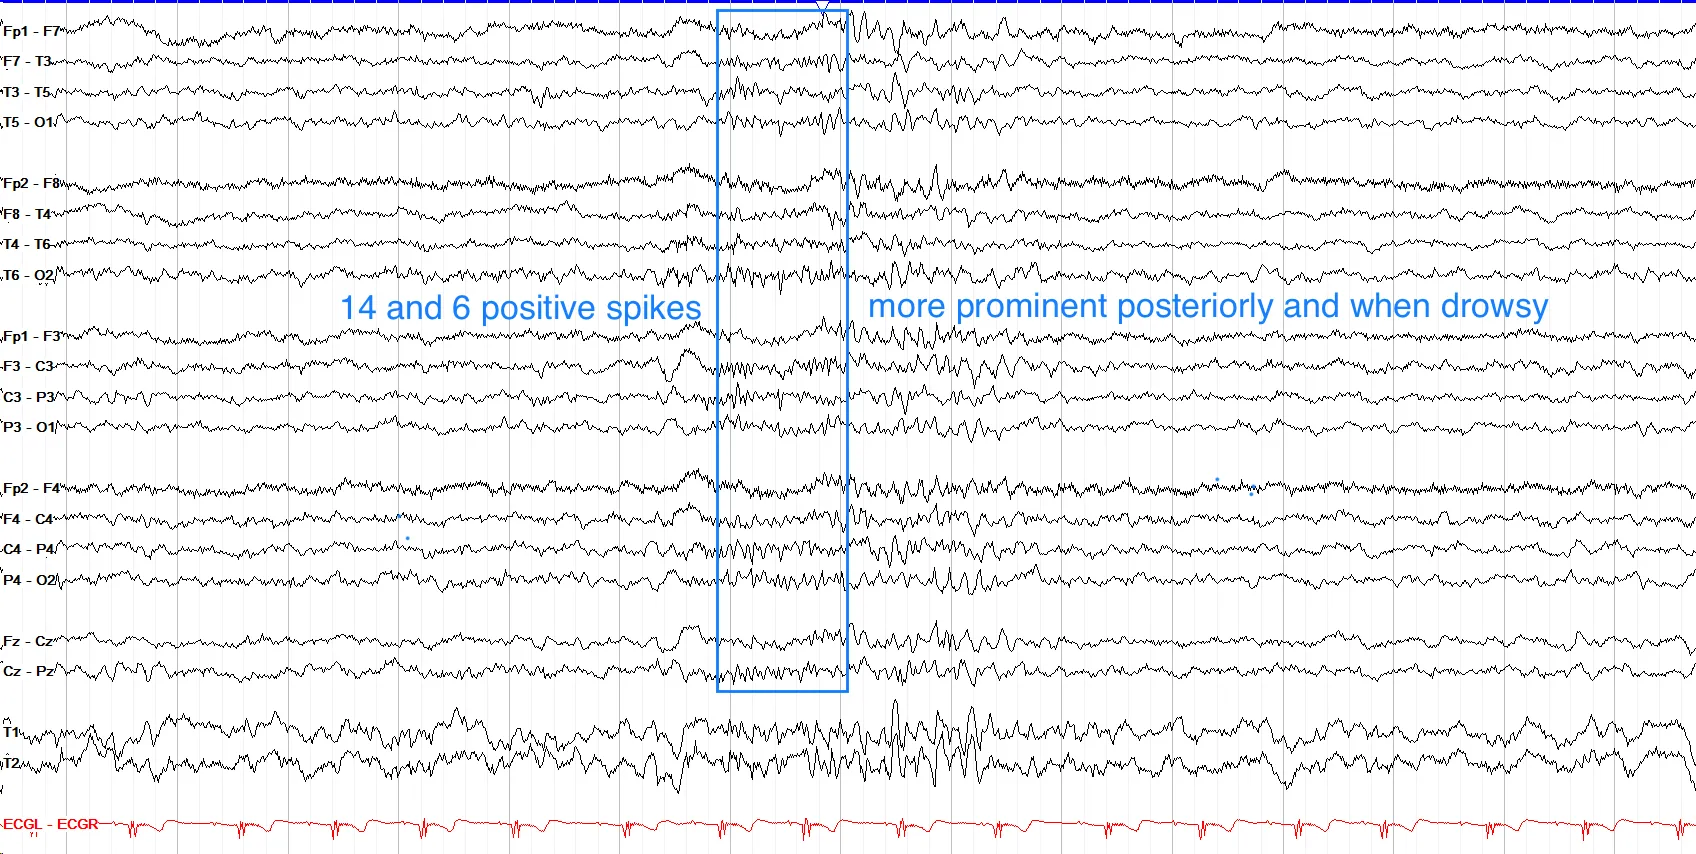
14 Hz positive spikes are brief bursts of low amplitude, arch-shaped, positive polarity spikes seen best in the posterior regions during drowsiness and light sleep, more commonly in adolescents.
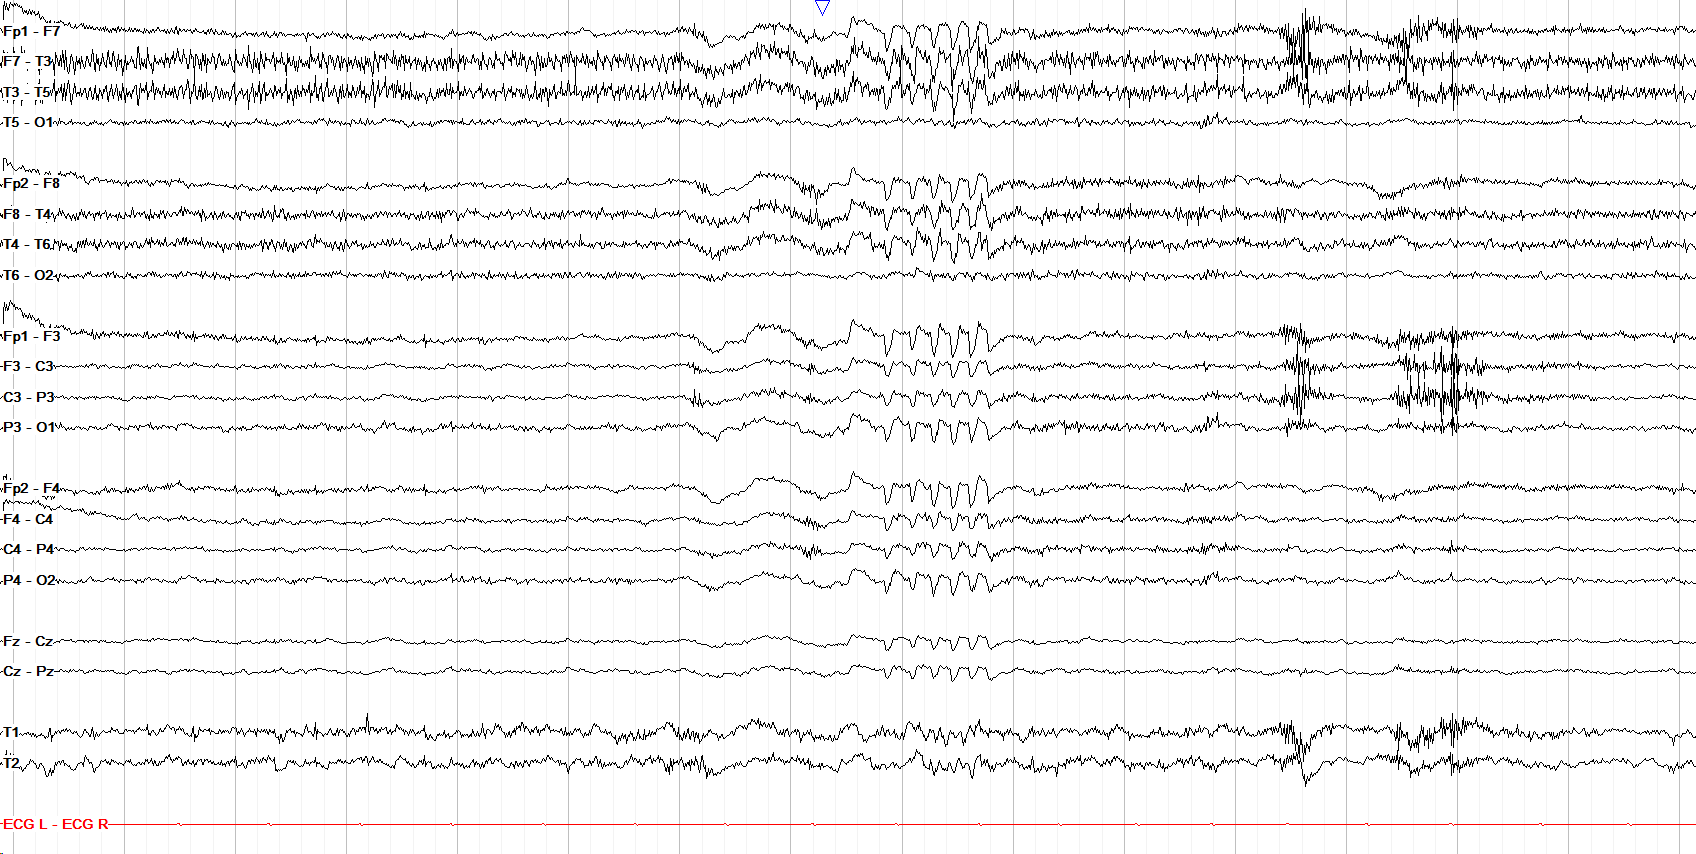
6 Hz positive spikes, like their 14 Hz counterpart, are common in the posterior regions in drowsy adolescents. Do not confuse them with 6 Hz phantom spikes, which are an analogous normal variant but have a very tiny aftergoing slow wave.
normal awake backgrounds
2 patterns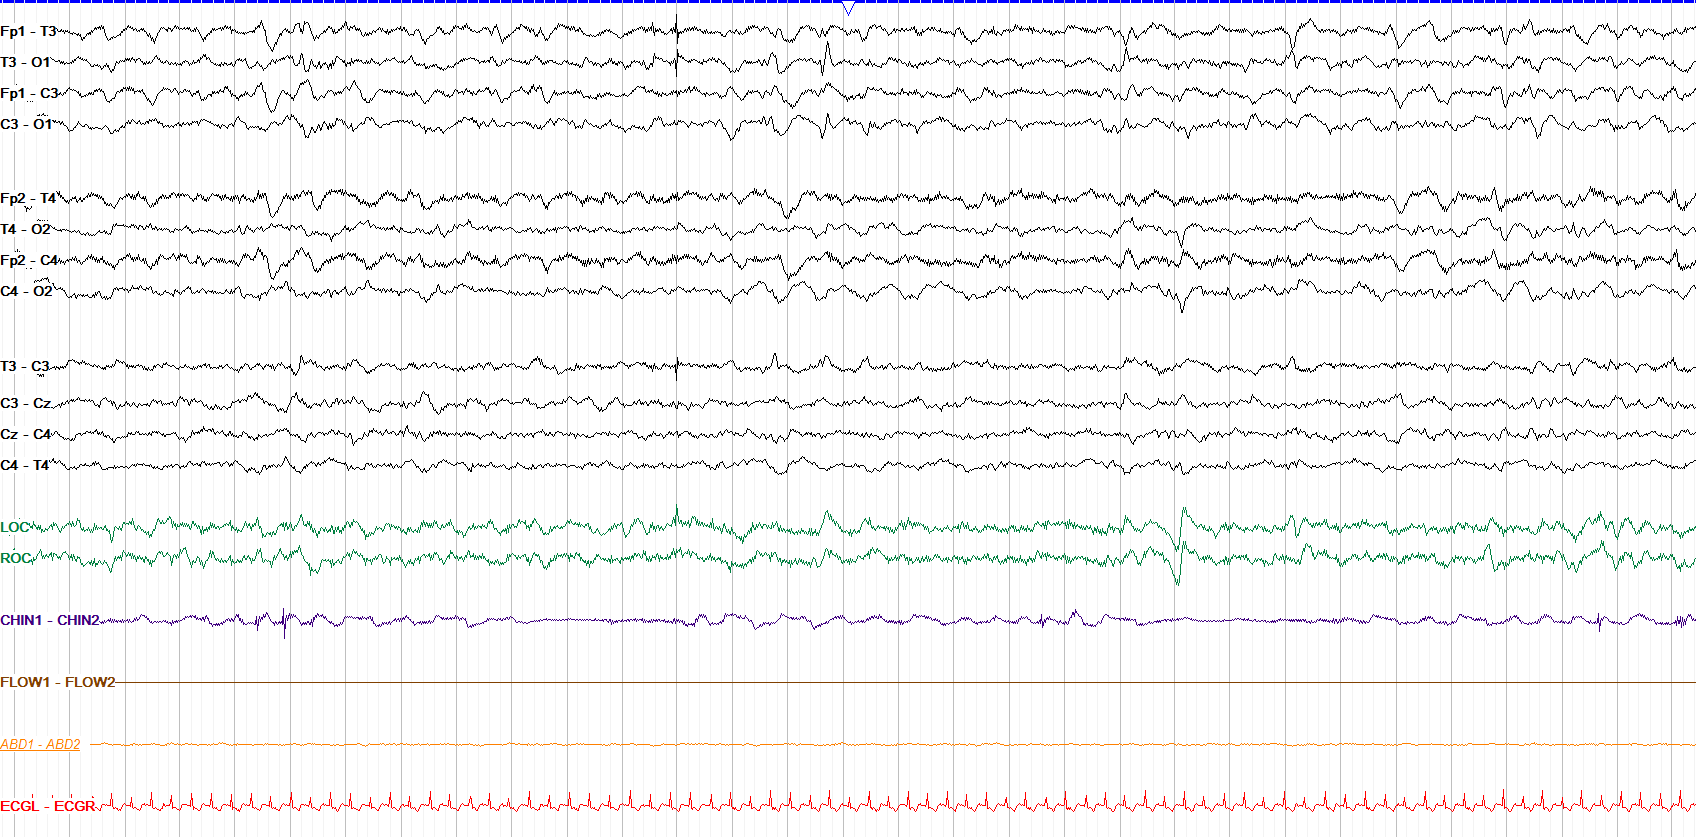
Neonates can have many sharp transients, which are discharges that are usually normal as long as they aren’t too frequent or persistent in one particular area. They should all fade away by 49 weeks PMA. This example also shows a normal awake background for a full term baby.
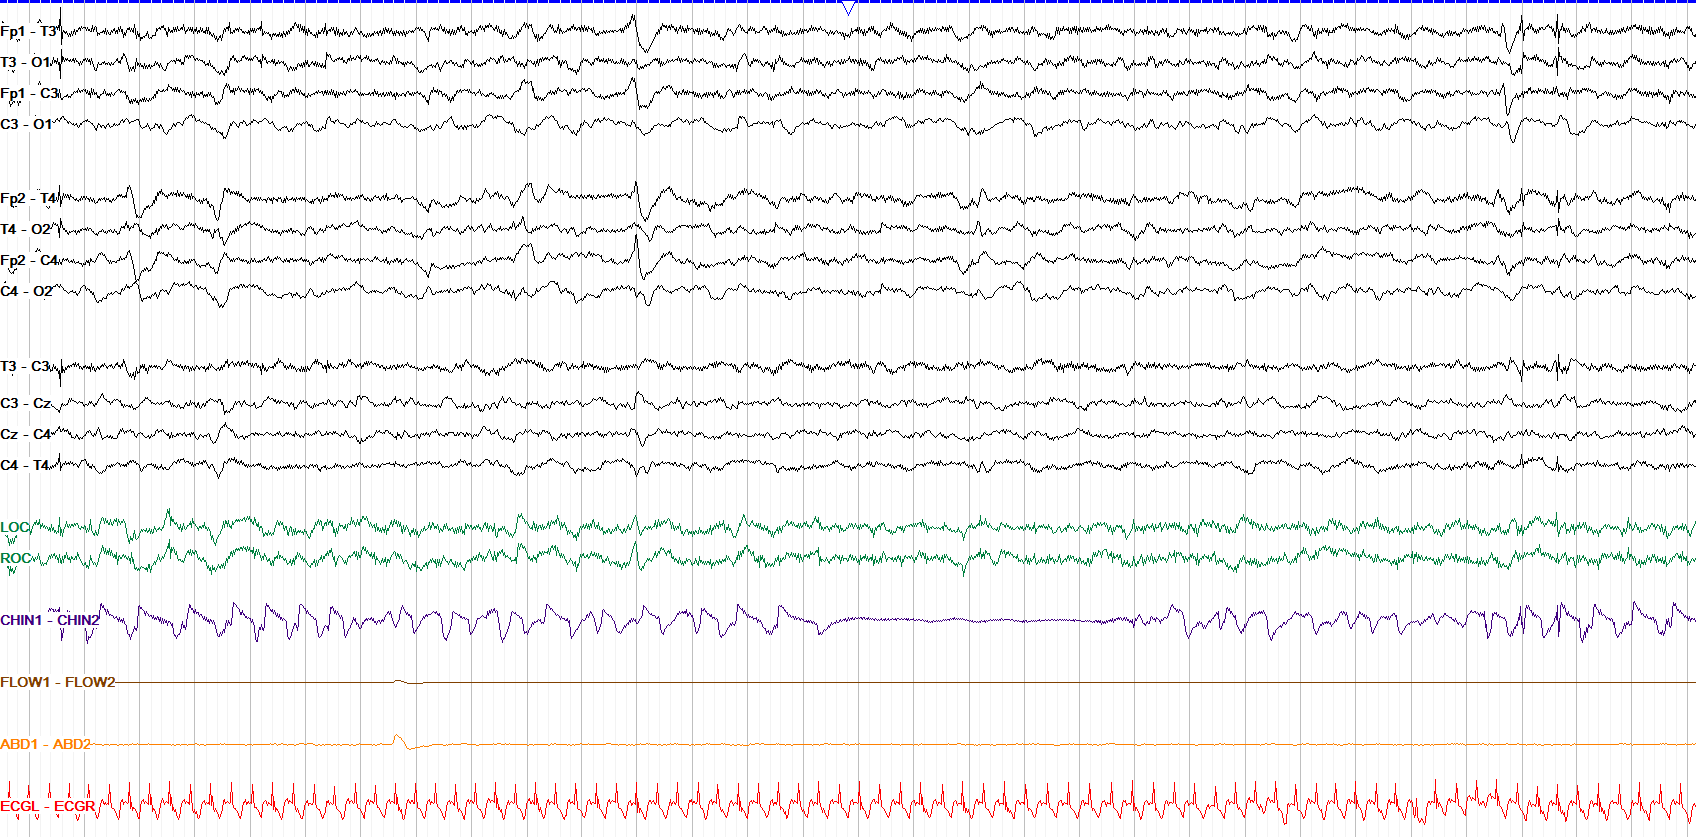
Frontal sharp transients, or encoches frontales, are bilateral synchronous discharges that are normal from around 34 to 46 weeks PMA. They really should be synchronous; if not, they may be epileptiform.
normal active sleep
1 pattern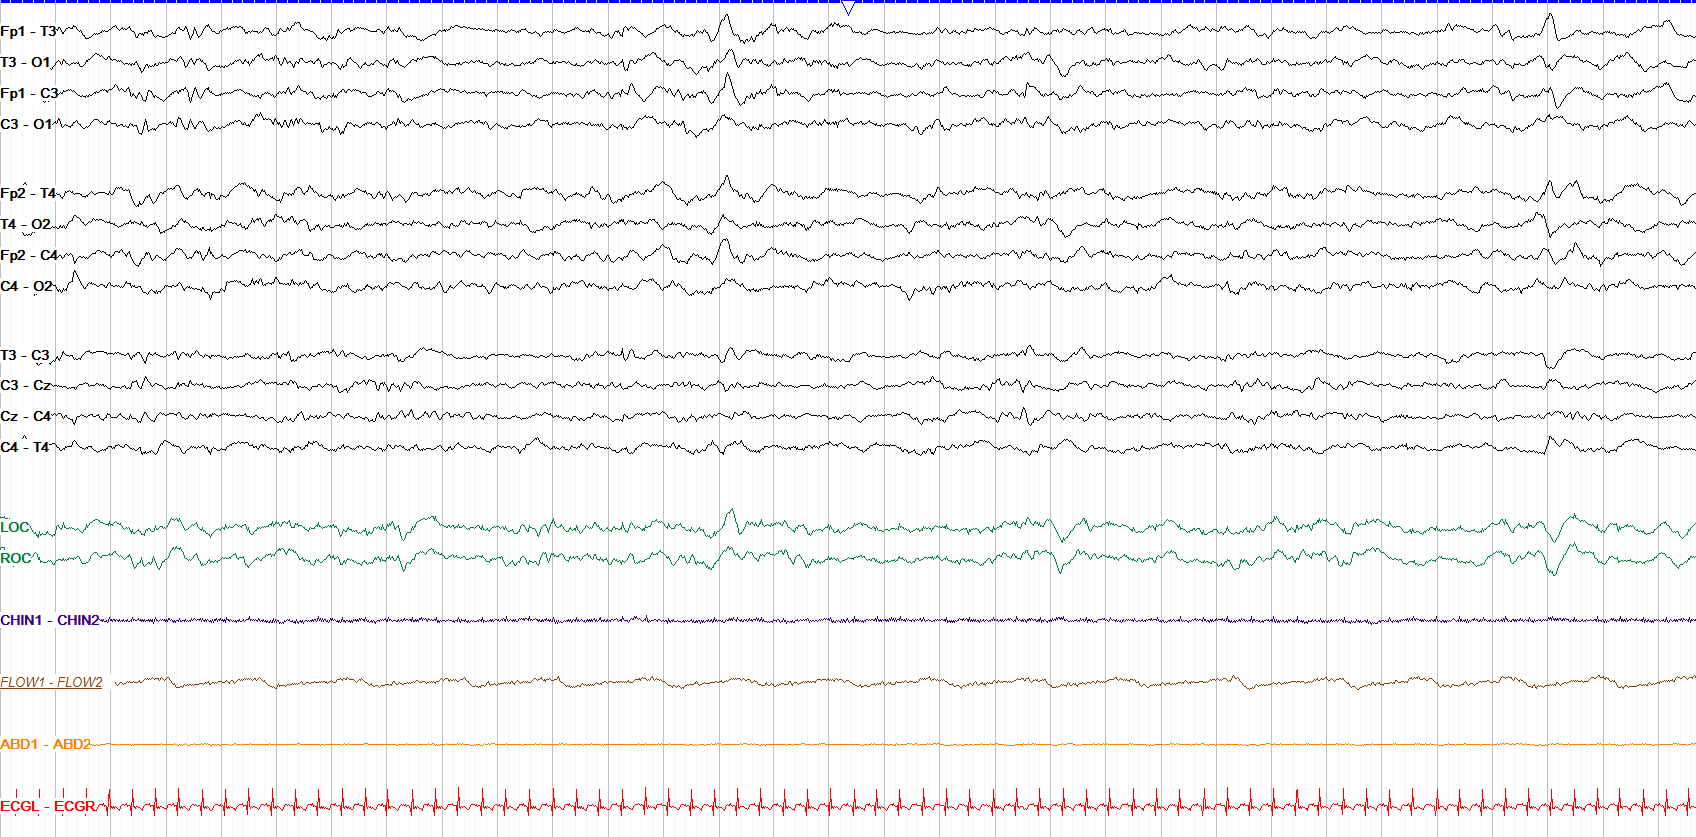
Active sleep for neonates can appear very similar to the awake state, except their eyes are closed and there are often repetitive lateral eye movements (similar to adult REM sleep). By 41 weeks PMA, the tracing should be continuous in all states including sleep.
normal quiet sleep
2 patterns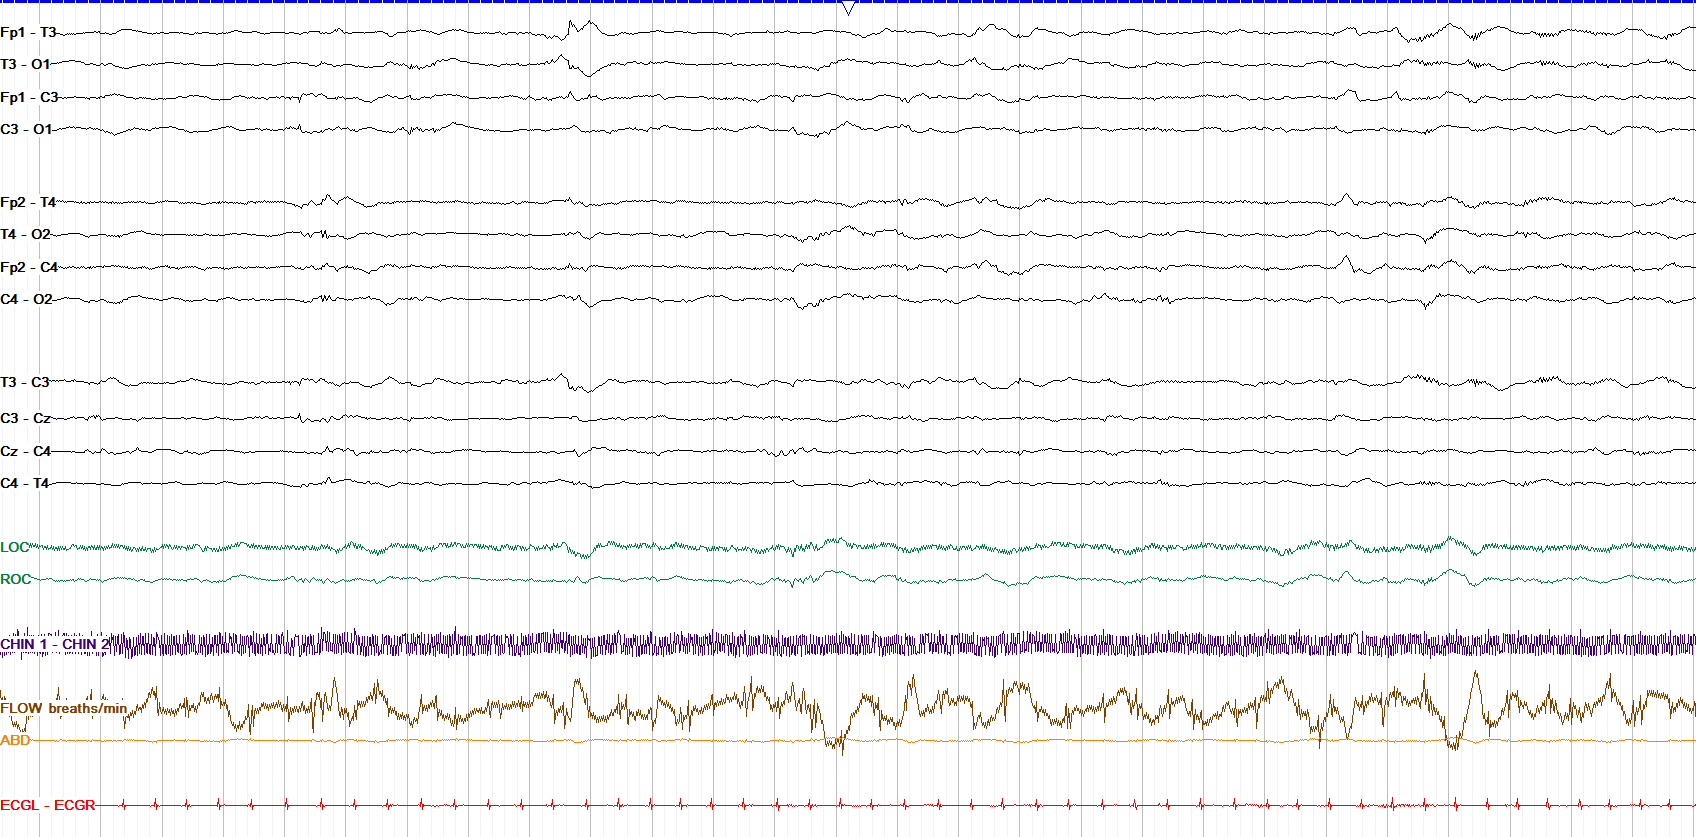
Tracé discontinu is seen during quiet sleep from 30-34 weeks PMA, and is marked by periods of attenuation less than 25 microvolts in amplitude between bursts of higher amplitude activity.
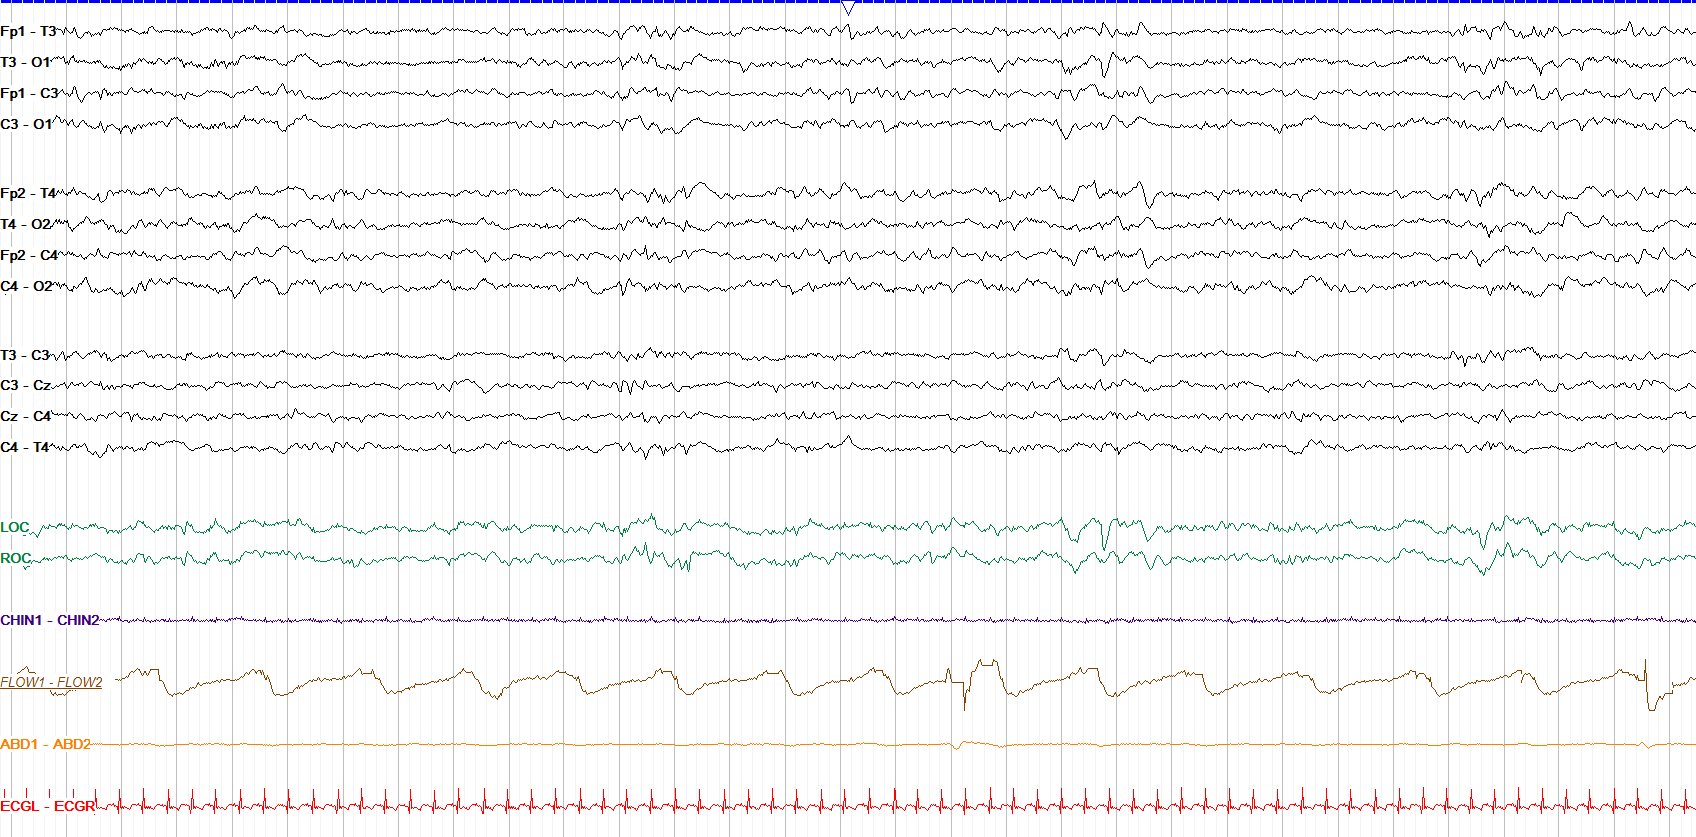
Tracé alternans replaces tracé discontinu at around 34 weeks PMA, and differs in that its periods of attenuation are higher than 25 microvolts in amplitude. From 38 weeks PMA onward alternans slowly evolves into slow wave sleep.
infancy patterns
6 patterns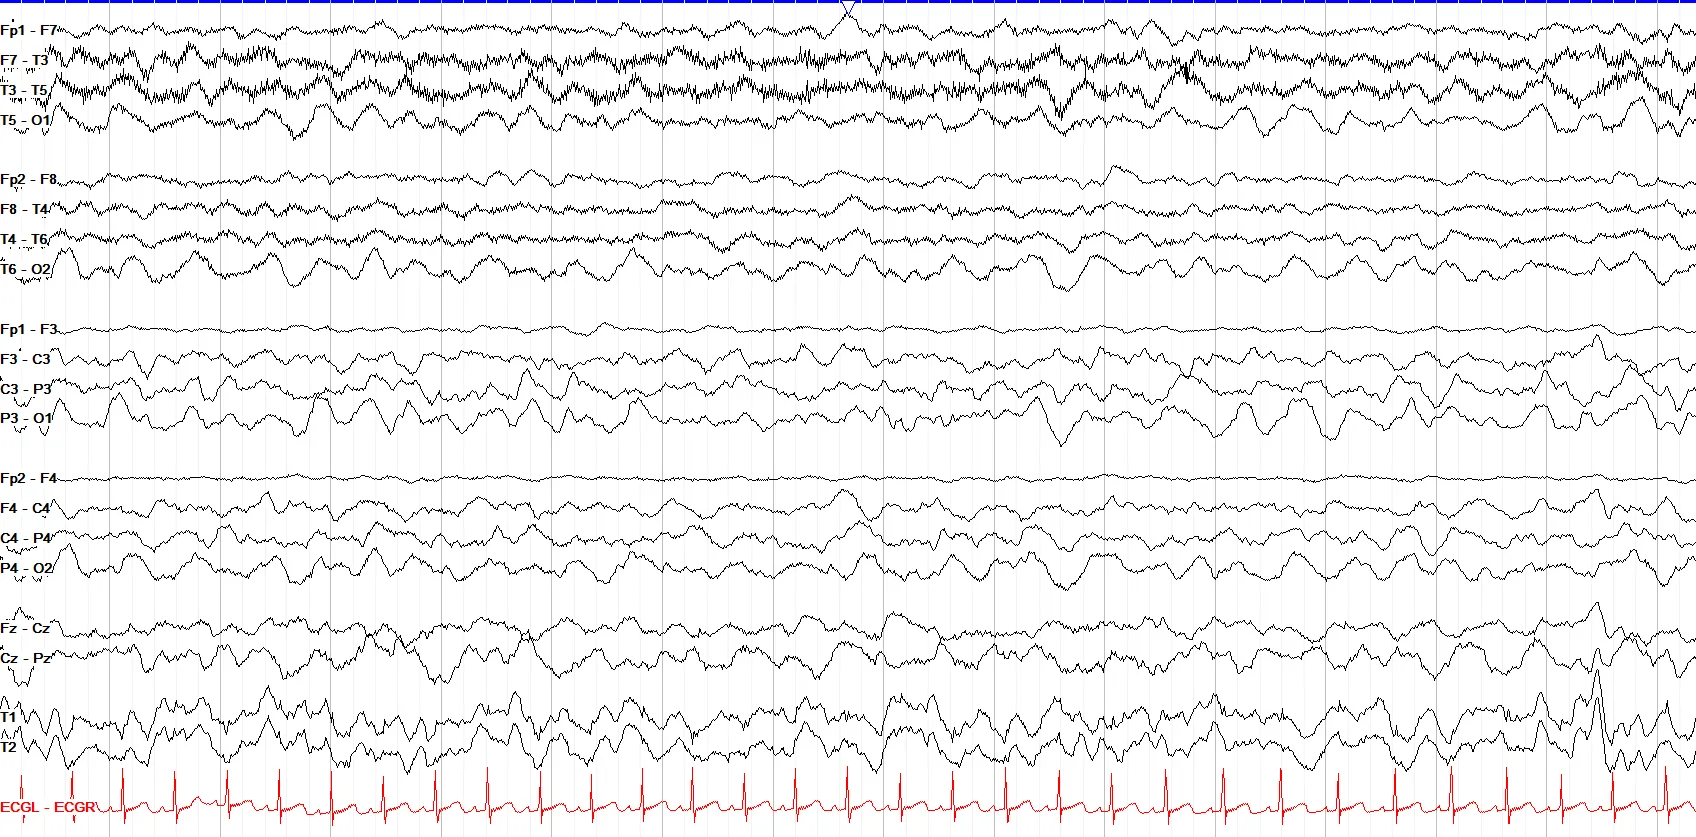
After the neonatal phase, babies' records are dominated by delta activity the first few months, with a PDR that is often incomplete and, when present, quite slow in the delta frequency. Eye blinks may not be seen yet.
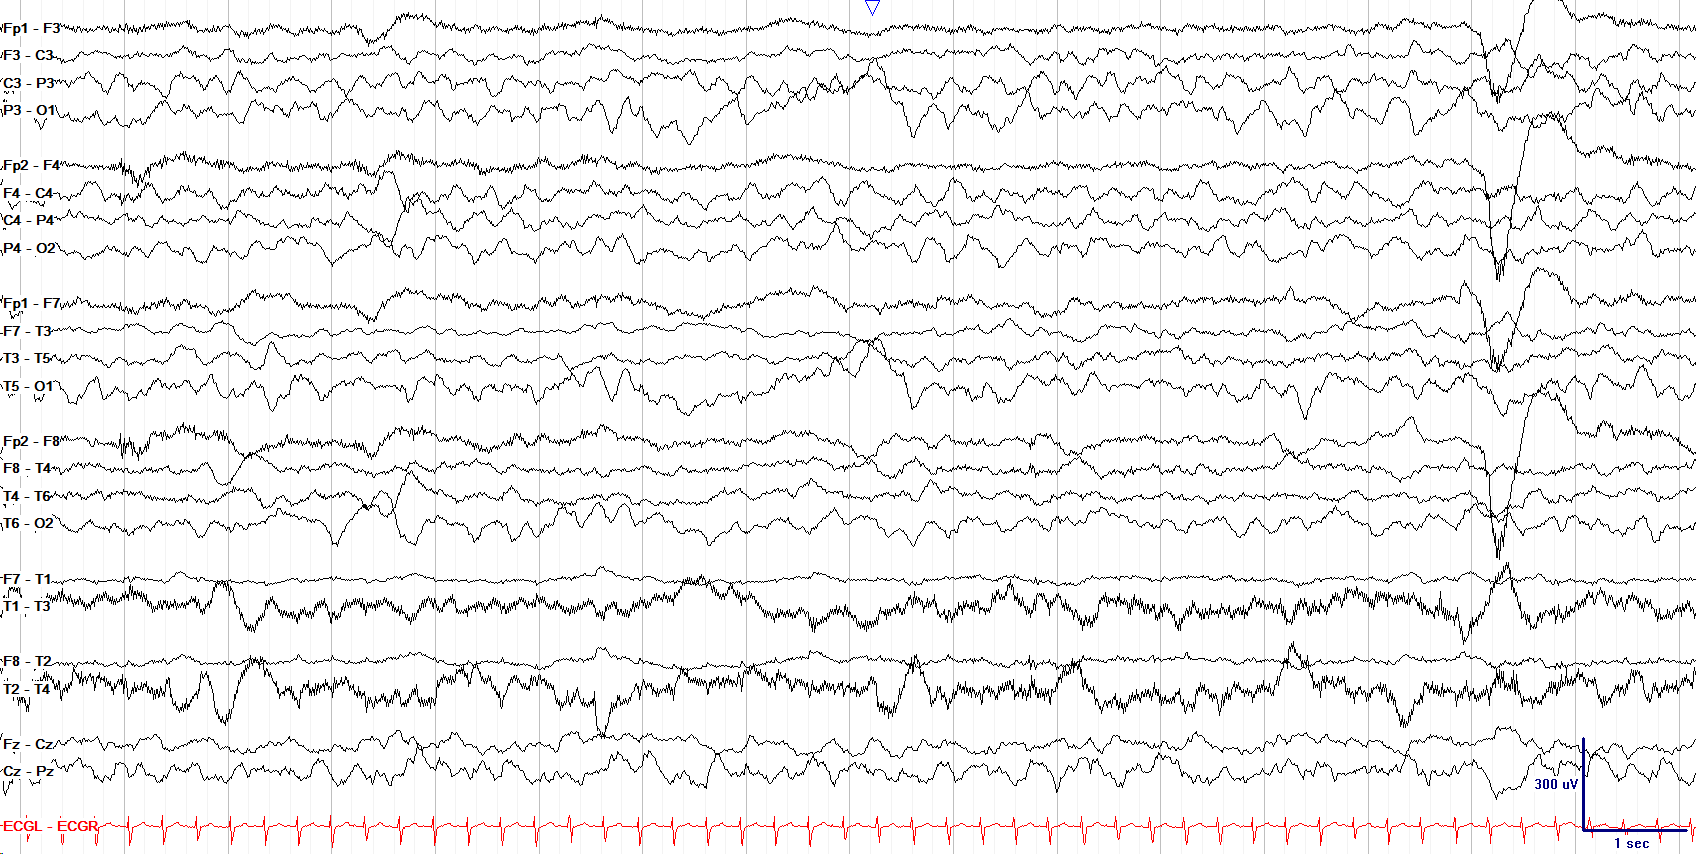
As babies approach 6 months of age, their background shows more theta frequencies amongst the still predominant delta, and the AP gradient can start to become more apparent.
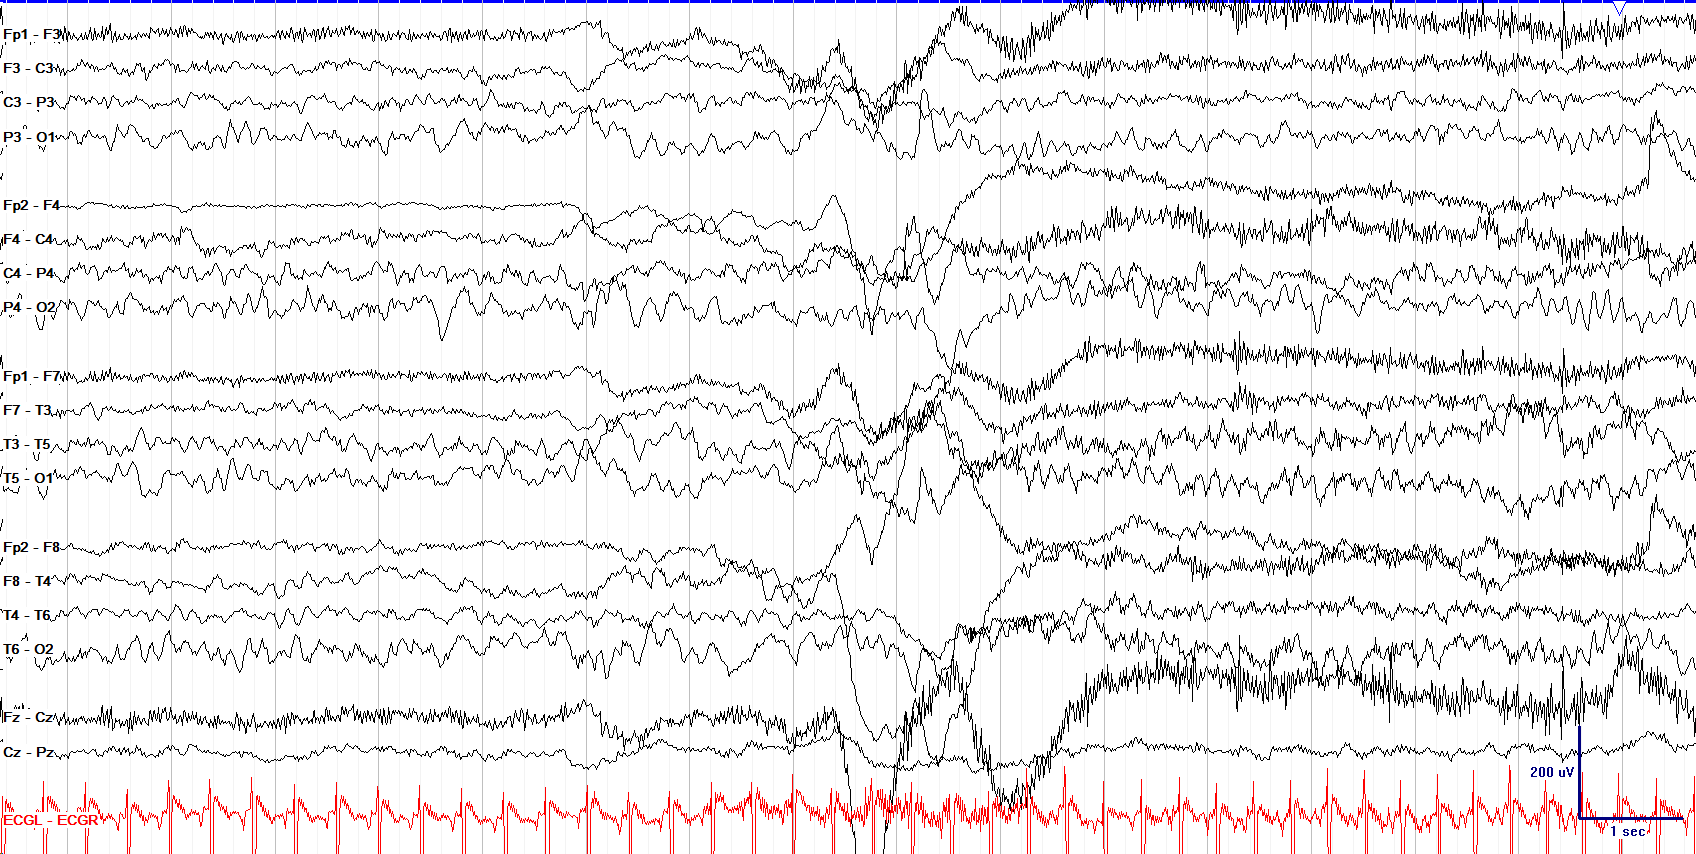
By 6 months, the PDR should be 4-5 Hz, and by 1 year it reaches 6 Hz. Across that timeframe theta is seen more in wakefulness, with delta still dominant in drowsiness.
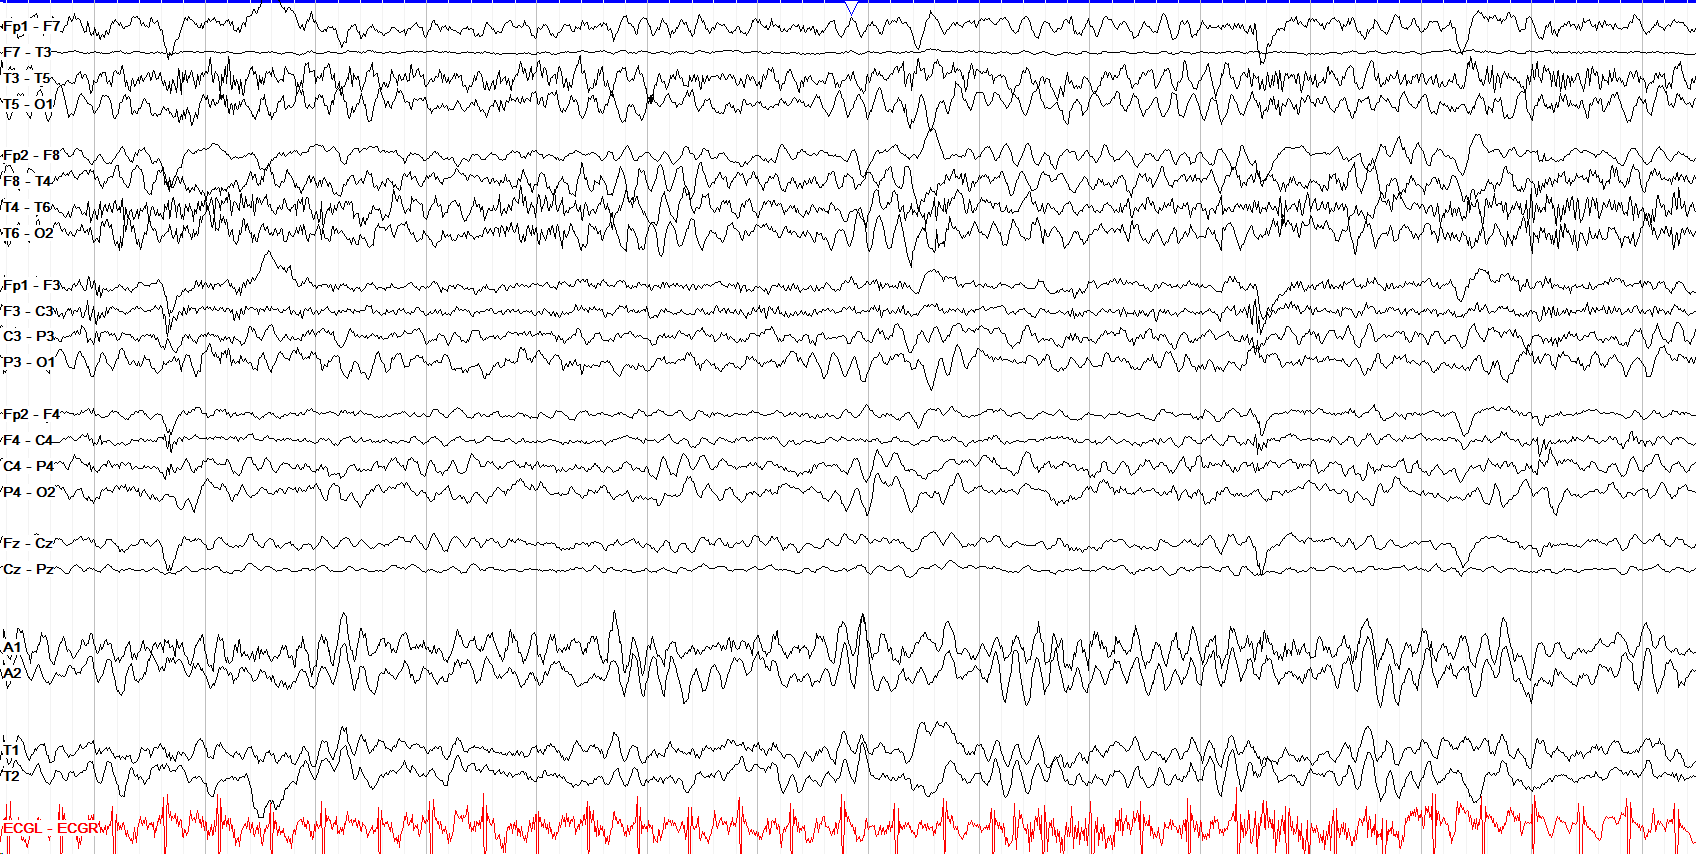
At one year, the PDR should be 6 Hz with a clear AP gradient. In this tracing note that F7 and T3 are too close together; if two electrodes see the same voltage on bipolar montage, the difference between their voltages is zero, and you'll get a flat tracing line for that pair (termed a salt bridge).
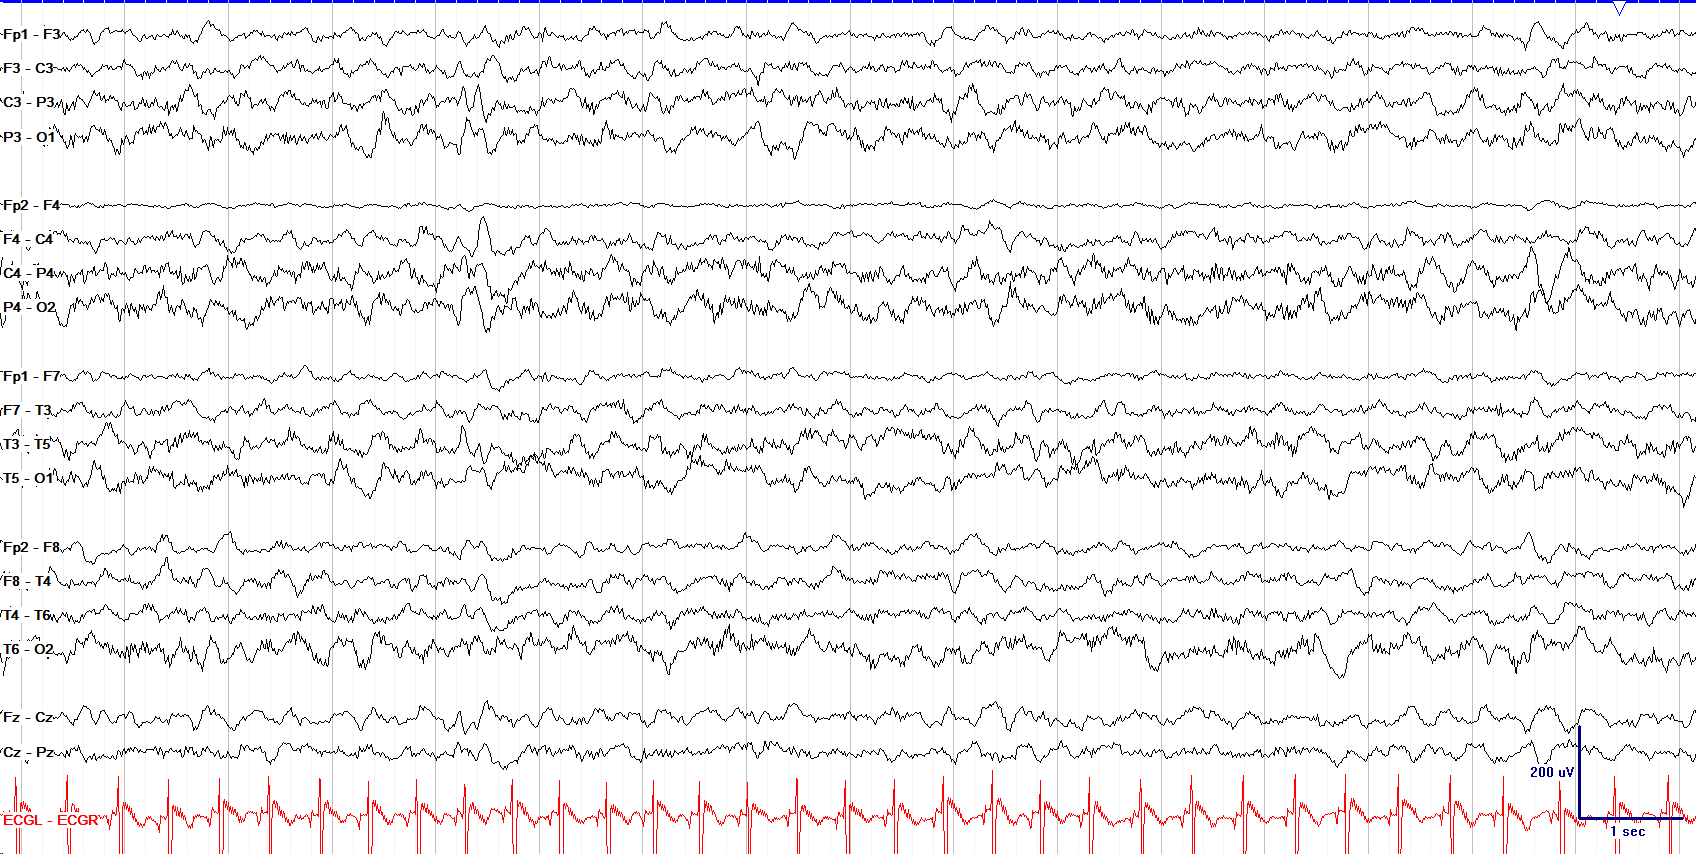
While the awake tracing for babies becomes more filled with theta and alpha towards one year, drowsiness is still dominated by higher amplitude delta activity; despite this slow activity, note the good AP gradient here.
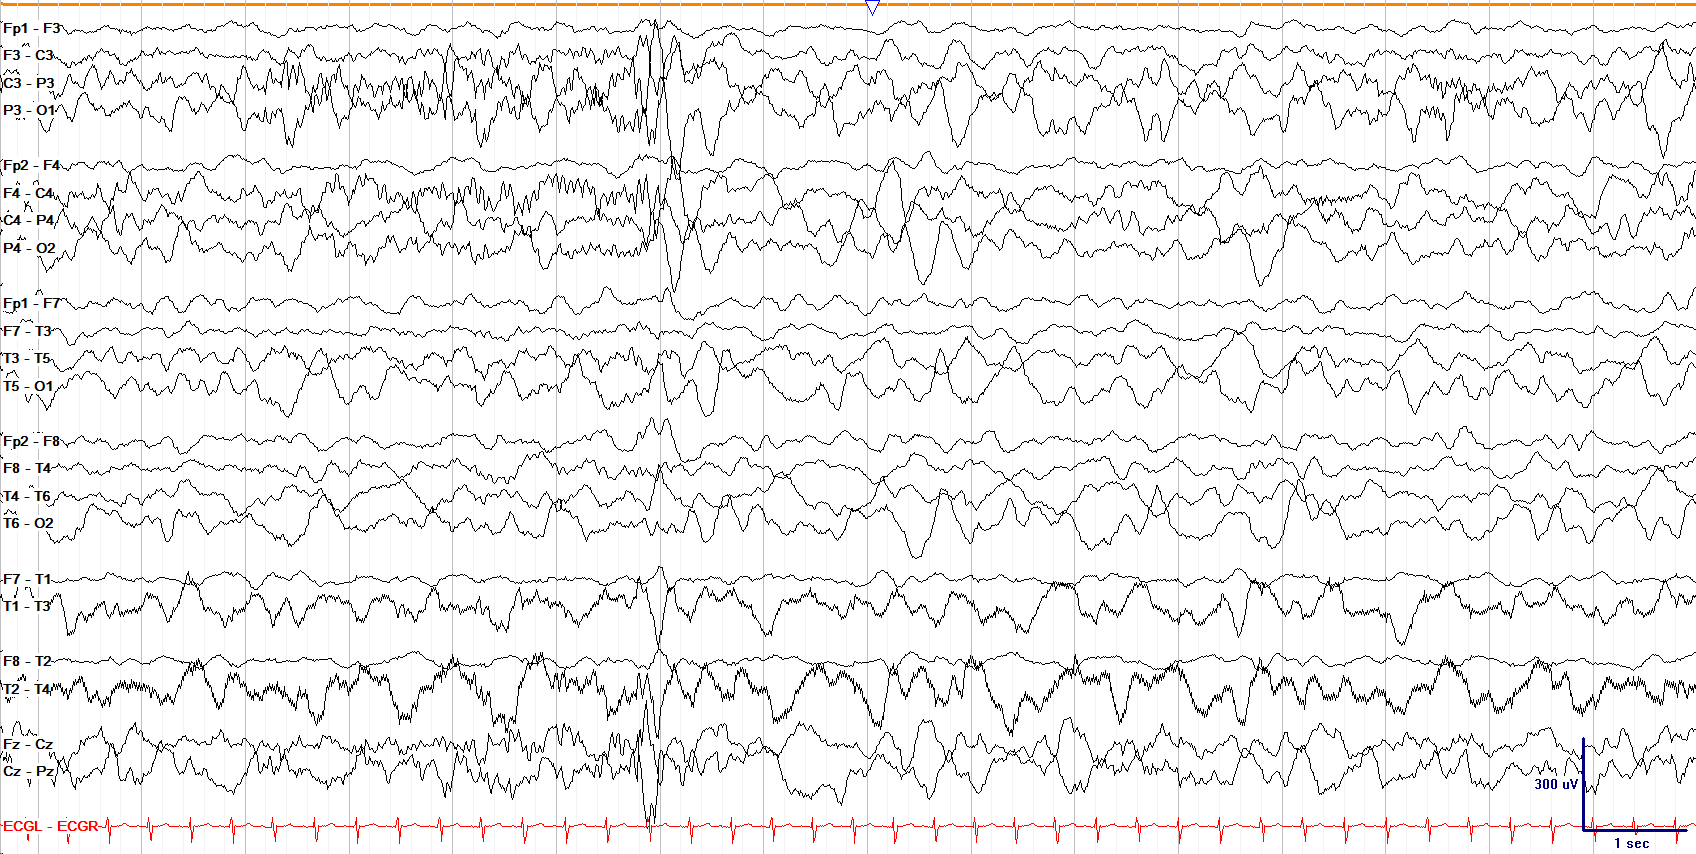
Sleep architecture arises in the first months of life. Spindles should be present by 2 months, and can be quite prolonged but become synchronous by 2 years of age. Sleep architecture in kids is often very high amplitude.
early years patterns
6 patterns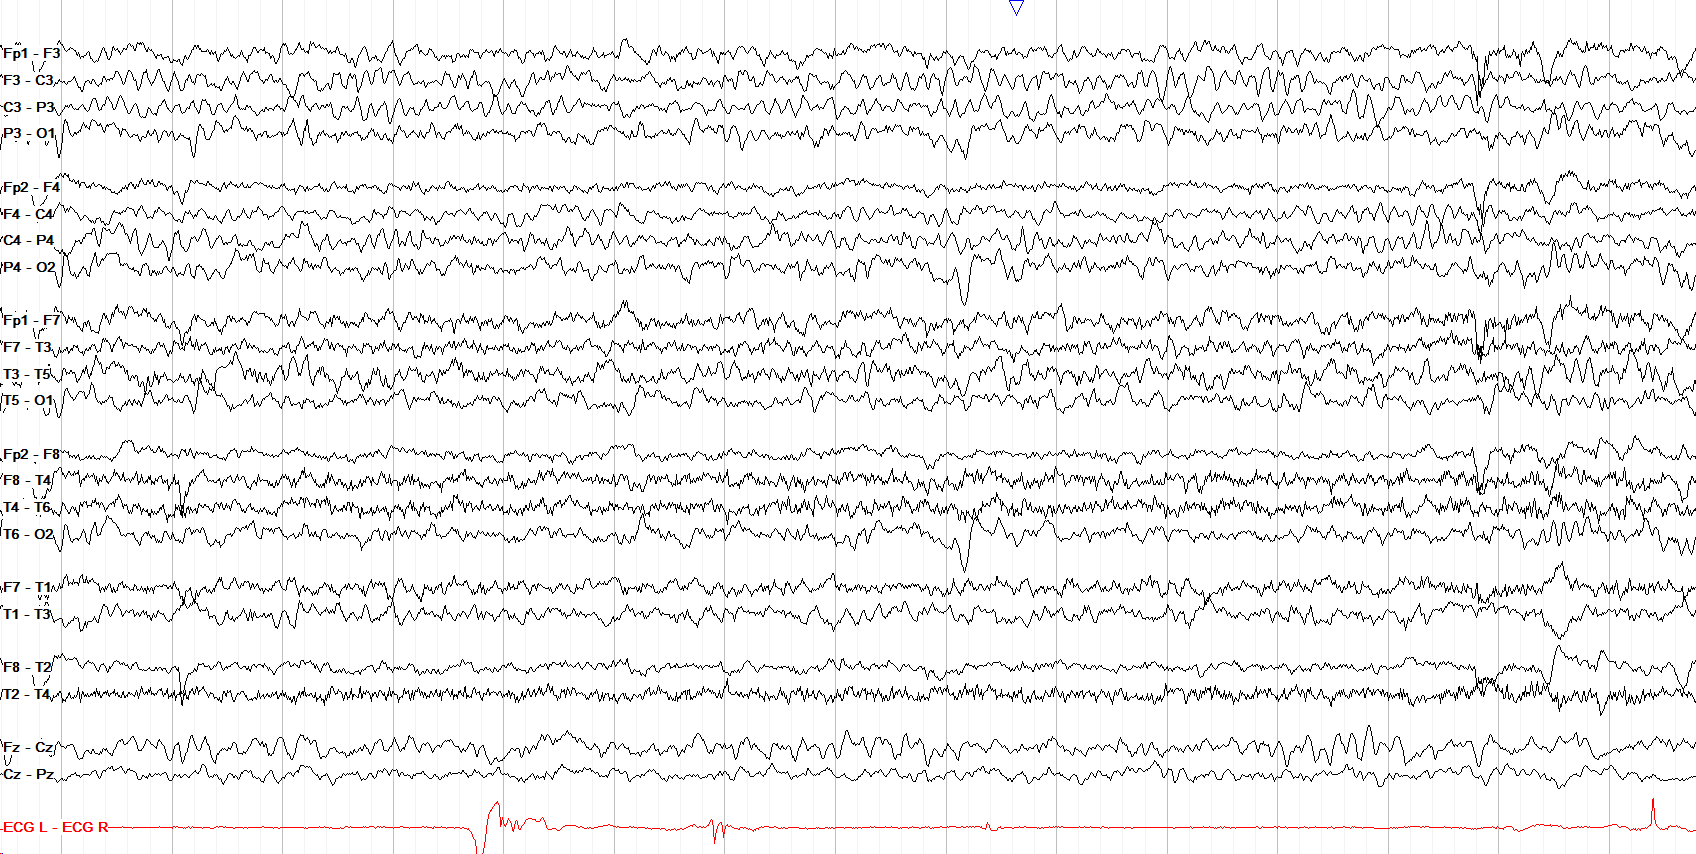
By 2 years old, the PDR should be at least 7 Hz, with an awake background mostly of theta, alpha and beta. Posterior slow waves of youth--posterior delta waves with the PDR embedded in them--can be seen.
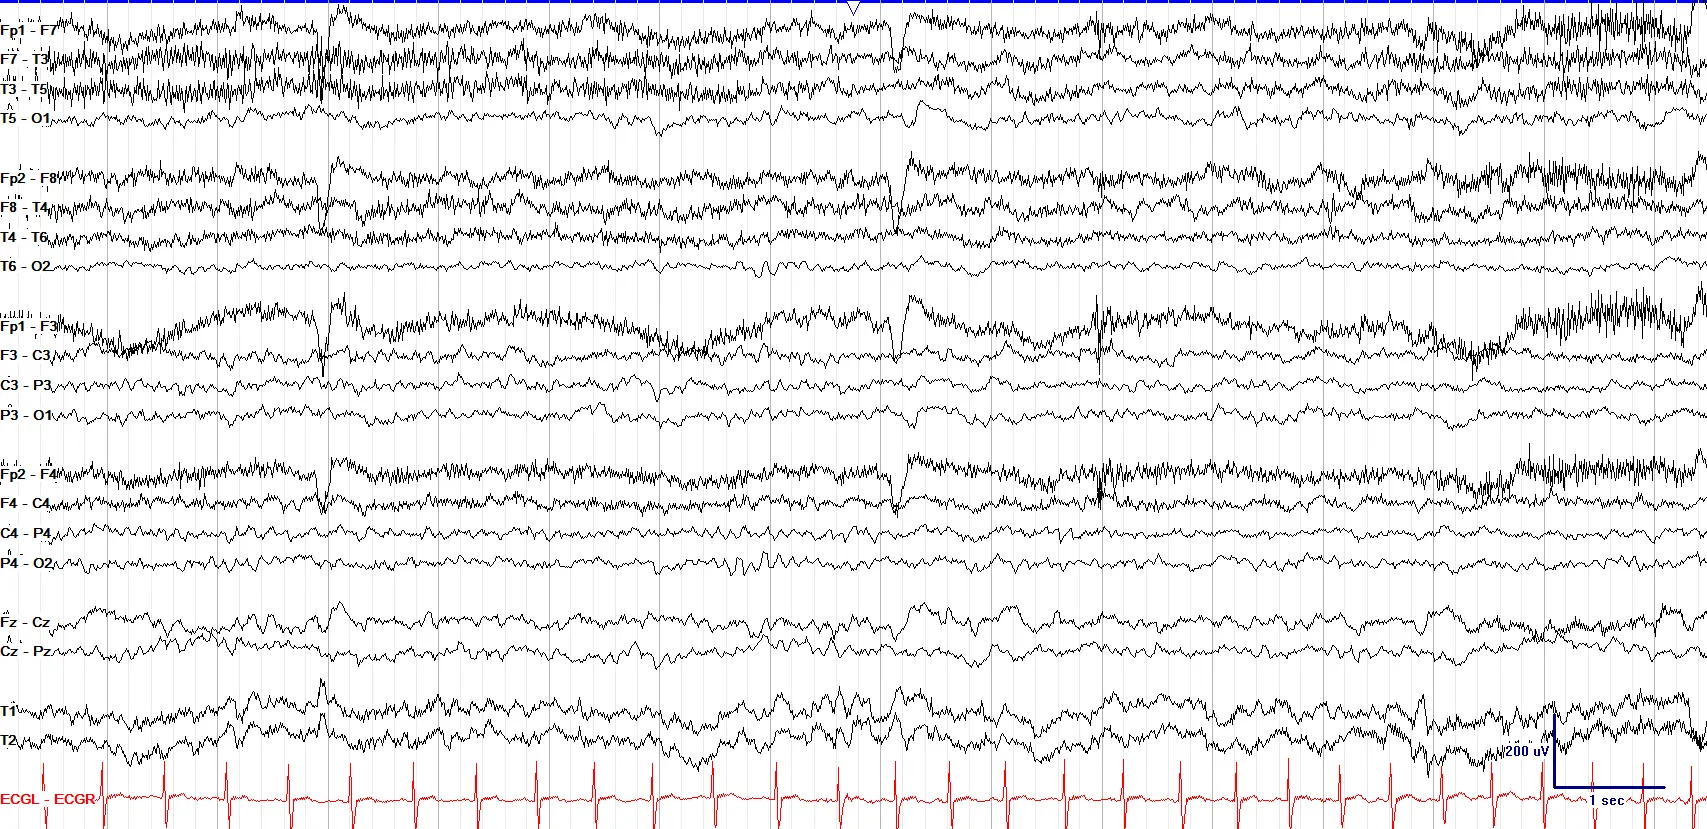
By 3 years old the PDR should be at least 8 Hz, and the background continues to accommodate more alpha amongst the expected theta and, to a lesser extent, delta activity.
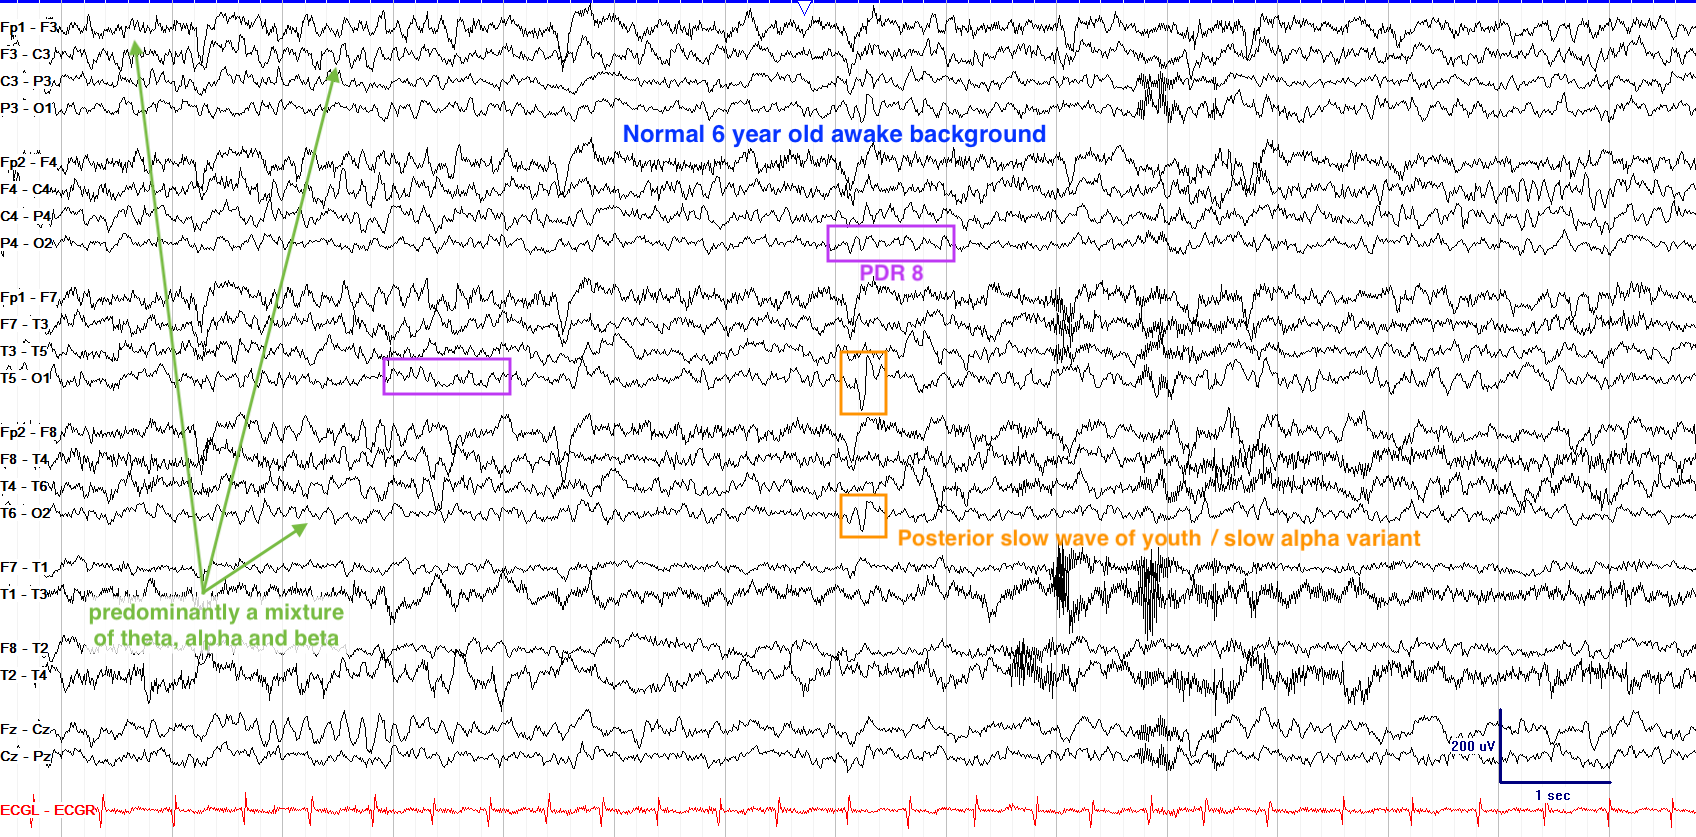
From 3 years to 10 years old, the PDR changes slower than it does in the first few years, going from 8 Hz at 3 years to 10 Hz by 10 years. Throughout childhood, amplitudes tend to be higher than in adults, especially in sleep.
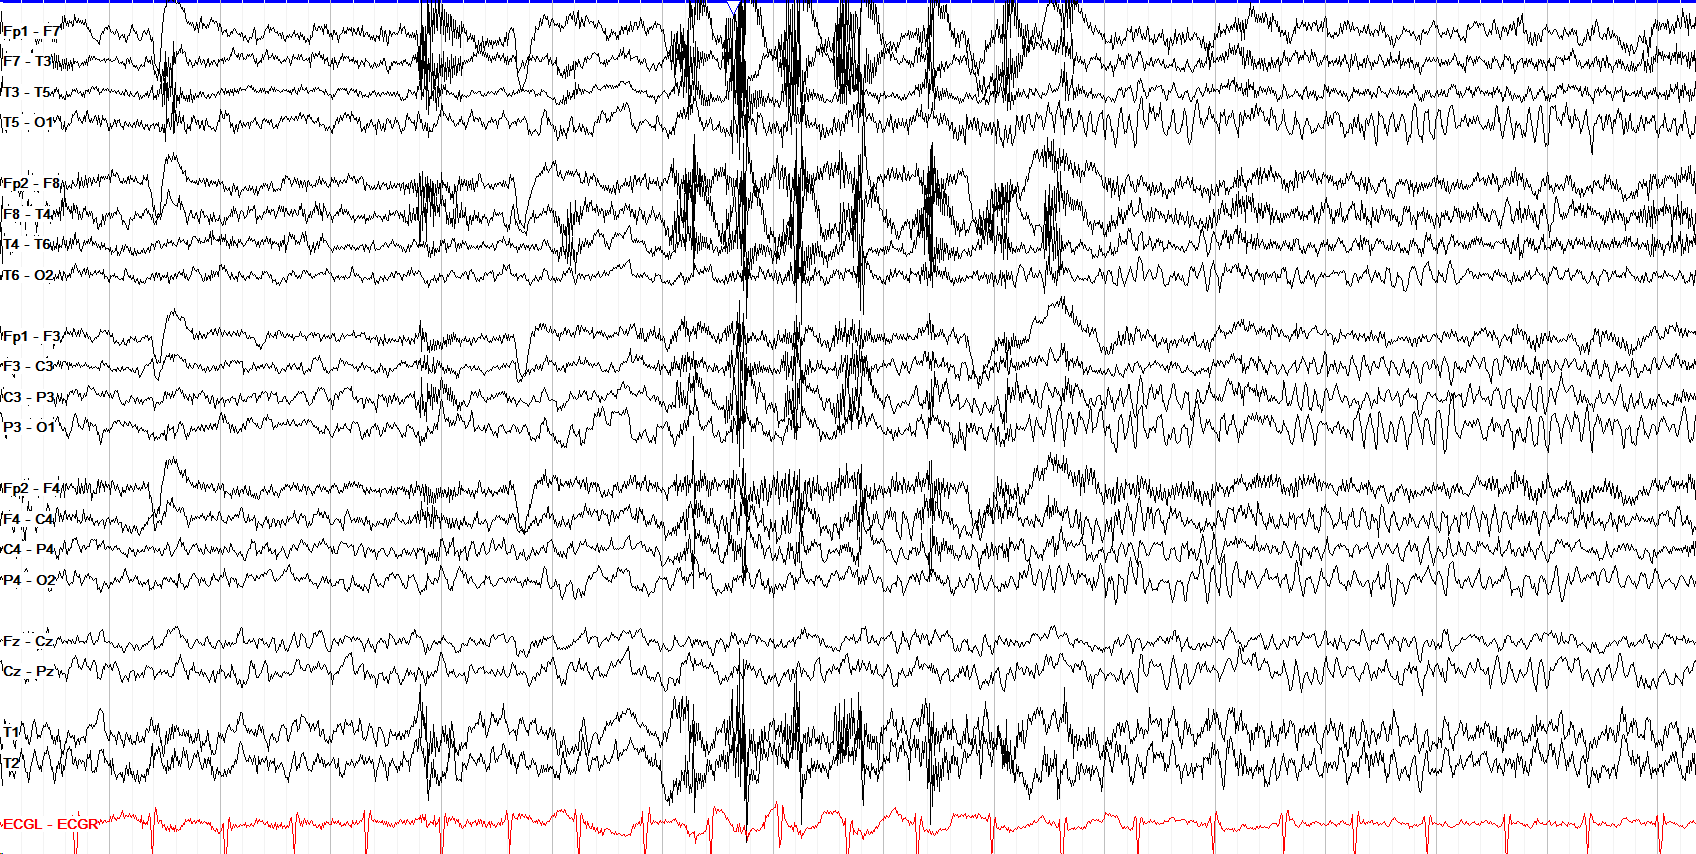
By 8 years old, the PDR should reach 9 Hz and the background can look pretty similar to an adult, except with more theta than an adult should have.
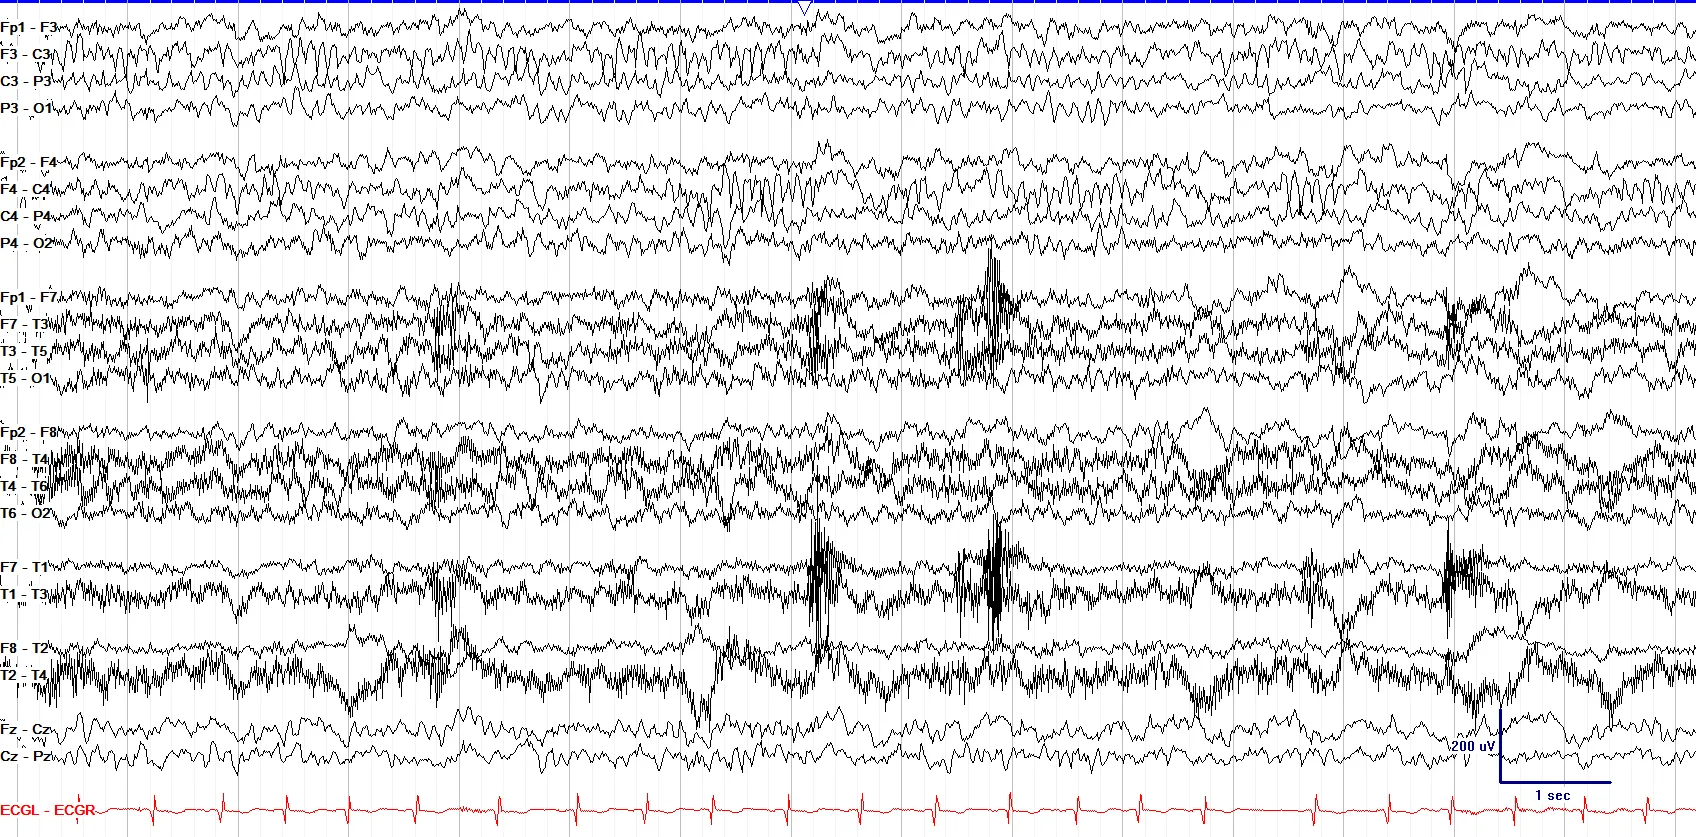
Drowsiness in children can still have significant amounts of delta activity, and you'll start to see other benign variants that are most often seen when drowsy in adults, such as the mu rhythm or temporal wicket waves.
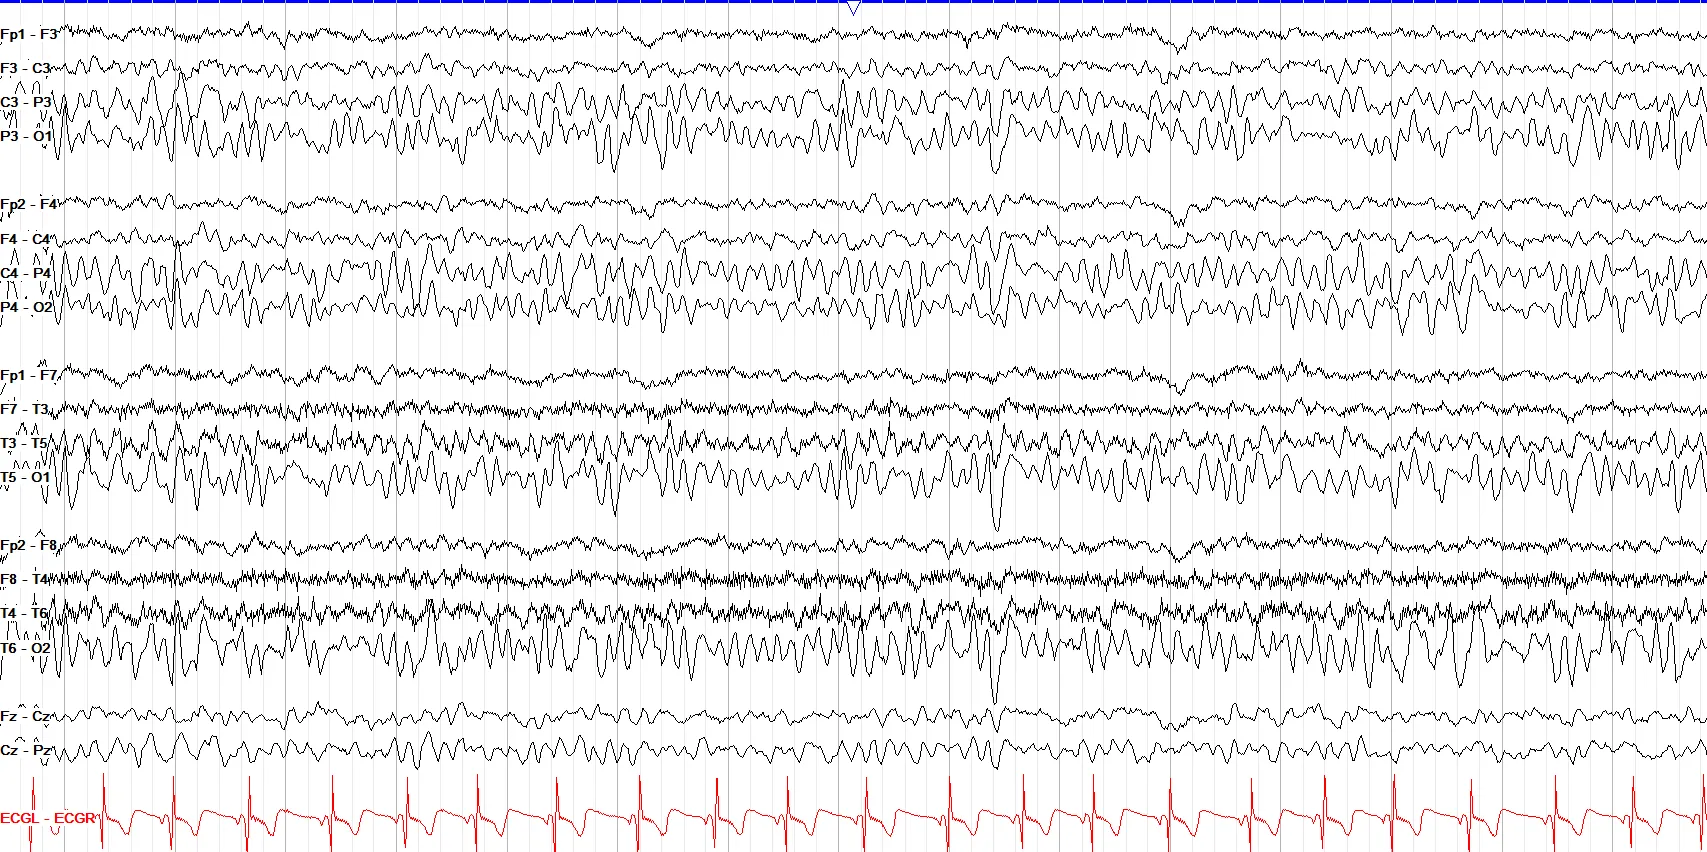
Posterior slow waves of youth are a normal finding of high amplitude, theta to delta waves within the PDR that can be bilateral or unilateral, and which usually arise from 3-6 years old and go away by adulthood.
pediatric epileptic syndromes
7 patterns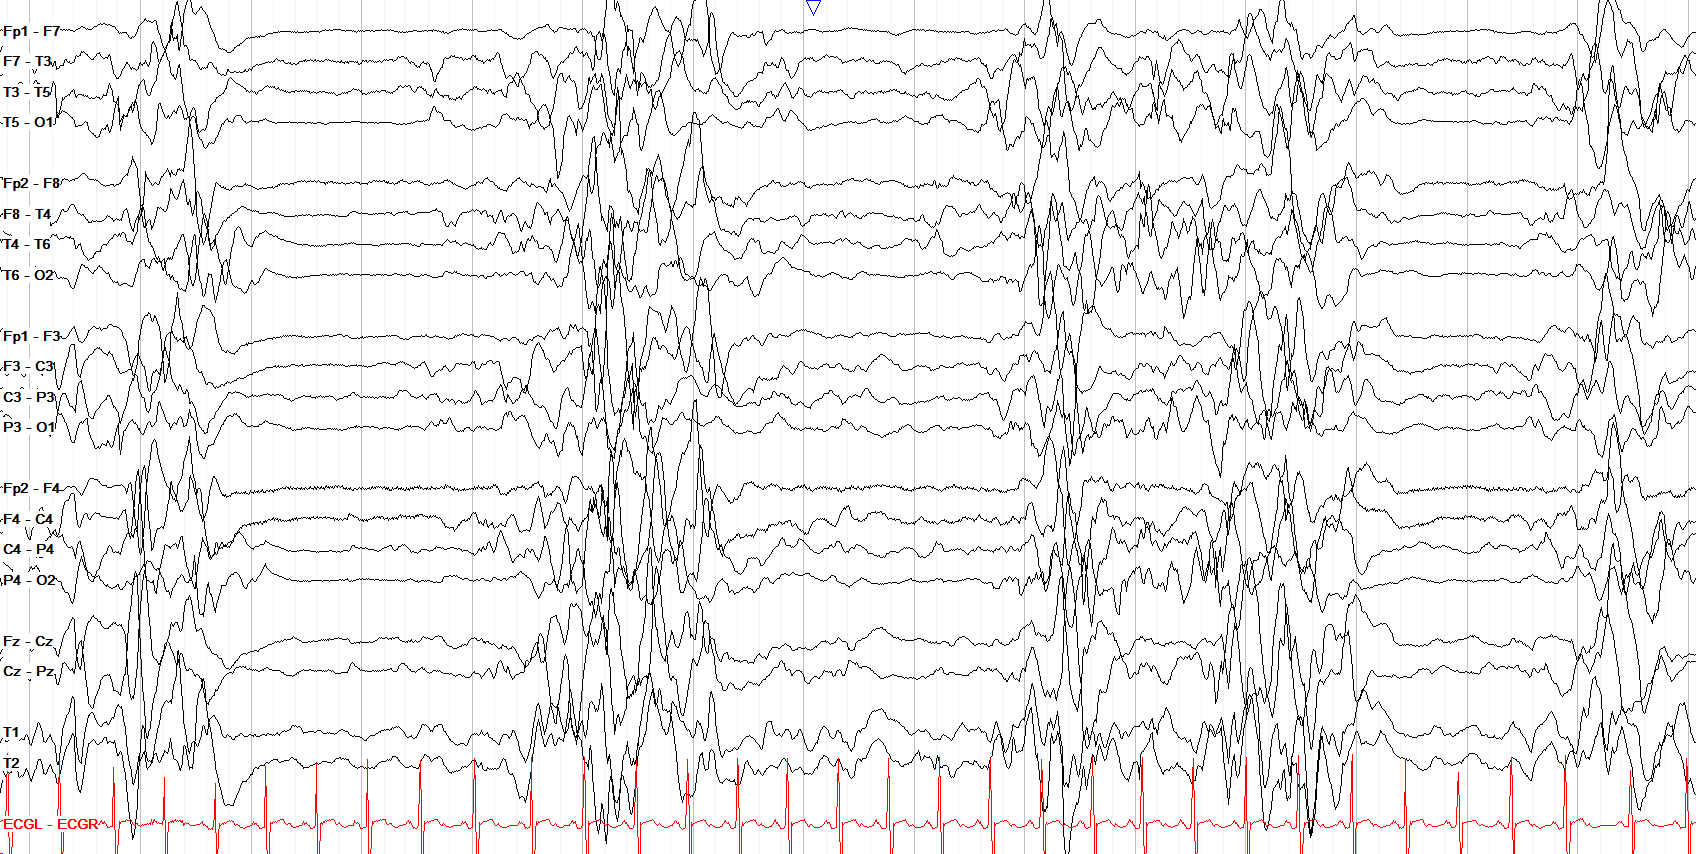
Ohtahara syndrome, now encompassed within early-infantile developmental and epileptic encephalopathy syndrome (EIDEE), is a very early infantile epileptic encephalopathy marked by discontinuity and high amplitude bursts of multifocal discharges. It often leads to an early death; if not, it can develop into infantile spasms with significant intellectual impairment.
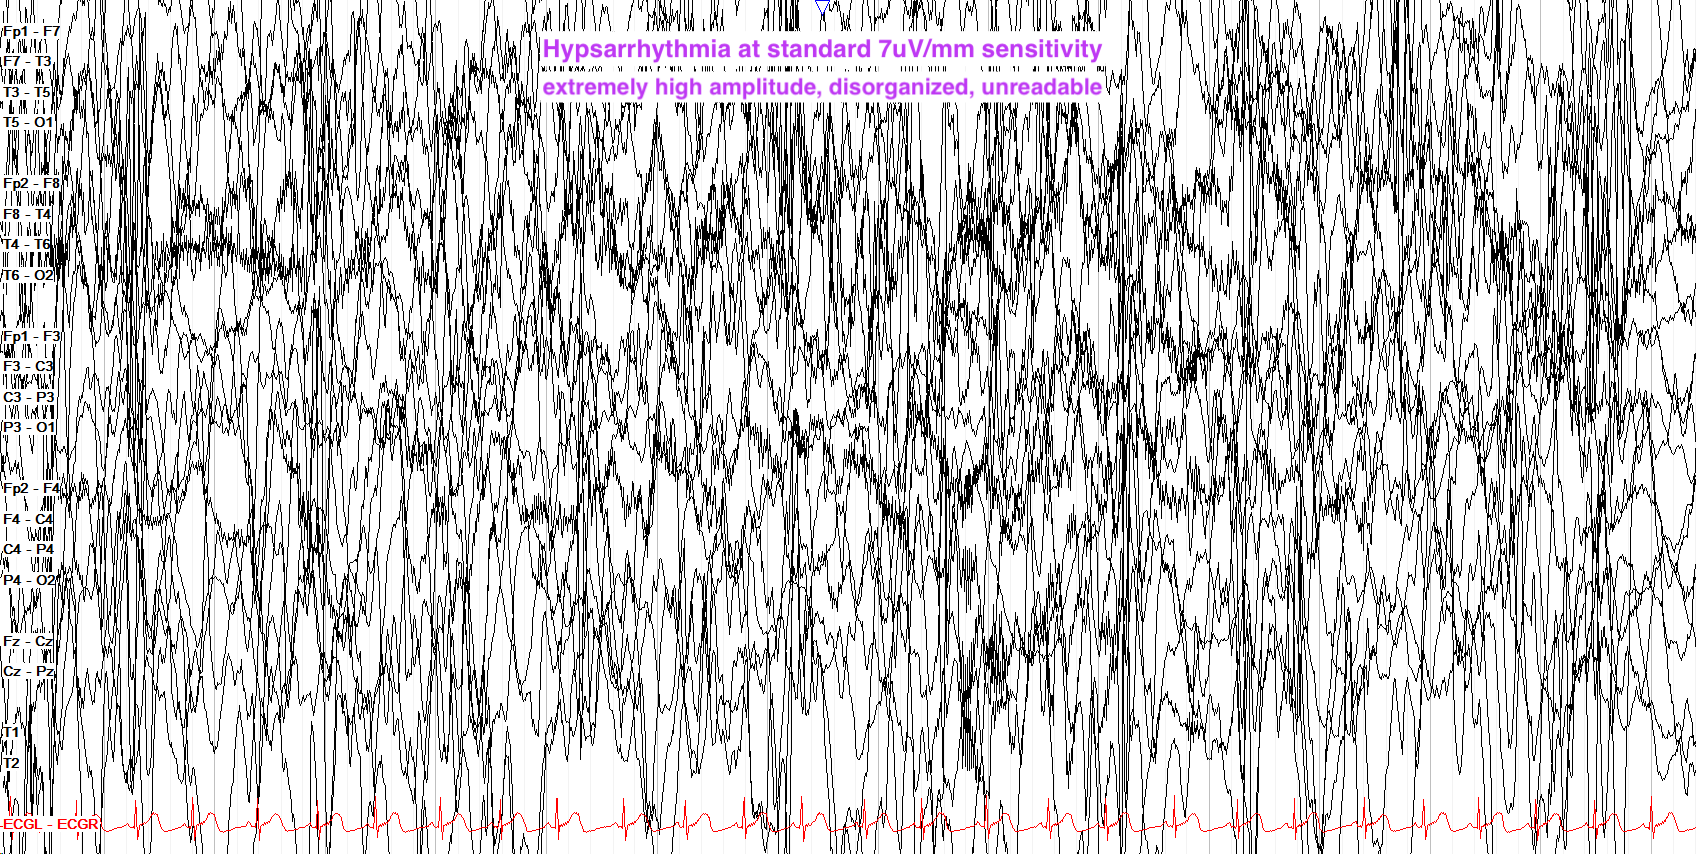
Hypsarrhythmia describes an extremely high amplitude and disorganized background with multifocal spikes. It is most often seen in the setting of infantile spasms (infantile epileptic spasms syndrome, IESS, previously termed West Syndrome), and can progress into Lennox Gastaut Syndrome.
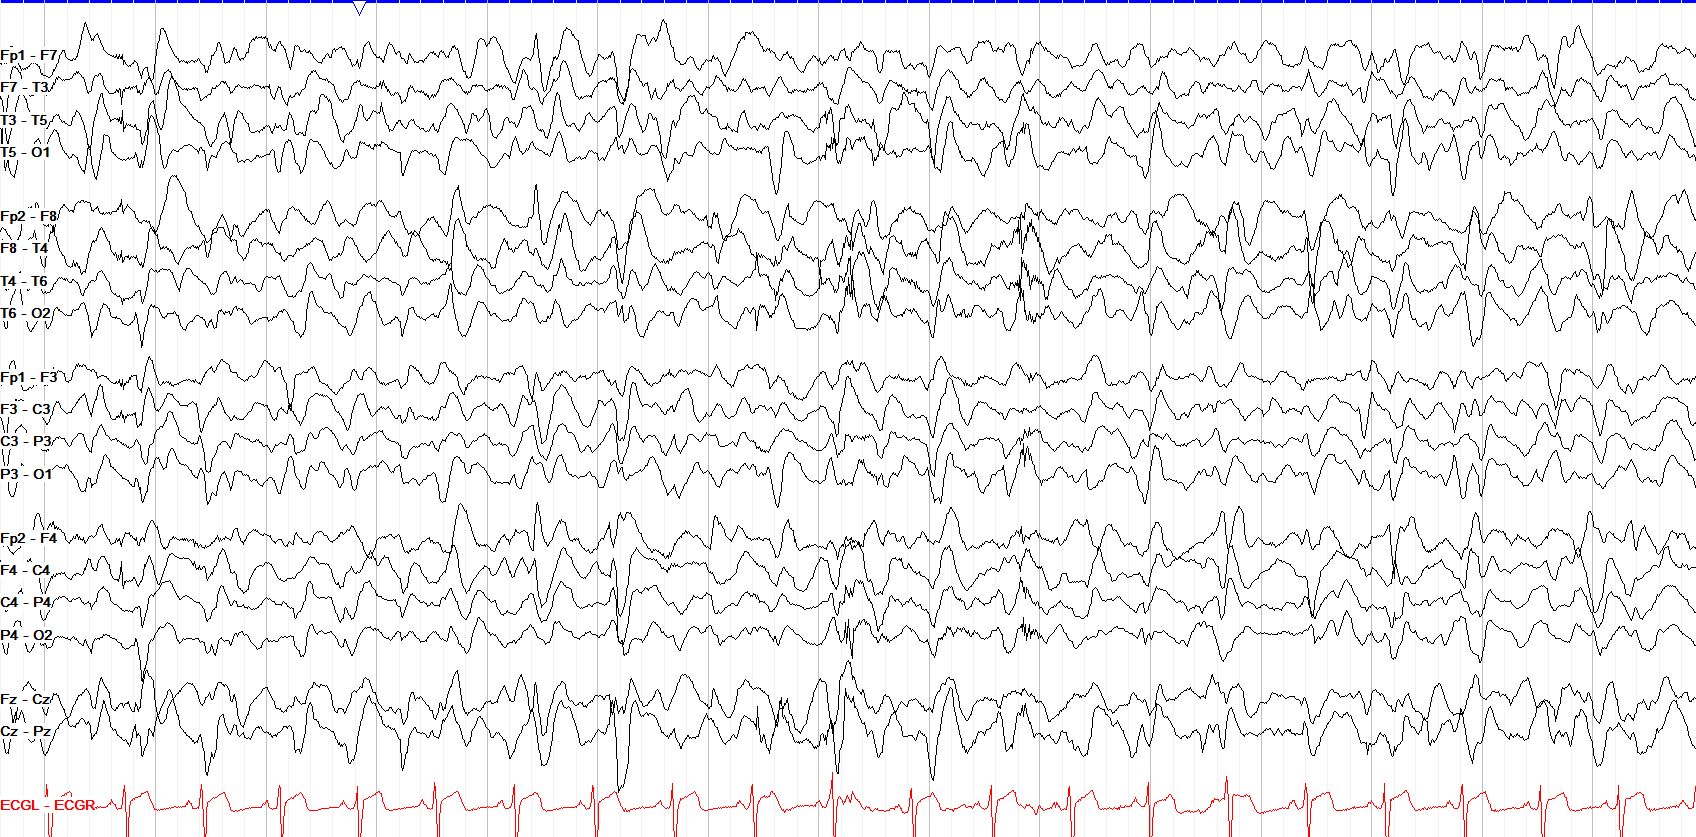
Lennox Gastaut Syndrome (LGS) is marked by a very disorganized and slow background with diffuse and/or multifocal epileptiform discharges. Classically, you can see runs of 2.5-3Hz discharges.
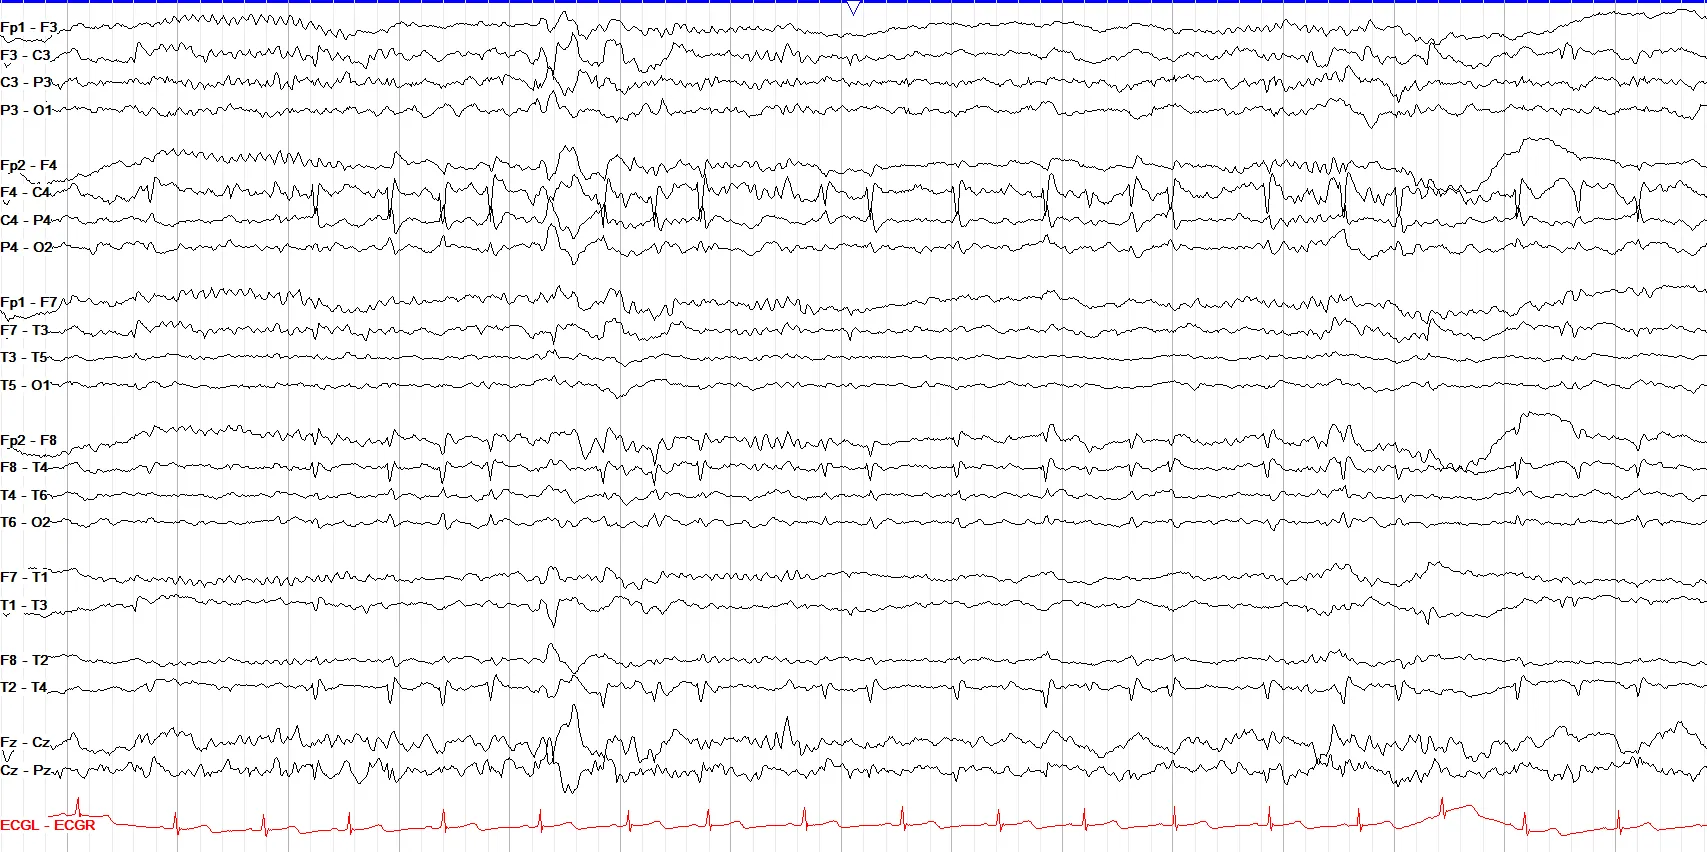
Self-limited epilepsy with centrotemporal spikes (SeLECTS; formerly benign rolandic epilepsy with centrotemporal spikes, or BECTS) is a well named syndrome that usually resolves on its own by the teenage years, marked by centrotemporal spikes (bilateral or unilateral) with nocturnal seizures that start with hemifacial spasms but can progress into GTCs.
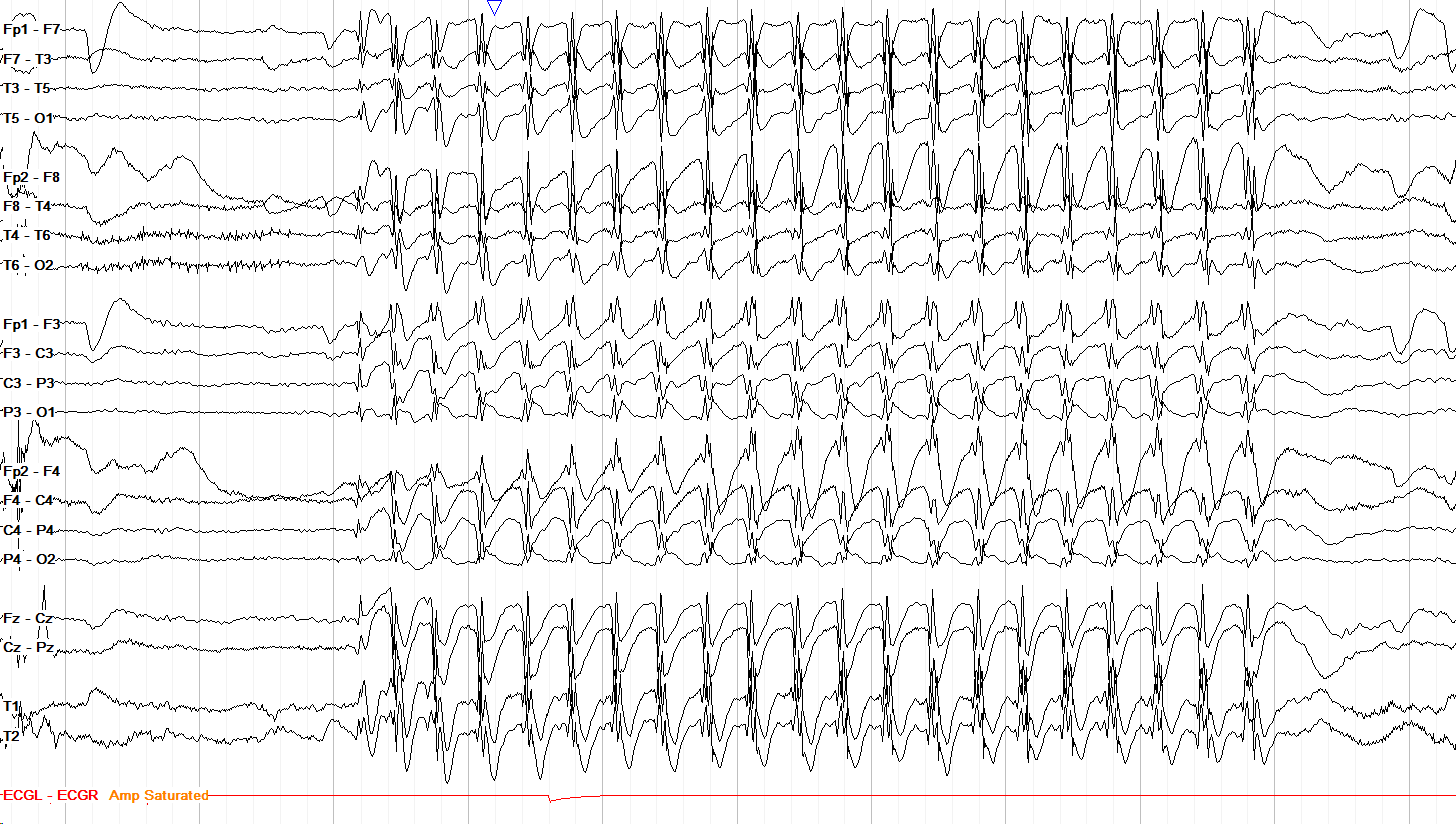
Absence epilepsy is marked by absence seizures of ~3 Hz (classically 2.5–4 Hz) generalized spike/polyspike wave complexes, which are usually brief and rapid in onset and offset. It is important to recognize this distinct pattern because absence epilepsy is the only type of epilepsy treated with ethosuximide.
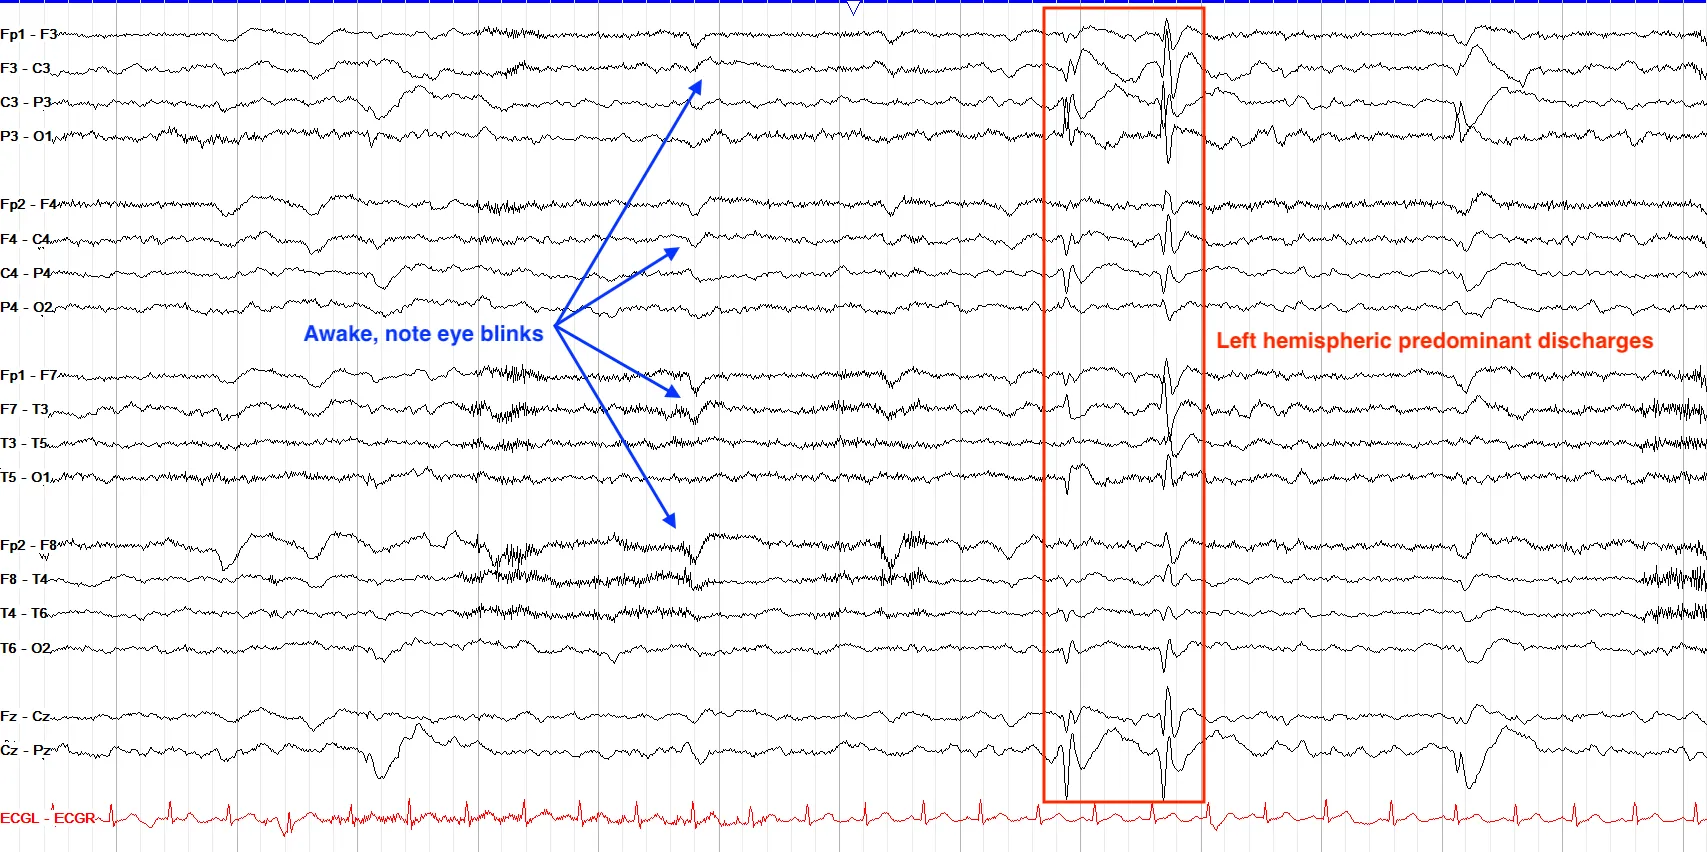
ESES occurs when baseline epileptiform discharges are greatly activated by sleep to be present over 85% of the sleeping record. It can lead to developmental regression, such as with Landau Kleffner Syndrome. Here the first page is awake, with a rare discharge, and the second page is asleep, with continuous discharges.
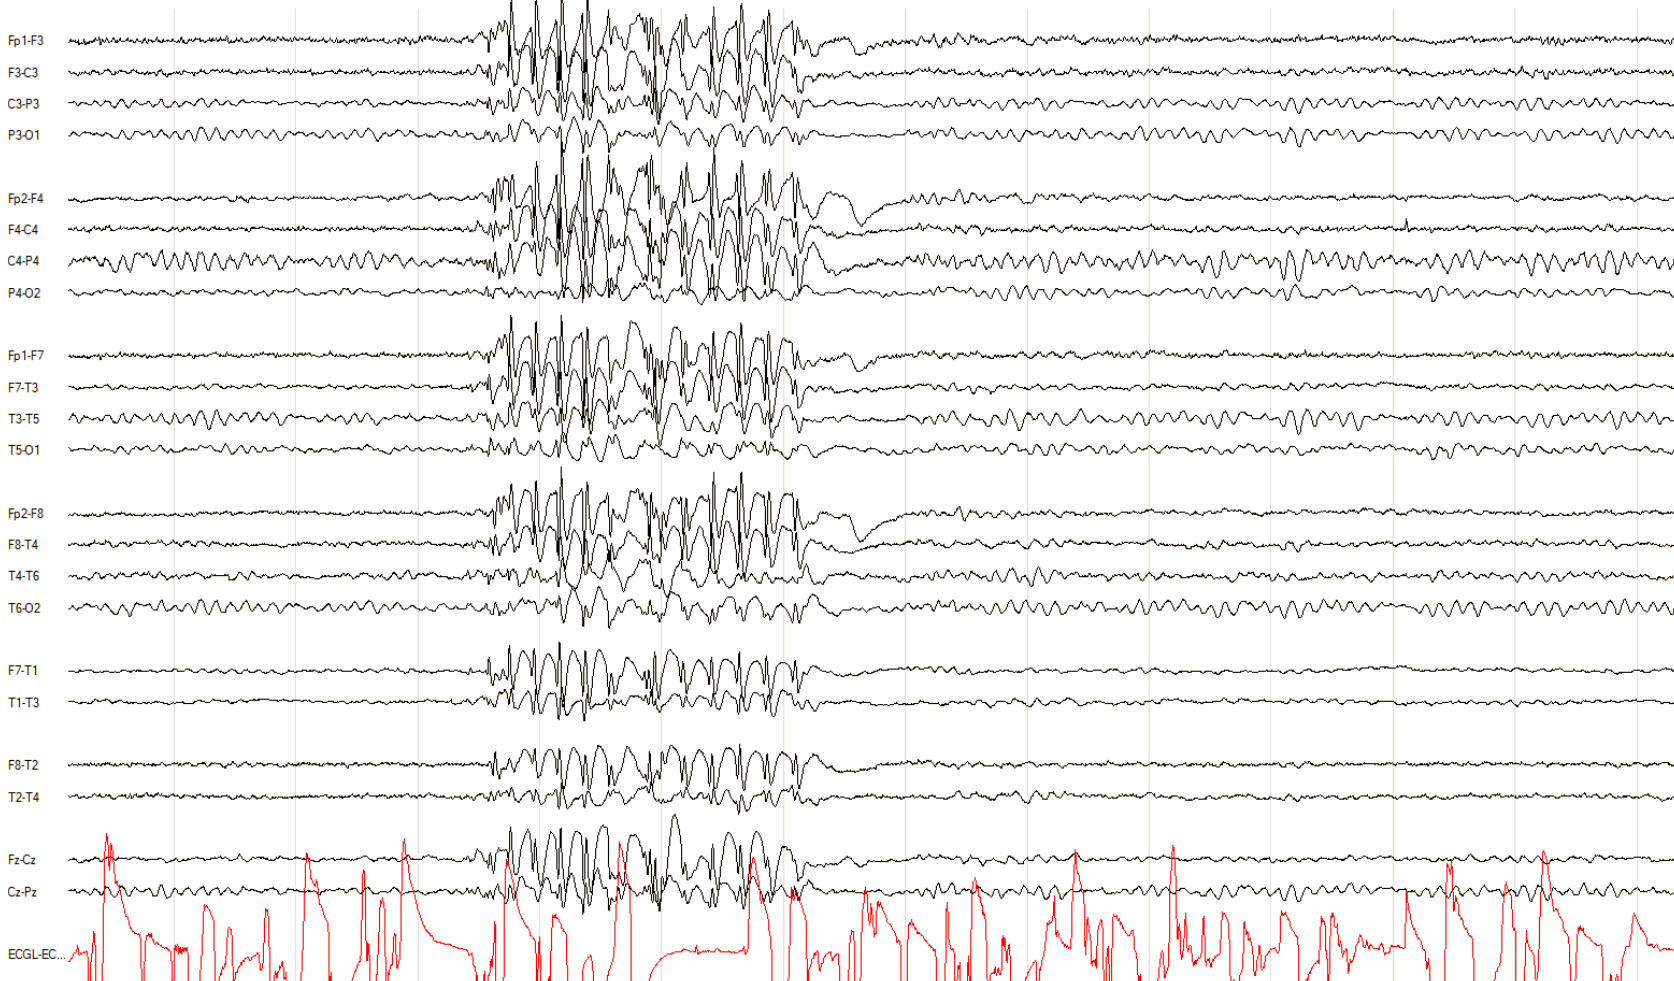
Juvenile myoclonic epilepsy (JME) arises in adolescence with typically morning-predominant myoclonic jerks and classic 4-6 Hz generalized spike or polyspike and slow wave discharges.
generalized slowing
7 patterns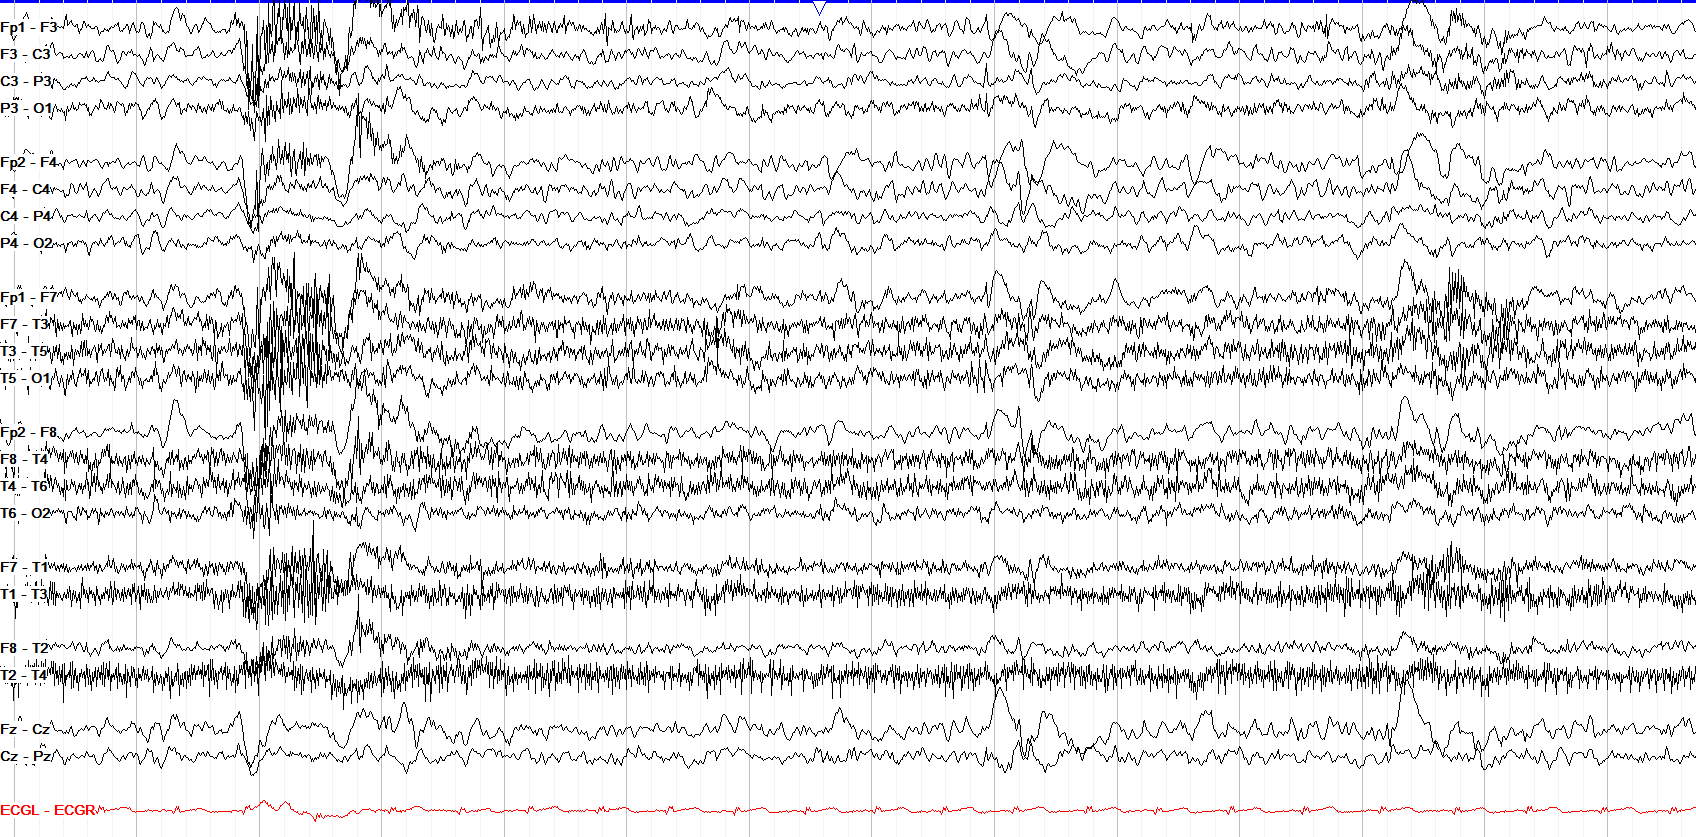
Mild generalized slowing is marked by the presence of most of the normal architecture, but a slowed PDR and suboptimal AP gradient. It is commonly seen in encephalopathy patients.
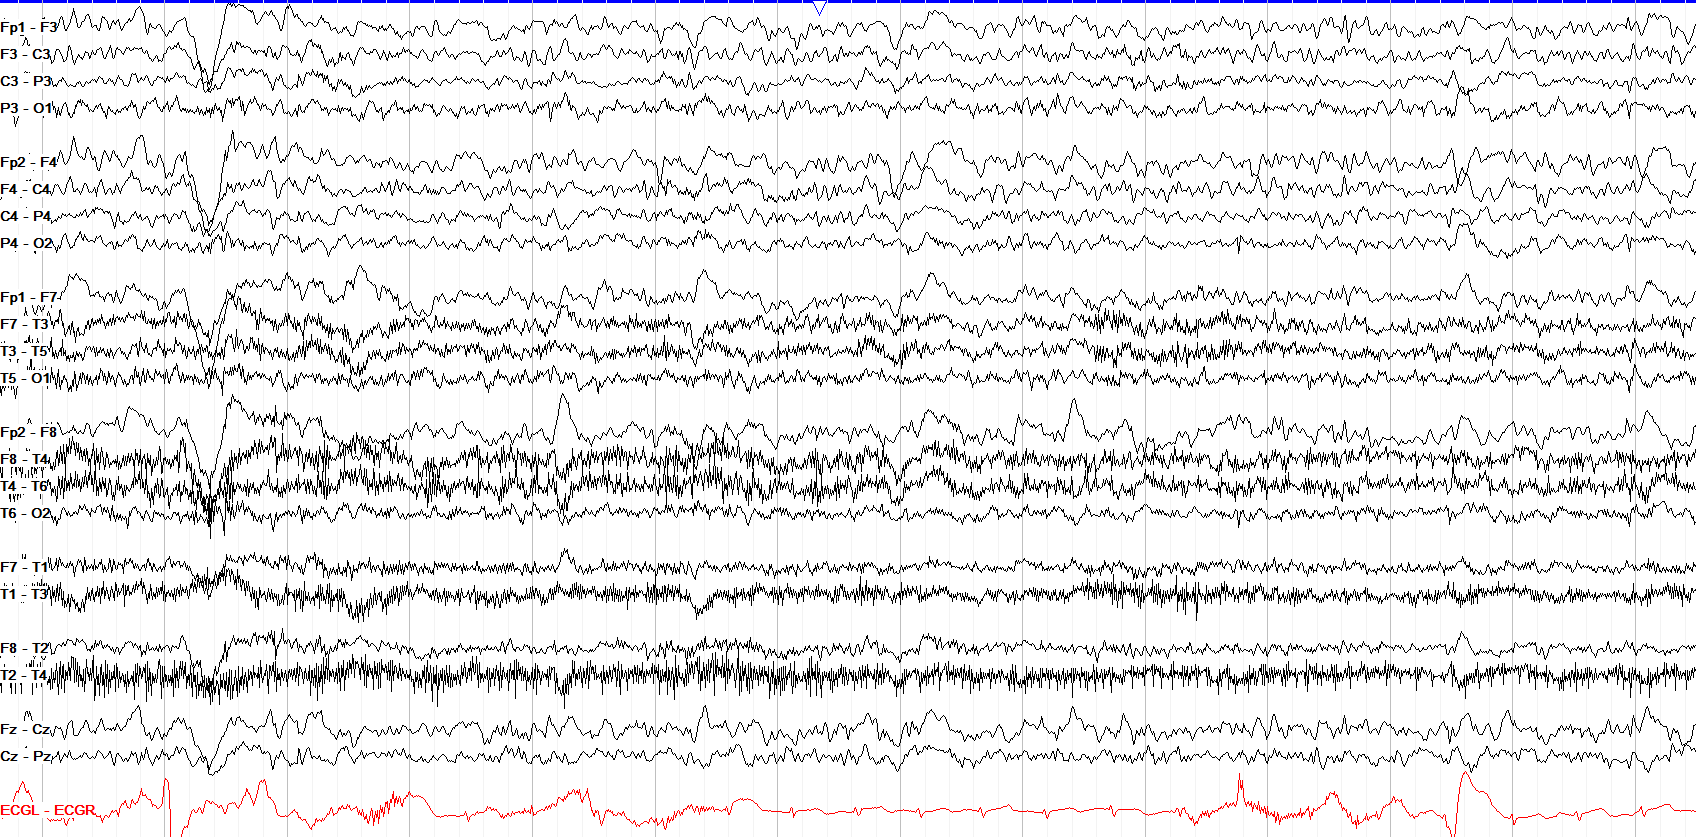
With mild generalized slowing, you should see a lot of the usual artifacts of the awake state that reveal reactivity, including eye blinks.
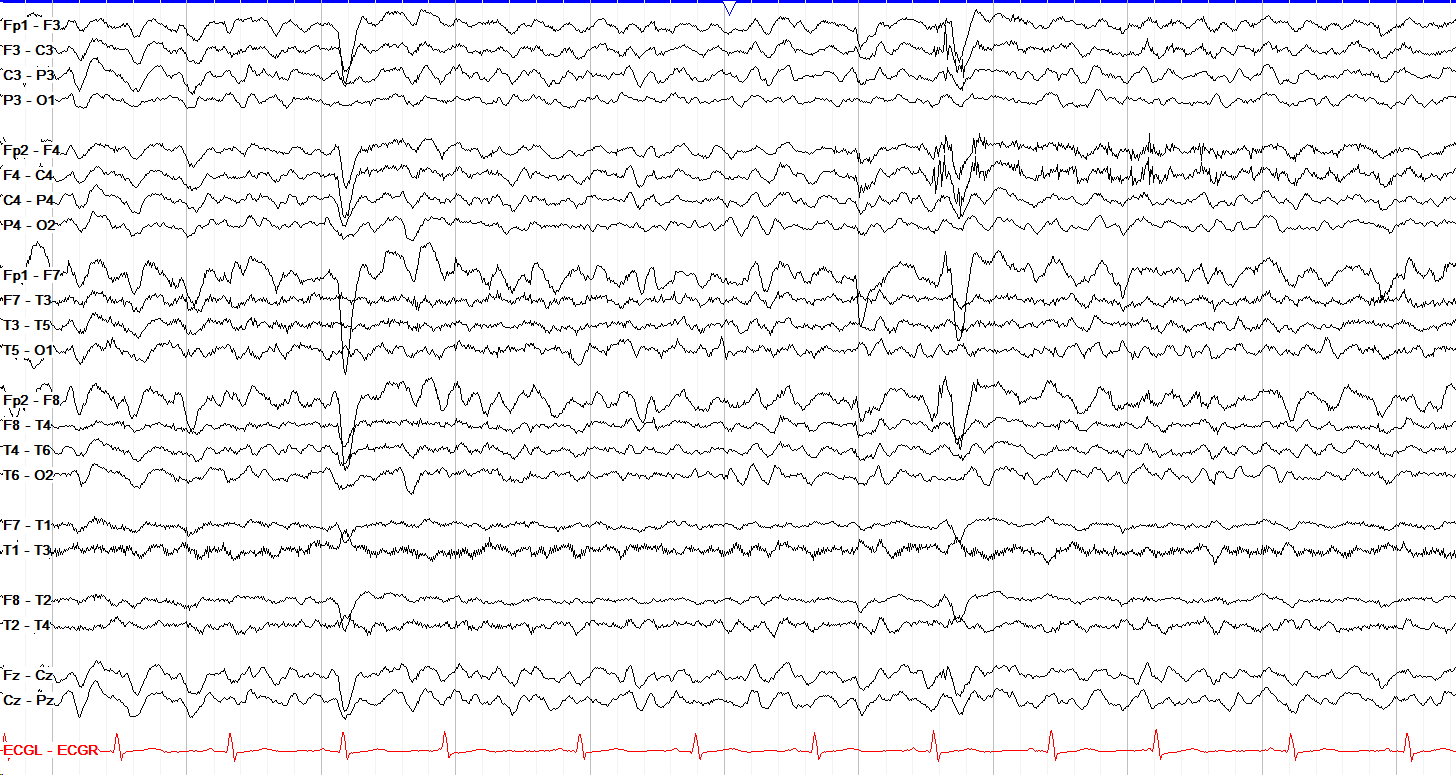
Moderate generalized slowing usually lacks a PDR, or has only a fragmented PDR, with no AP gradient and usually dominant theta activity instead of the normal alpha.
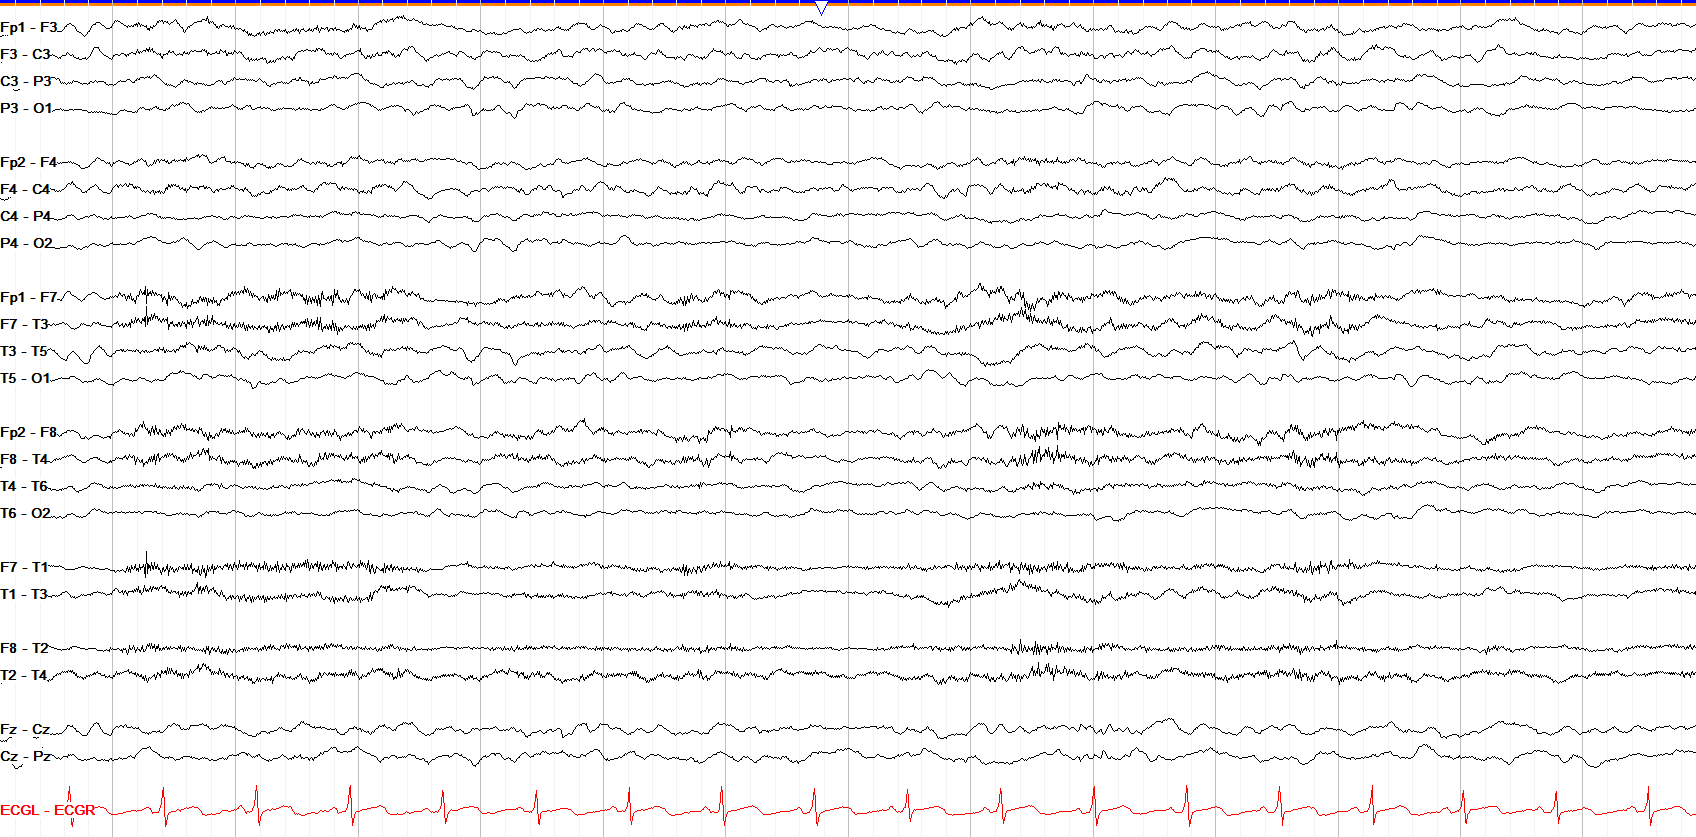
The delineation from mild to moderate or moderate to severe can be subjective, but moderate gen slowing should still show state changes while severe gen slowing does not, and lacks the PDR that mild gen slowing should retain.
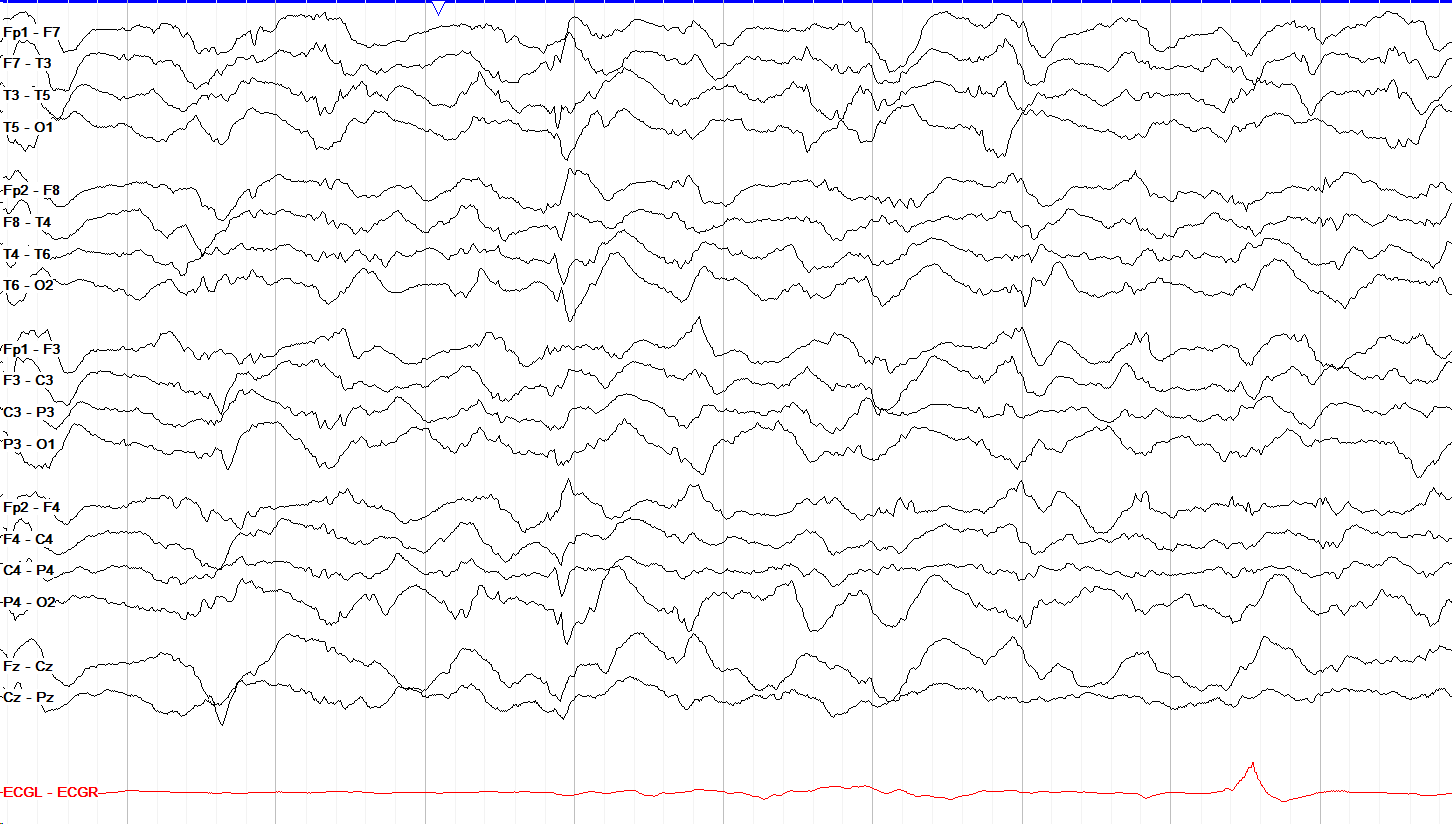
Severe generalized slowing is marked by lack of any normal architecture, poor to absent reactivity, discontinuity, and often low amplitude diffuse delta activity.
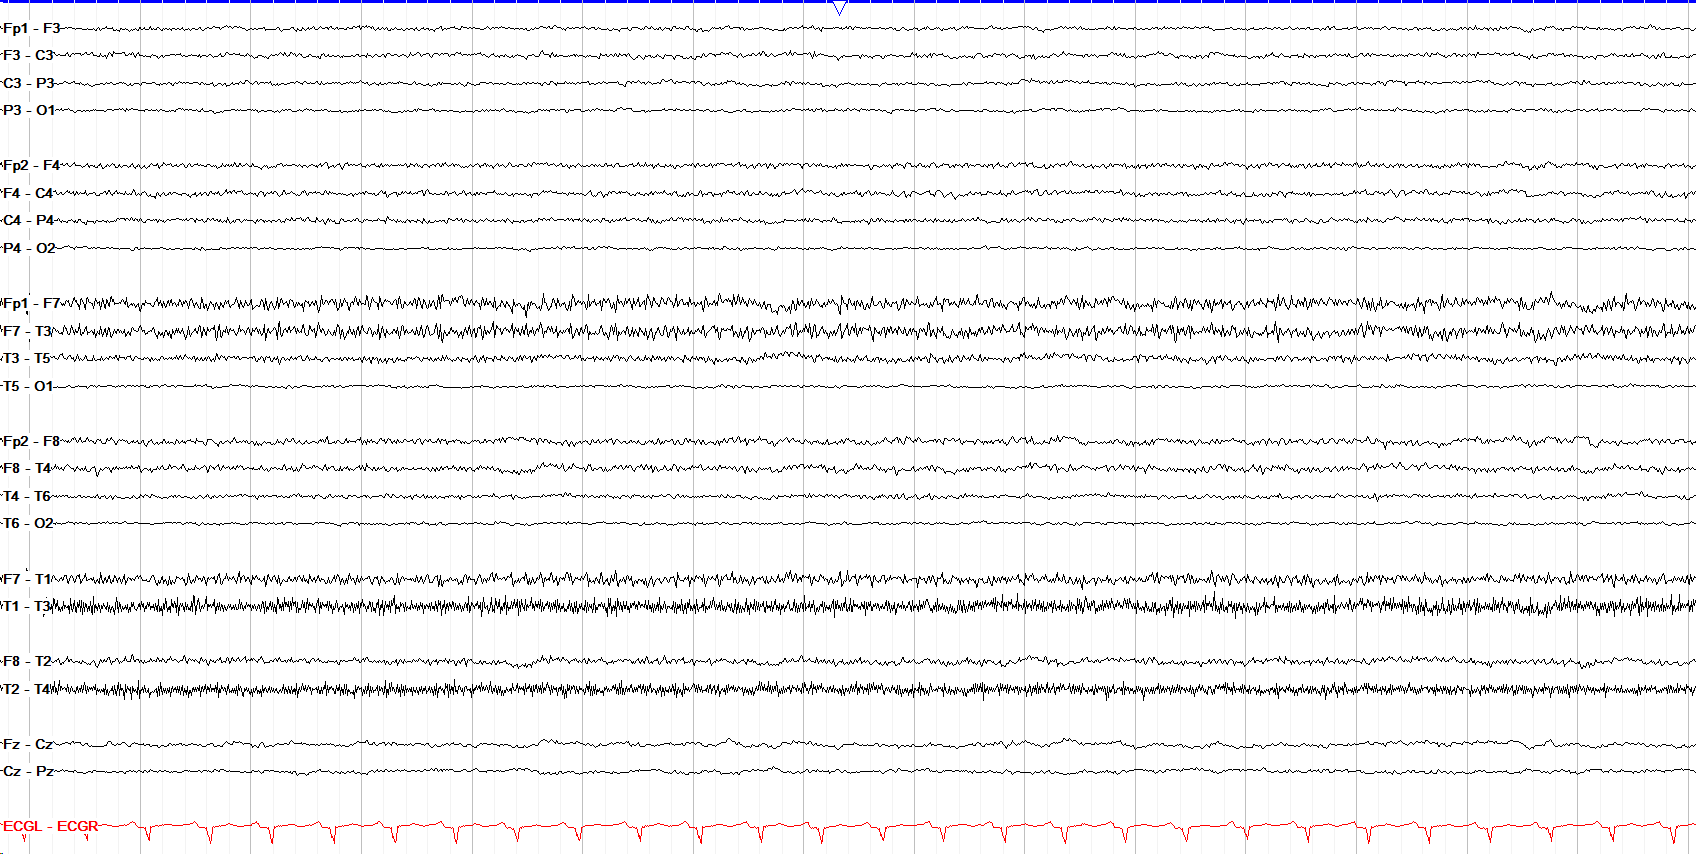
Here we see an example of severe gen slowing that is essentially invariant, unreactive, and very low amplitude.
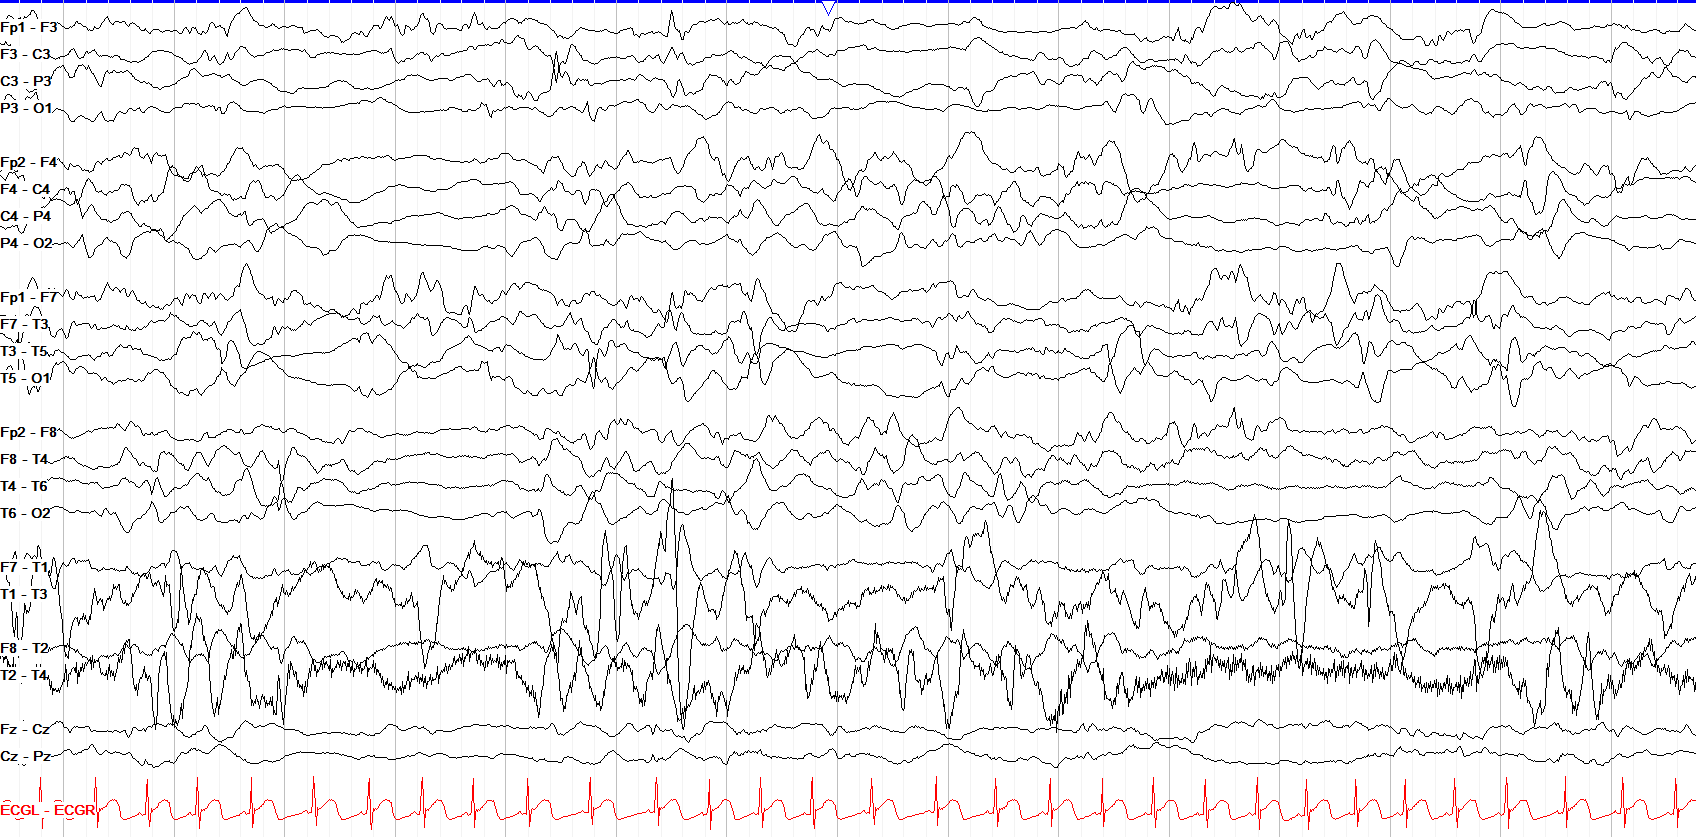
This is a complex and highly abnormal tracing. We see severe generalized slowing with no PDR or AP gradient, bilateral and asymmetric discontinuity, and multifocal epileptiform discharges. This is actually consistent with hypsarrhythmia, discussed in the epilepsy syndromes section.
focal slowing
7 patterns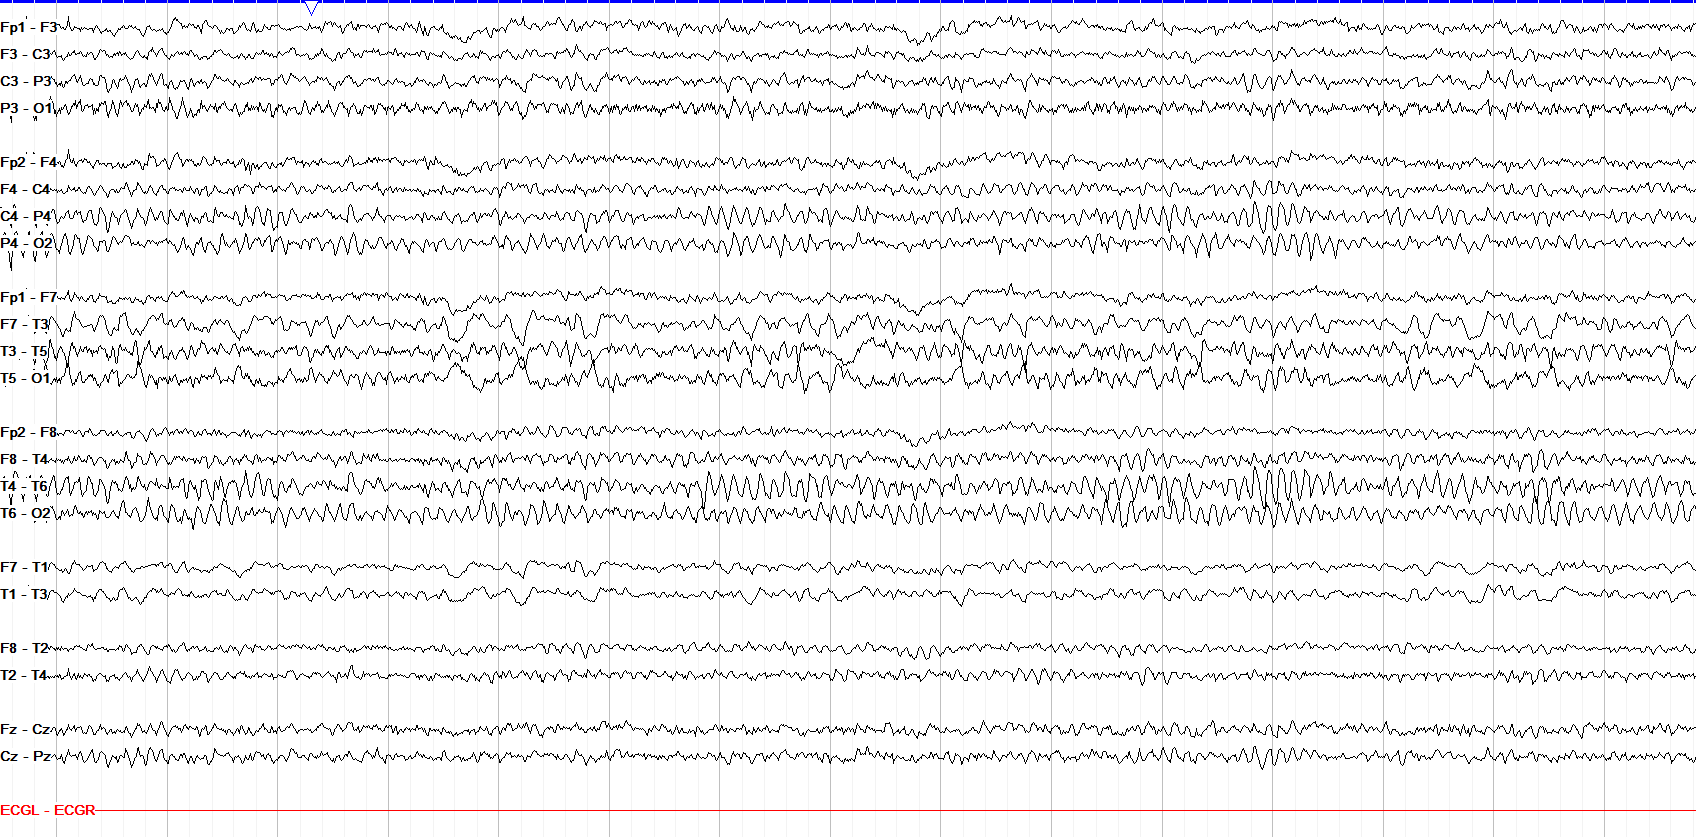
Persistent focal polymorphic slowing suggests nonspecific underlying dysfunction as can be seen from a tumor, stroke, bleed or other parenchymal injury. Here we see persistent slowing over the left hemisphere, maximal temporally.
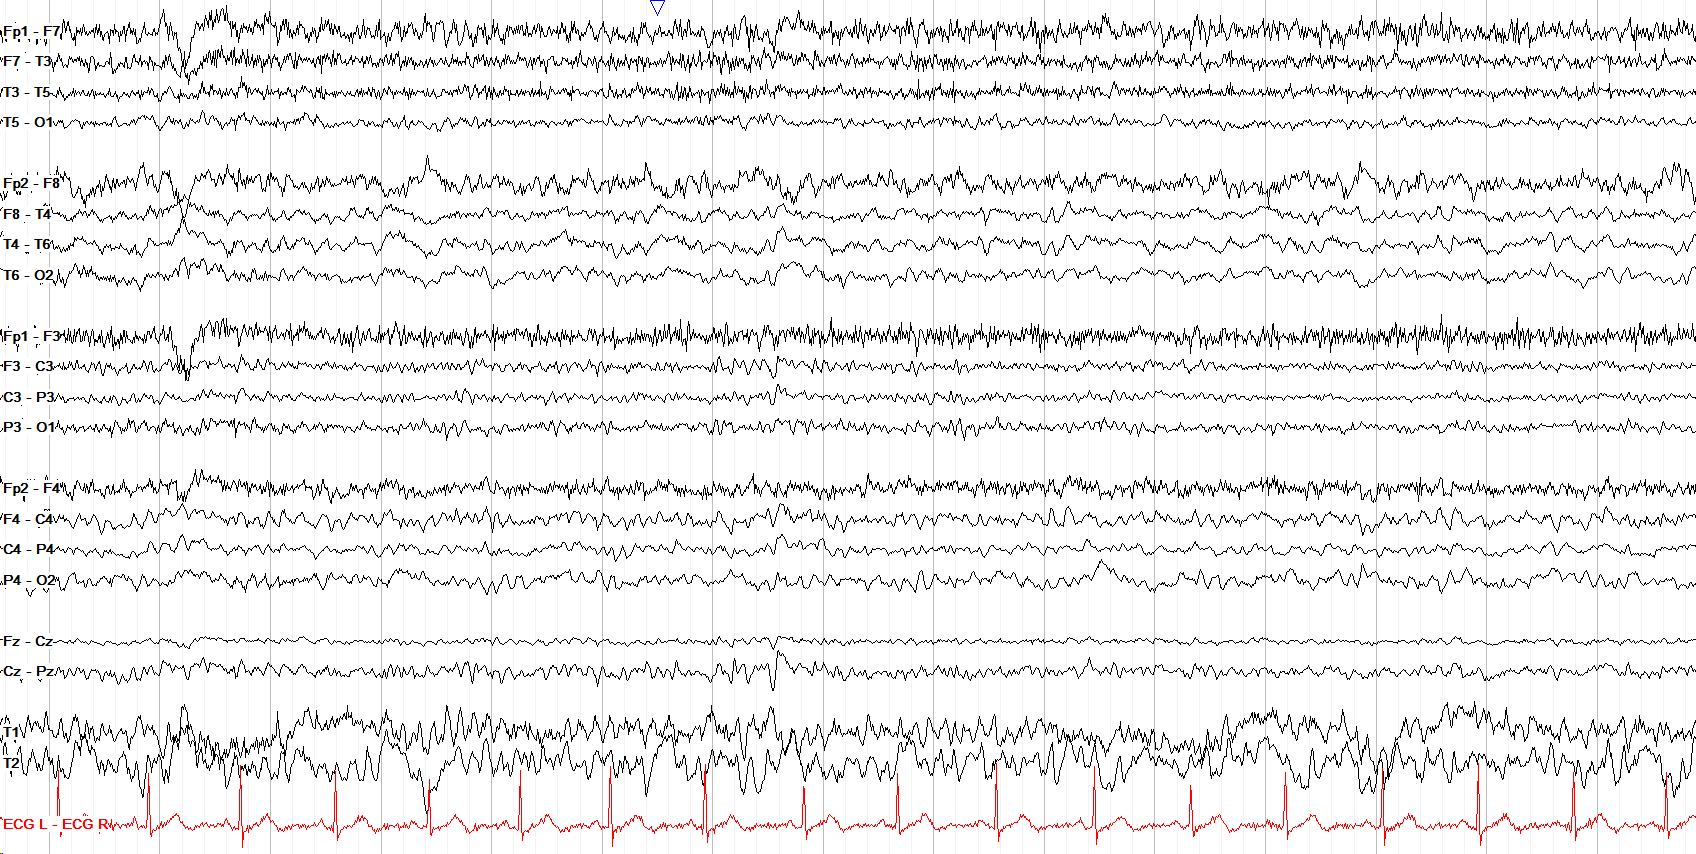
Continuous polymorphic delta slowing over the right hemisphere, maximal in the temporal and posterior regions. As with other persistent focal polymorphic slowing, it implicates an underlying structural process but is nonspecific as to the exact cause.
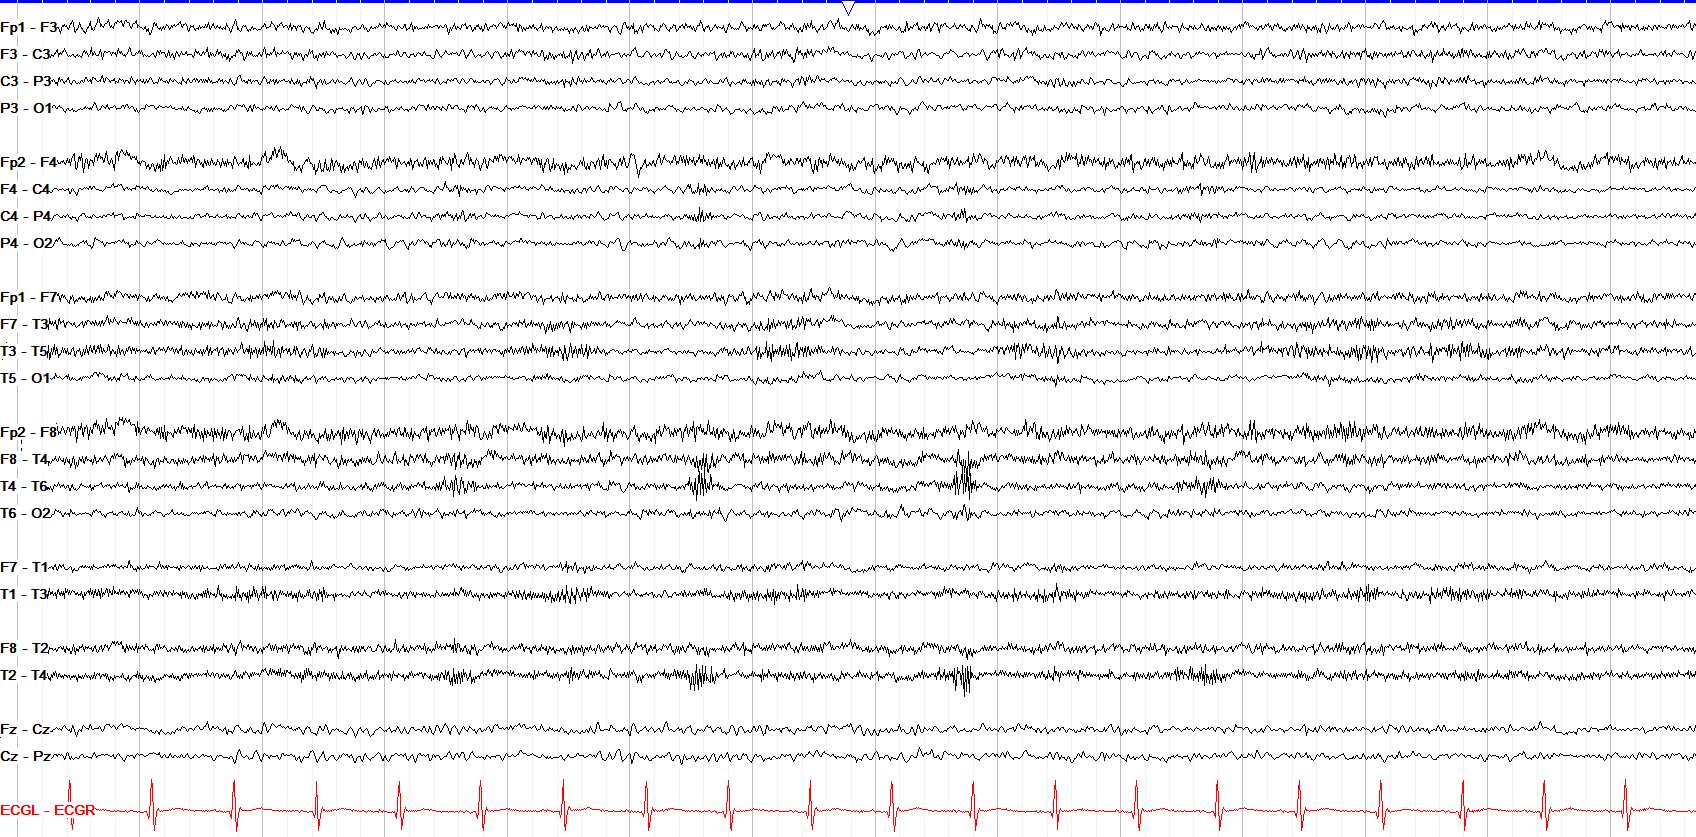
This continuous right anterior quadrant (the anterior temporal and frontal regions) polymorphic delta slowing may seem subtle at first but note how similar delta activity is not over the left frontal regions. When slowing is subtle it can help to look at it from farther away, to better see the gestalt.
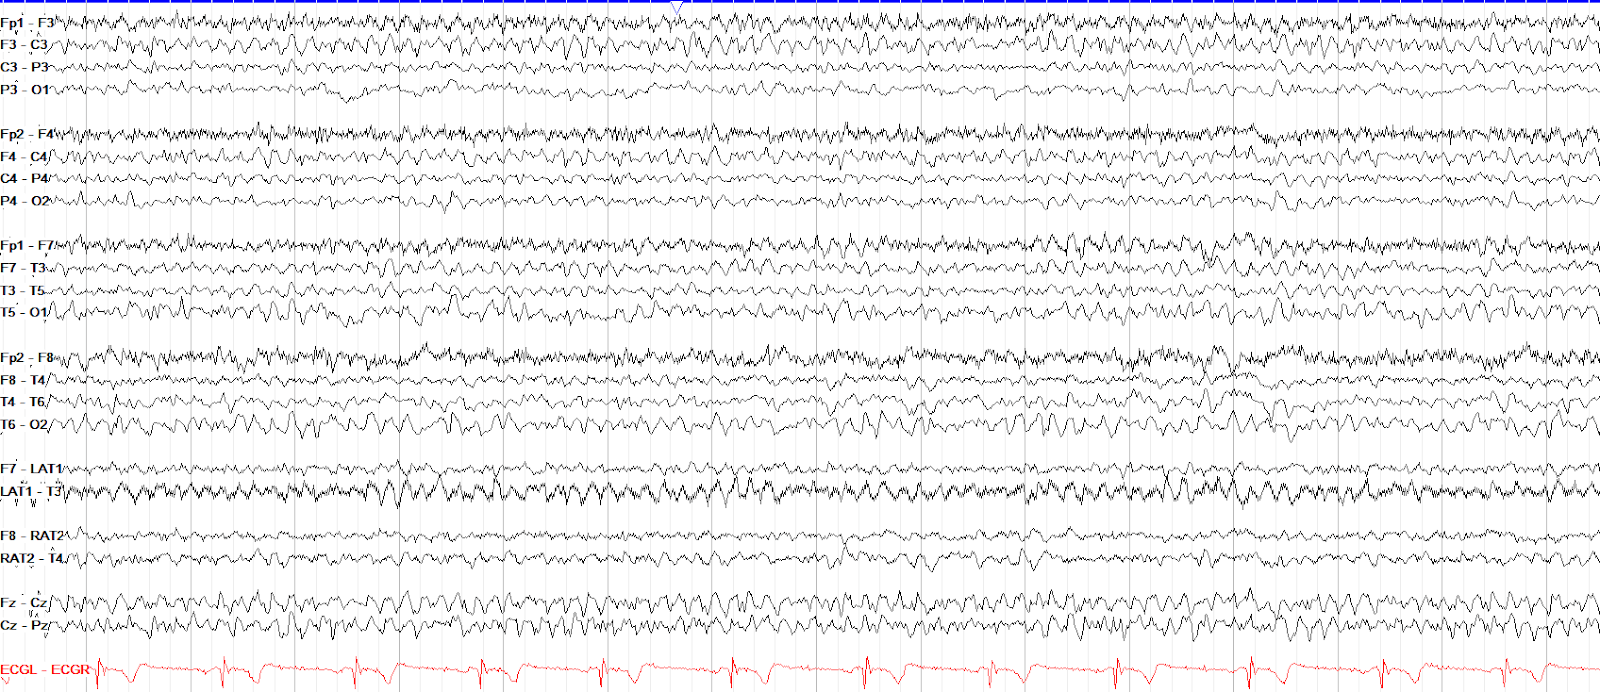
Be sure to always look at the entirety of the tracing. Here, you may be distracted by the relatively symmetric posterior portion of the right temporal chain and overriding generalized slowing, but don't miss the mid-temporal slowing as compared to the left temporal chain.
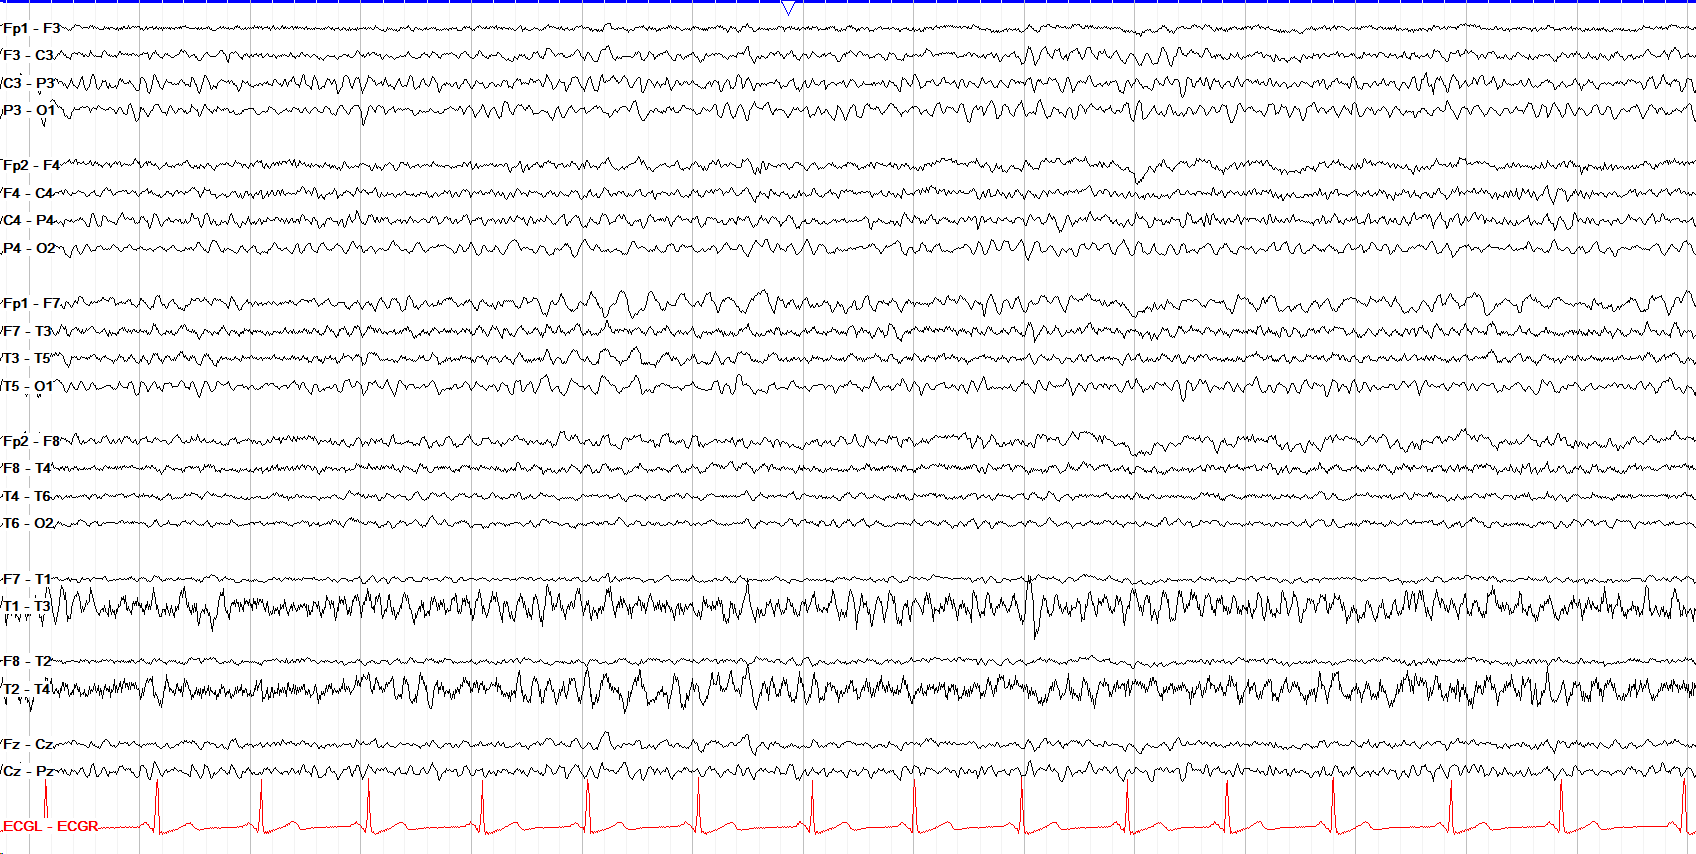
Here we see continuous albeit subtle theta to delta slowing over the left temporal chain, but there is also a more prominent period of polymorphic delta slowing broadly through the temporal region.
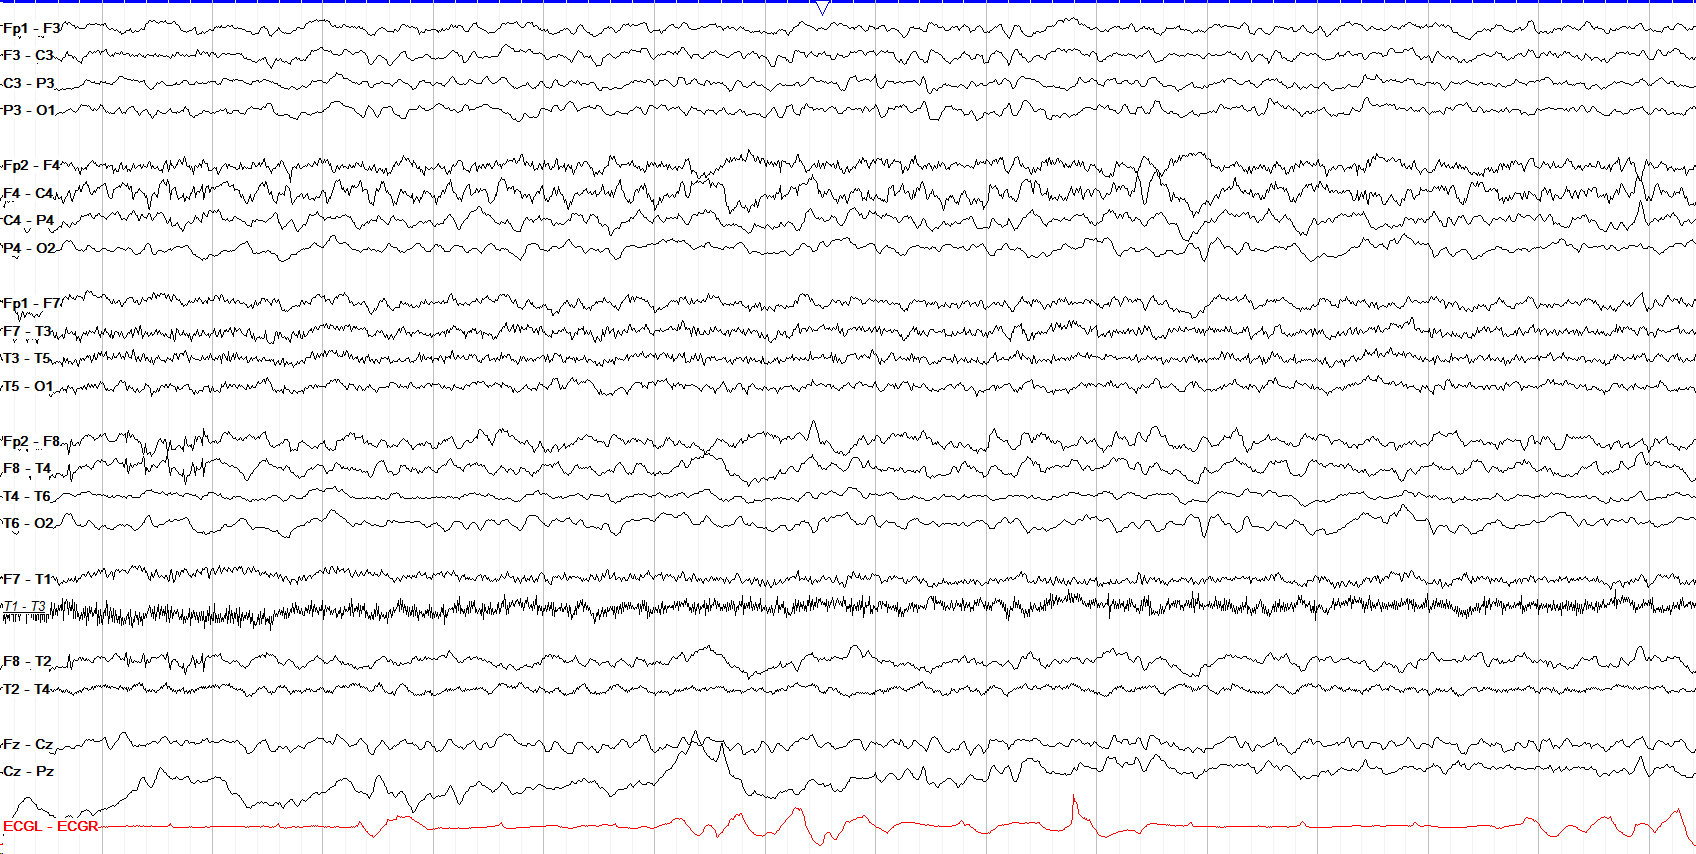
The entire right hemisphere is slowed in this example, but if you look closely the left anterior quadrant is also slightly slowed, although this is easily missed because you don't have a normal contralateral side to compare.
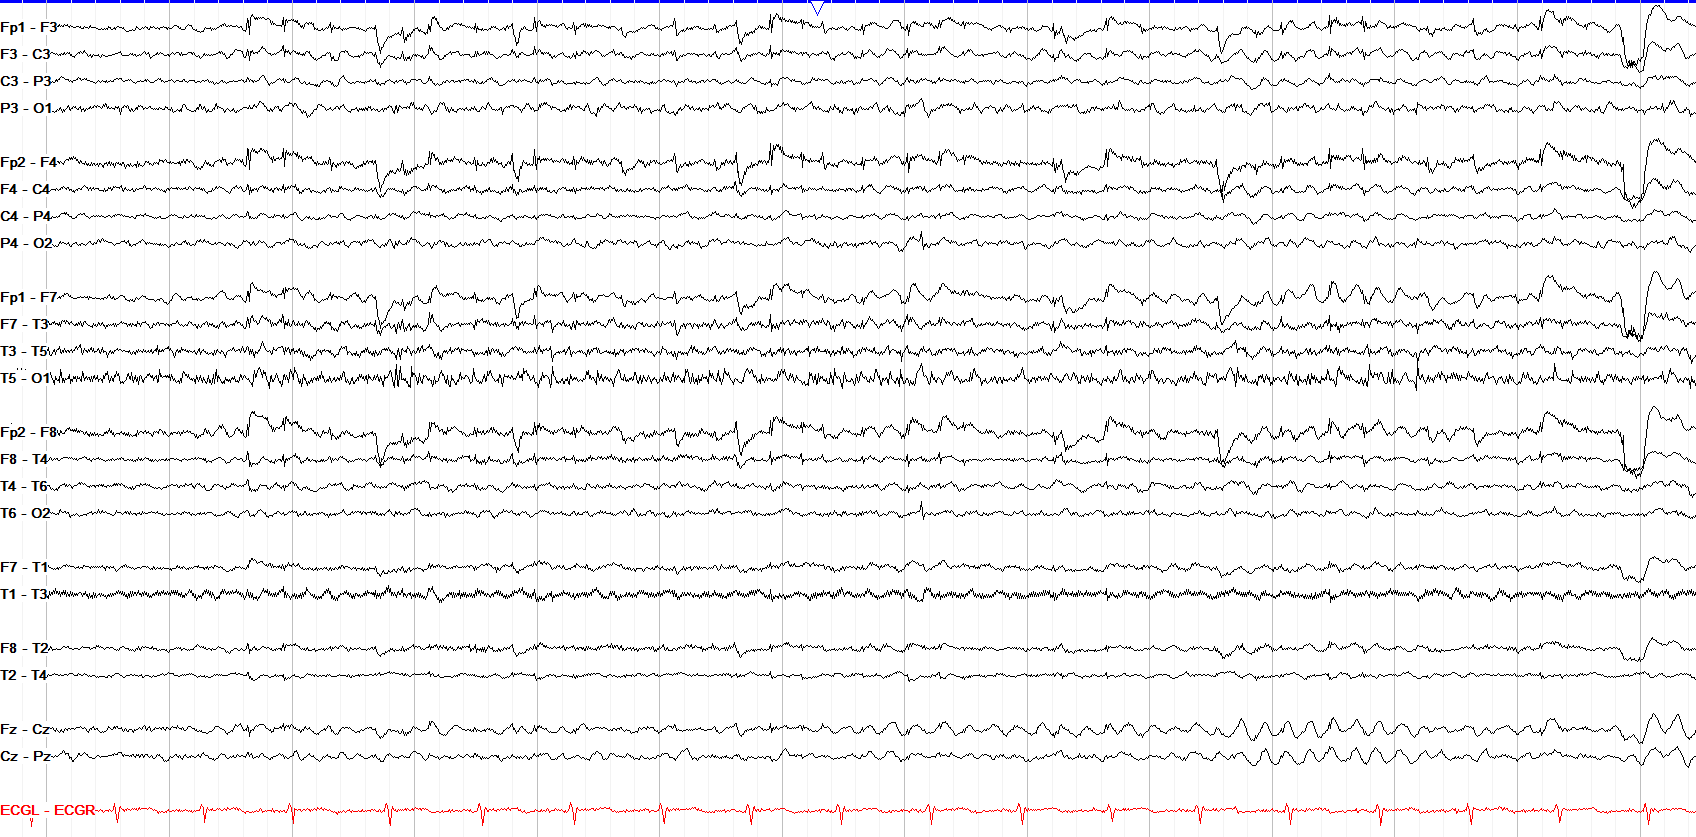
Again we see bilateral frontal slowing here, which can make it hard to initially pick up because there isn't a clear asymmetry to which the eye is drawn. Just remember that the frontal leads should be predominantly fast activity such as beta and alpha; here, we see too much frontal theta.
attenuation & discontinuity
3 patterns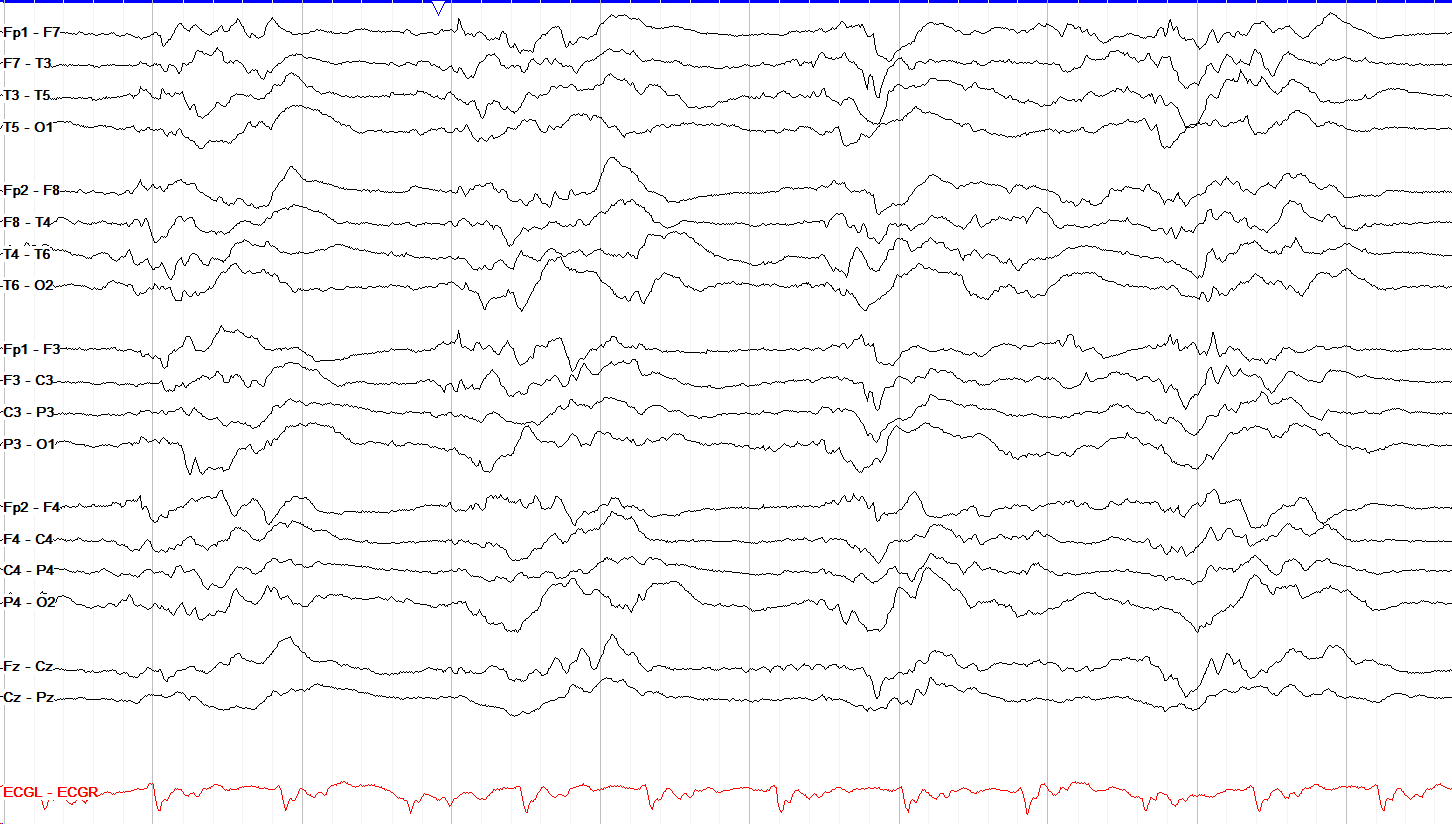
Discontinuity, or periods of attenuation in between periods of higher amplitude activity, is always abnormal after the neonatal period, and is a hallmark of severe generalized slowing.
This tracing is perhaps most notable for the fact that it is read at the standard sensitivity of 7uV/mm, but looks essentially flat. As such, this shows diffuse and very severe attenuation without much physiologic activity.
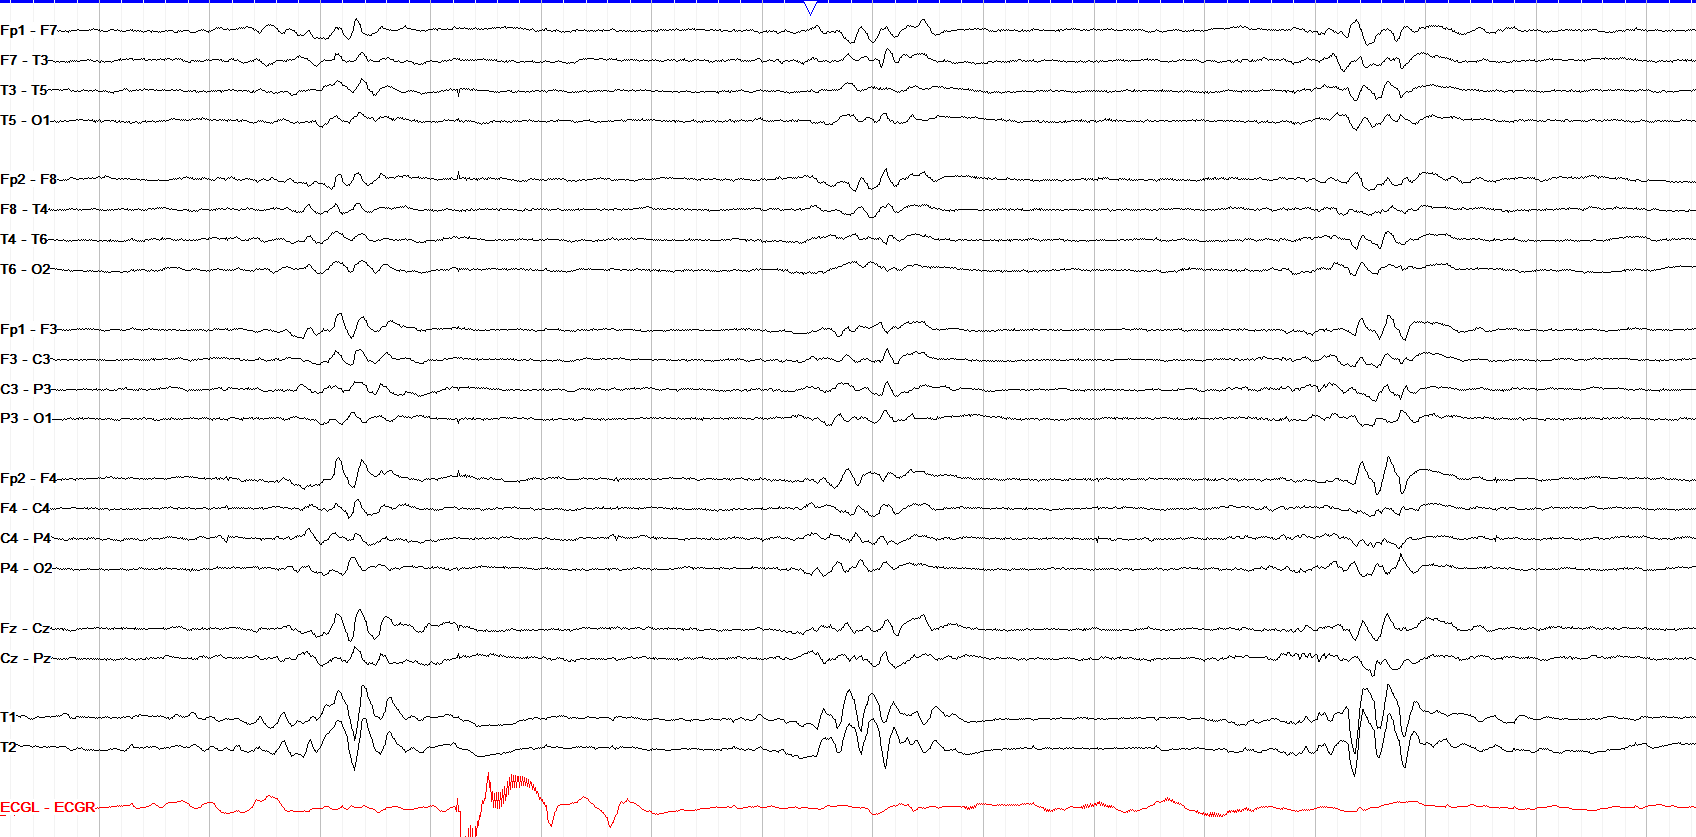
In cases of very refractory status epilepticus, it may be necessary to 'reboot' the brain via extreme sedation. In these cases, you use EEG to titrate that sedation to burst suppression, aka intentional discontinuity marked by bursts of activity in between essentially flat periods of attenuation. You may see this pattern non-intentionally in patients after severe cardiac ischemia or other causes of coma.
excess beta activity
3 patterns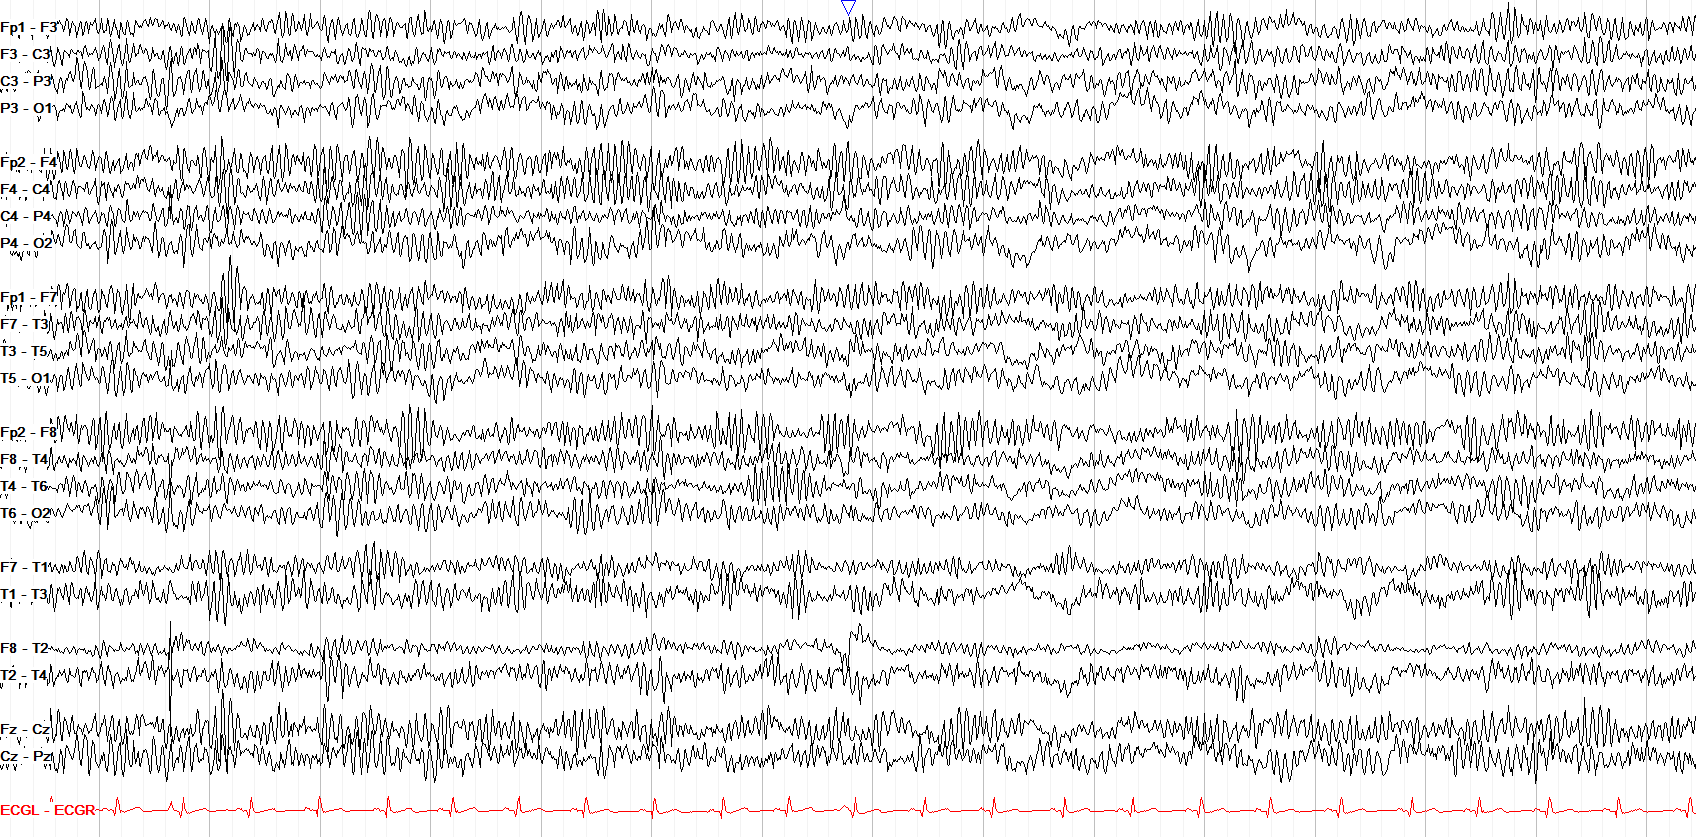
This tracing shows diffuse and very prominent excess beta activity, captured shortly after administration of high dose lorazepam to stop a prolonged seizure.
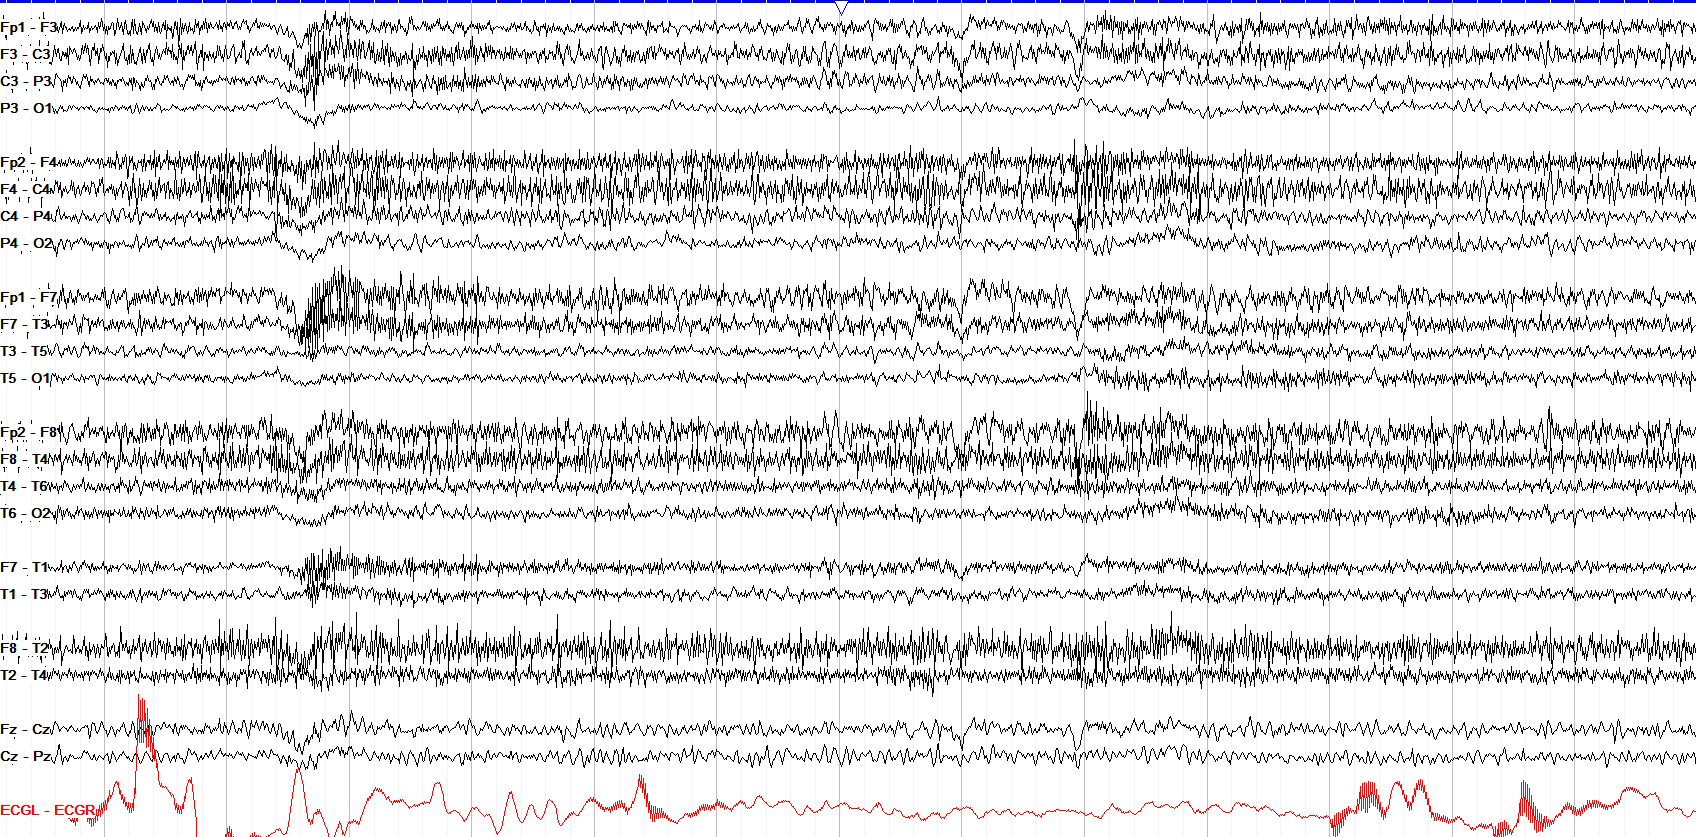
Again we see excess beta diffusely here, but in this tracing it is admixed with a lot of myogenic artifact, which is too fast to be cerebral in etiology from scalp EEG.
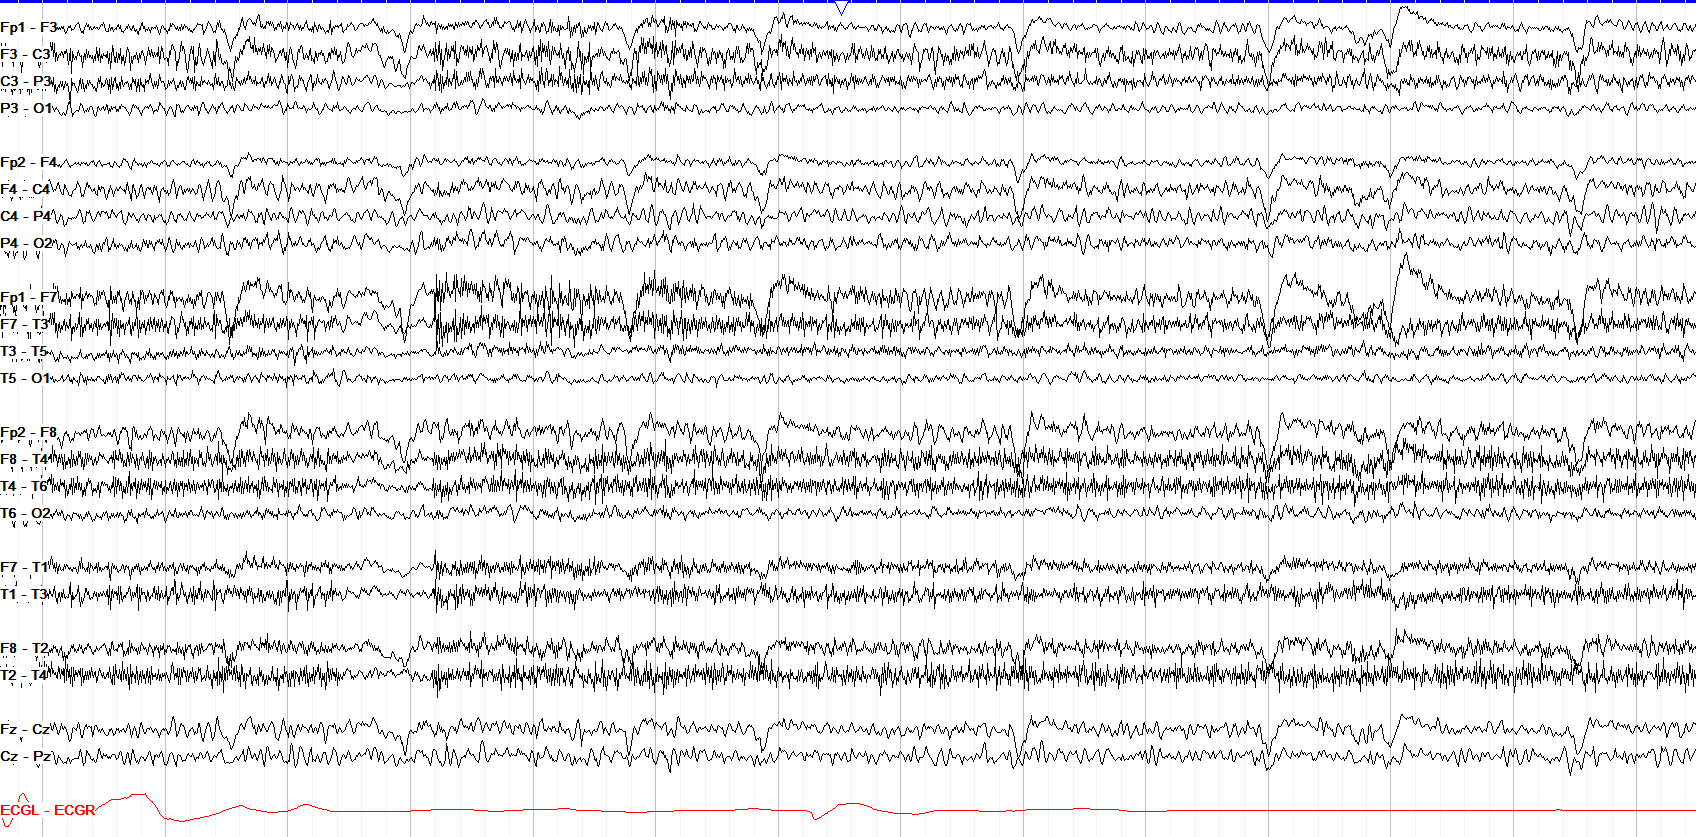
Compared to the prior example, this one shows a little less myogenic artifact and thus you can better see the fast activity admixed with the normal alpha and other activity underneath.
breach rhythm
4 patterns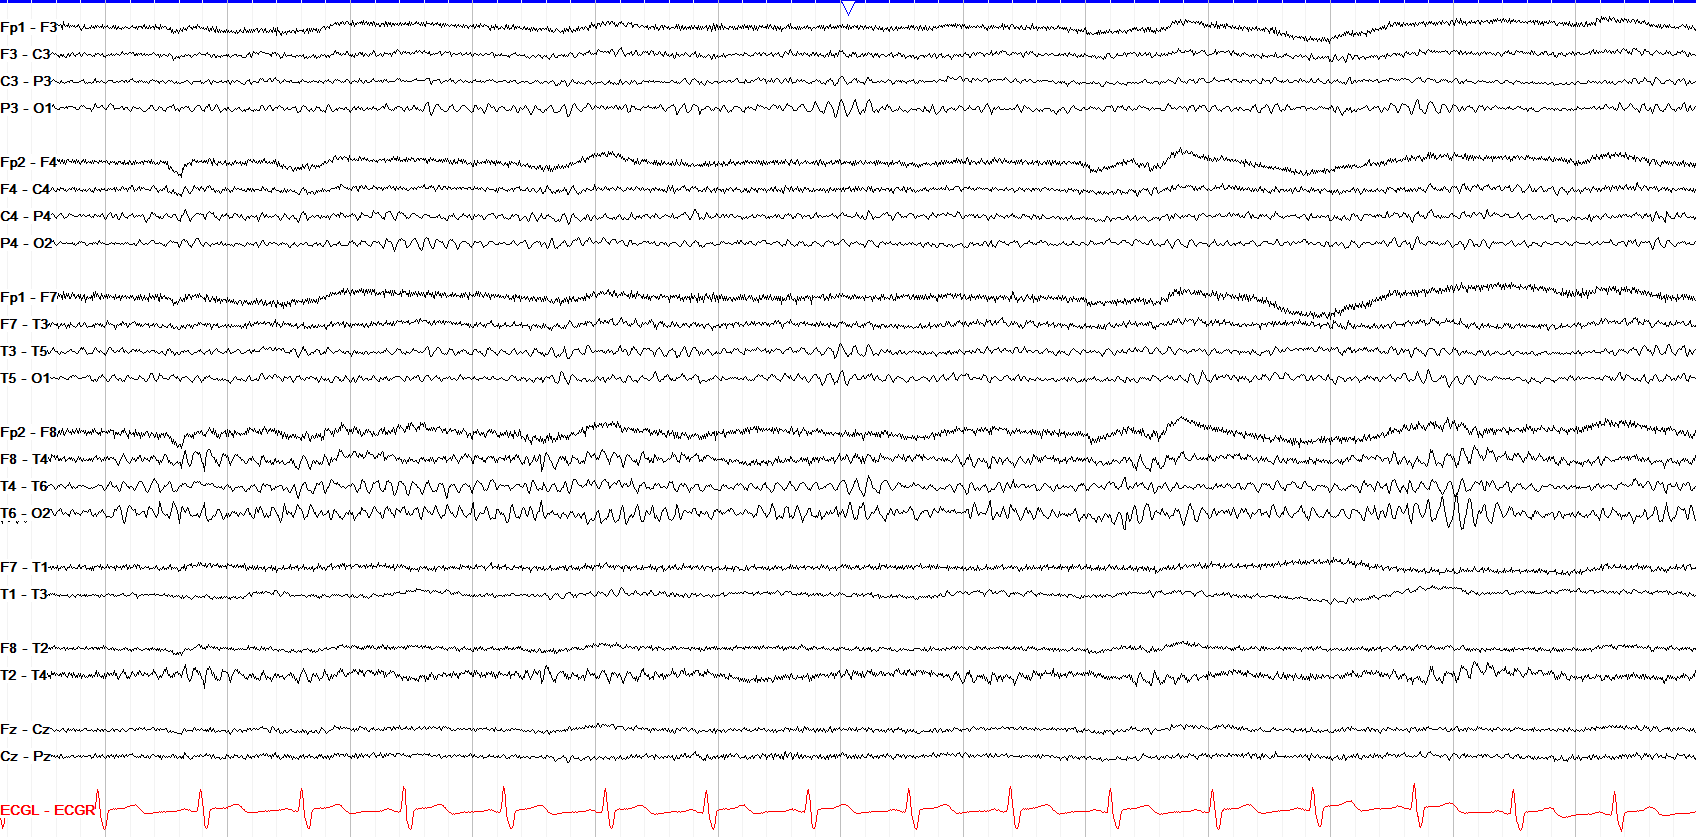
Breach activity is a sequelae of brain surgery, due to the residual skull defect. Breach is marked by sharper / spiky appearing waves that are often higher in amplitude than those in the non-breach areas. Underlying rhythms such as Mu or wickets are more apparently seen.
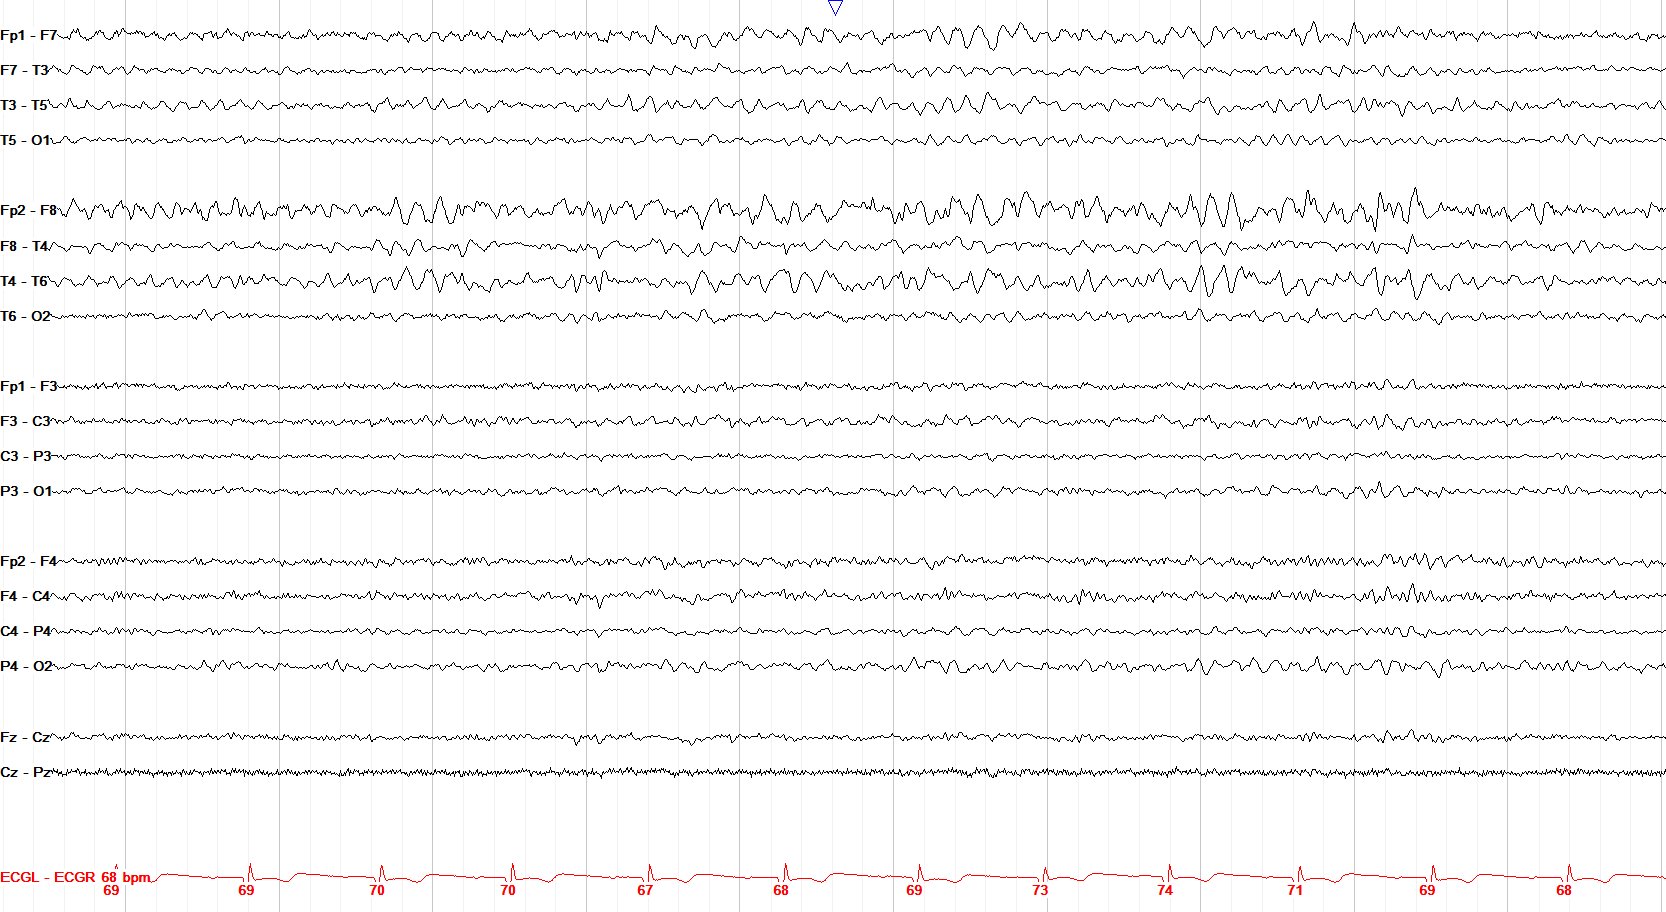
A cleaner example of right temporal breach: note the higher-amplitude, more sharply contoured activity over the right temporal chain compared with the intact left side. The sharpness reflects the skull defect and should not be mistaken for epileptiform discharges.
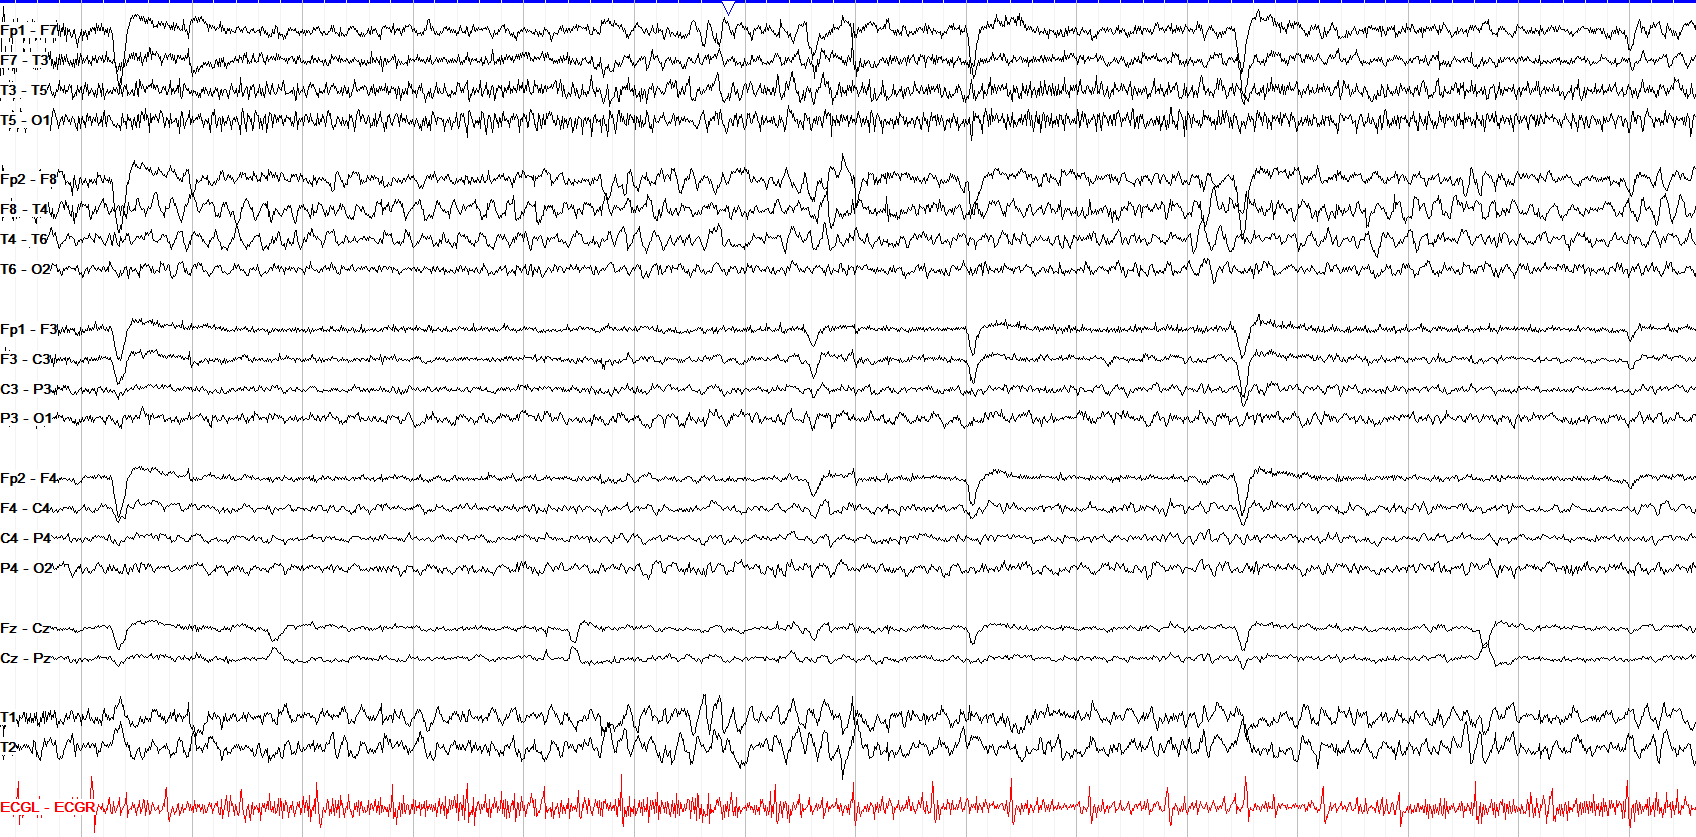
Breach and slowing don't have to go together, but often do simply because if you are getting a craniotomy, there's likely something wrong with the brain tissue underneath the area of that craniotomy.
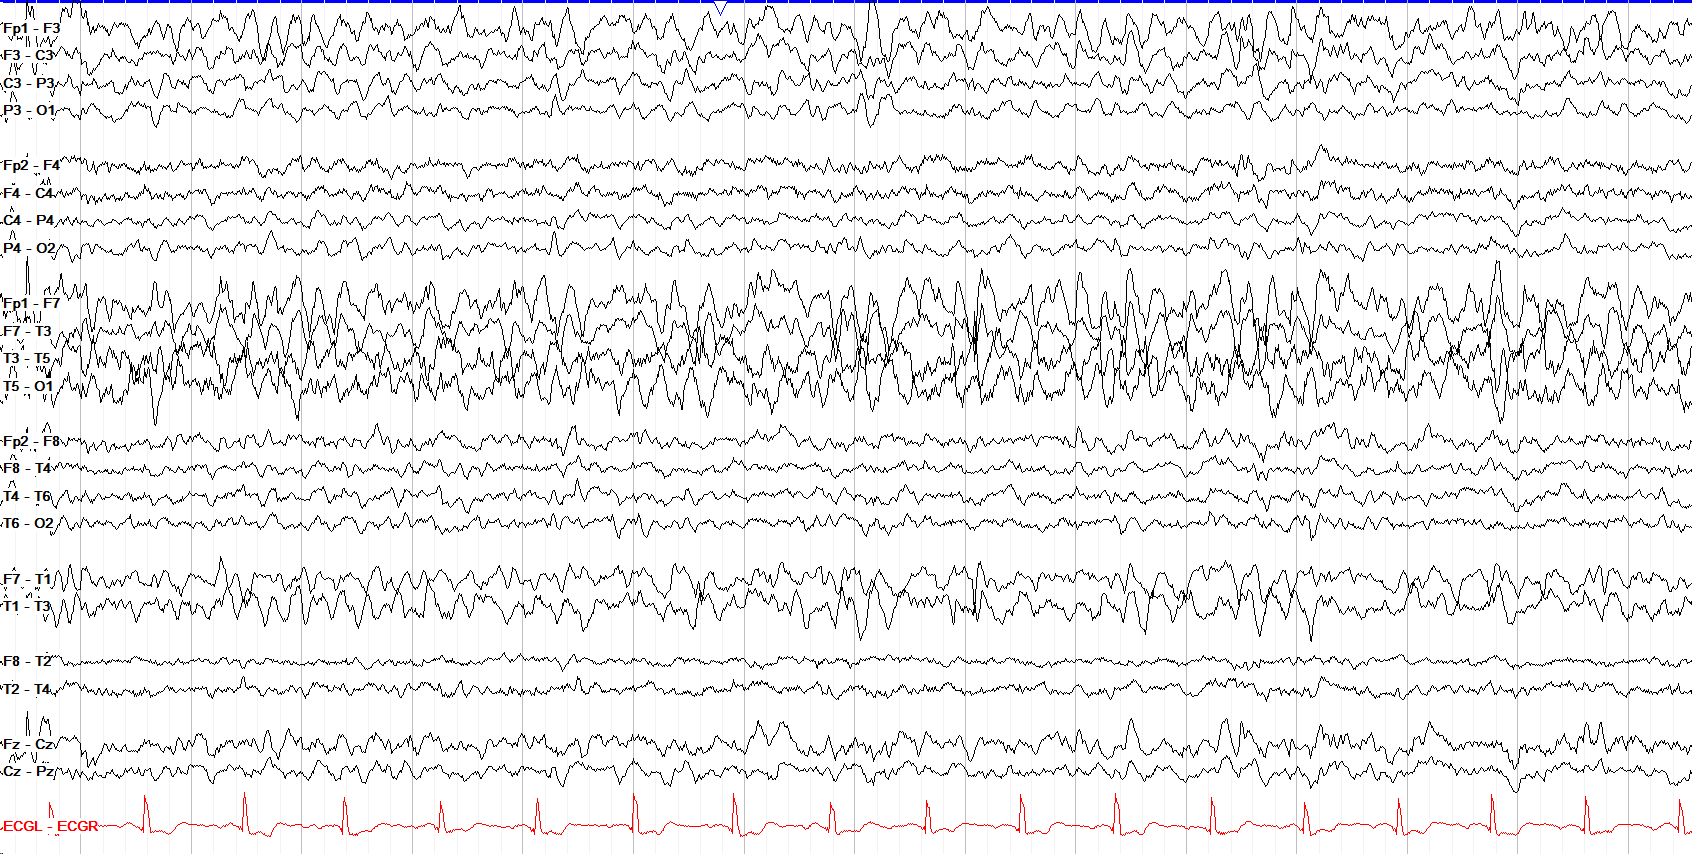
The region of breach depends on the region and size of the craniotomy that led to it; here we see it mostly over the temporal region, but there is some involvement of left parasagittal chain as well.
spikes & sharps
11 patterns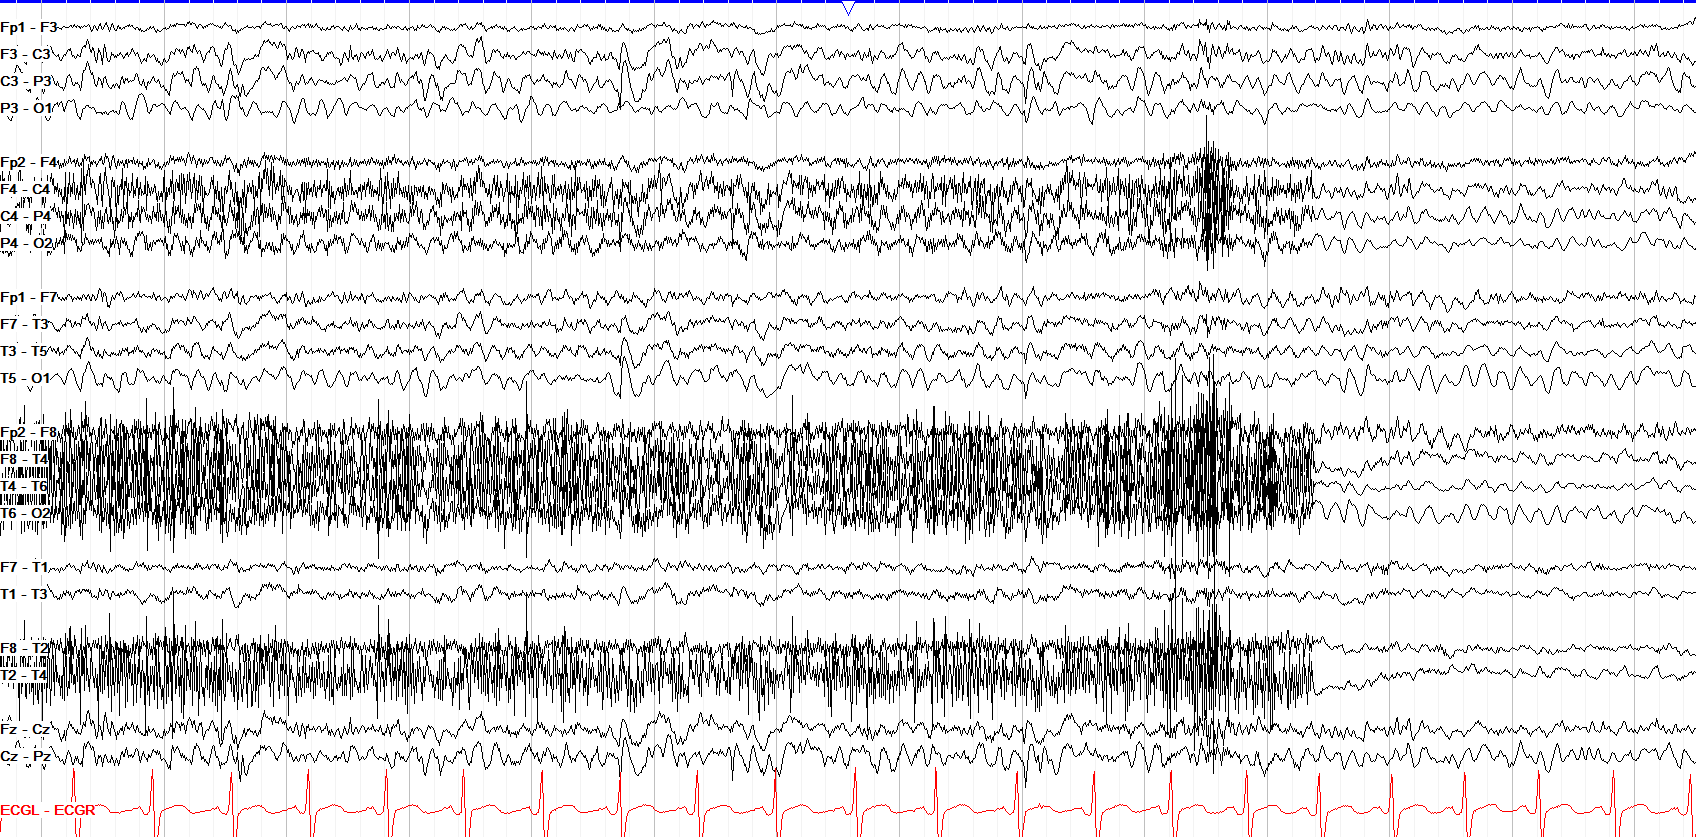
While this discharge is best seen on the left, there is clearly a fairly symmetric spike and wave on the right side within the myogenic artifact.
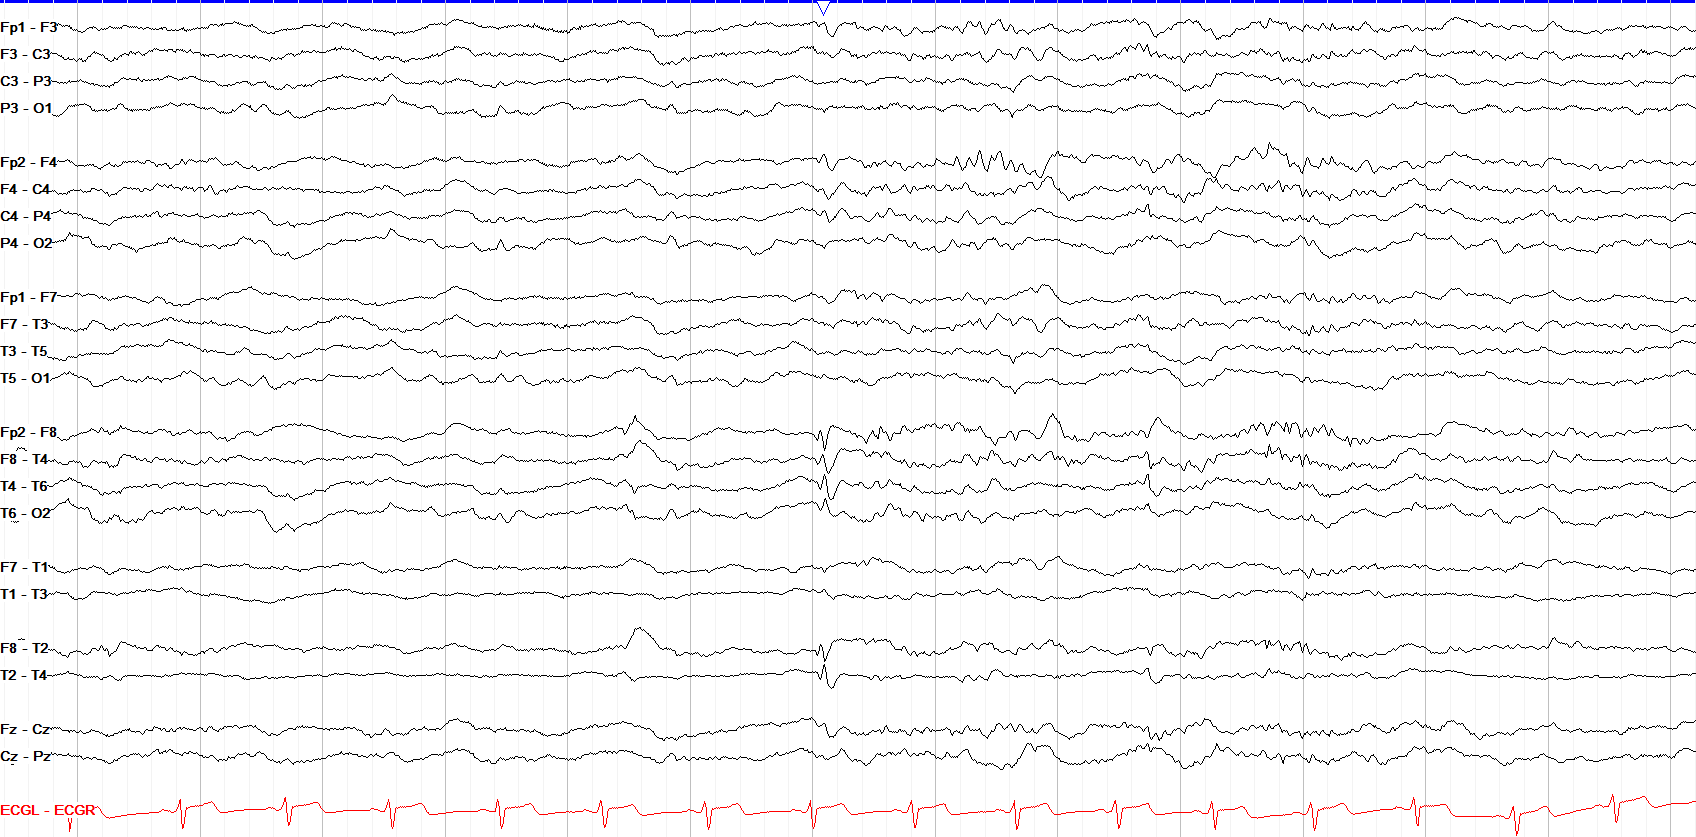
This right temporal discharge shows most of the six criteria for full confidence that it’s a true epileptiform discharge: 1) spiky morphology, 2) after-going slow wave, 3) clear anatomically coherent field, 4) disruption of the background, 5) faster up than down slope, and 6) different duration / frequency than the activity around it. Of note, there are several less well-formed ones prior to and after it.
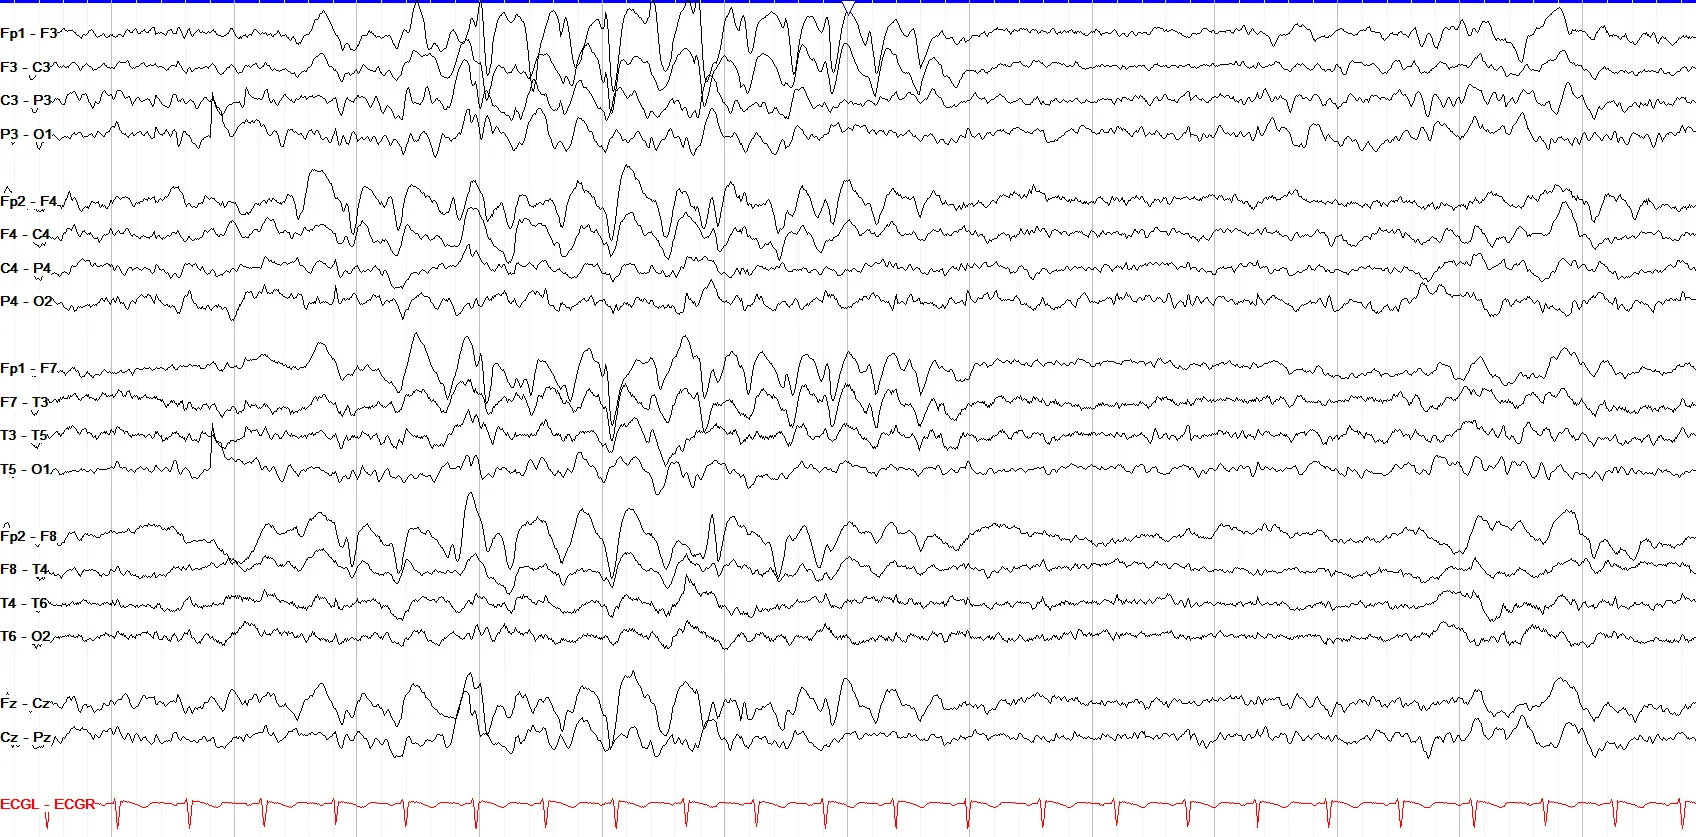
On close look you can see that each slow wave on the left has a clear "notch" of a spike prior, while the right side has these less commonly, suggesting a left sided predominance.
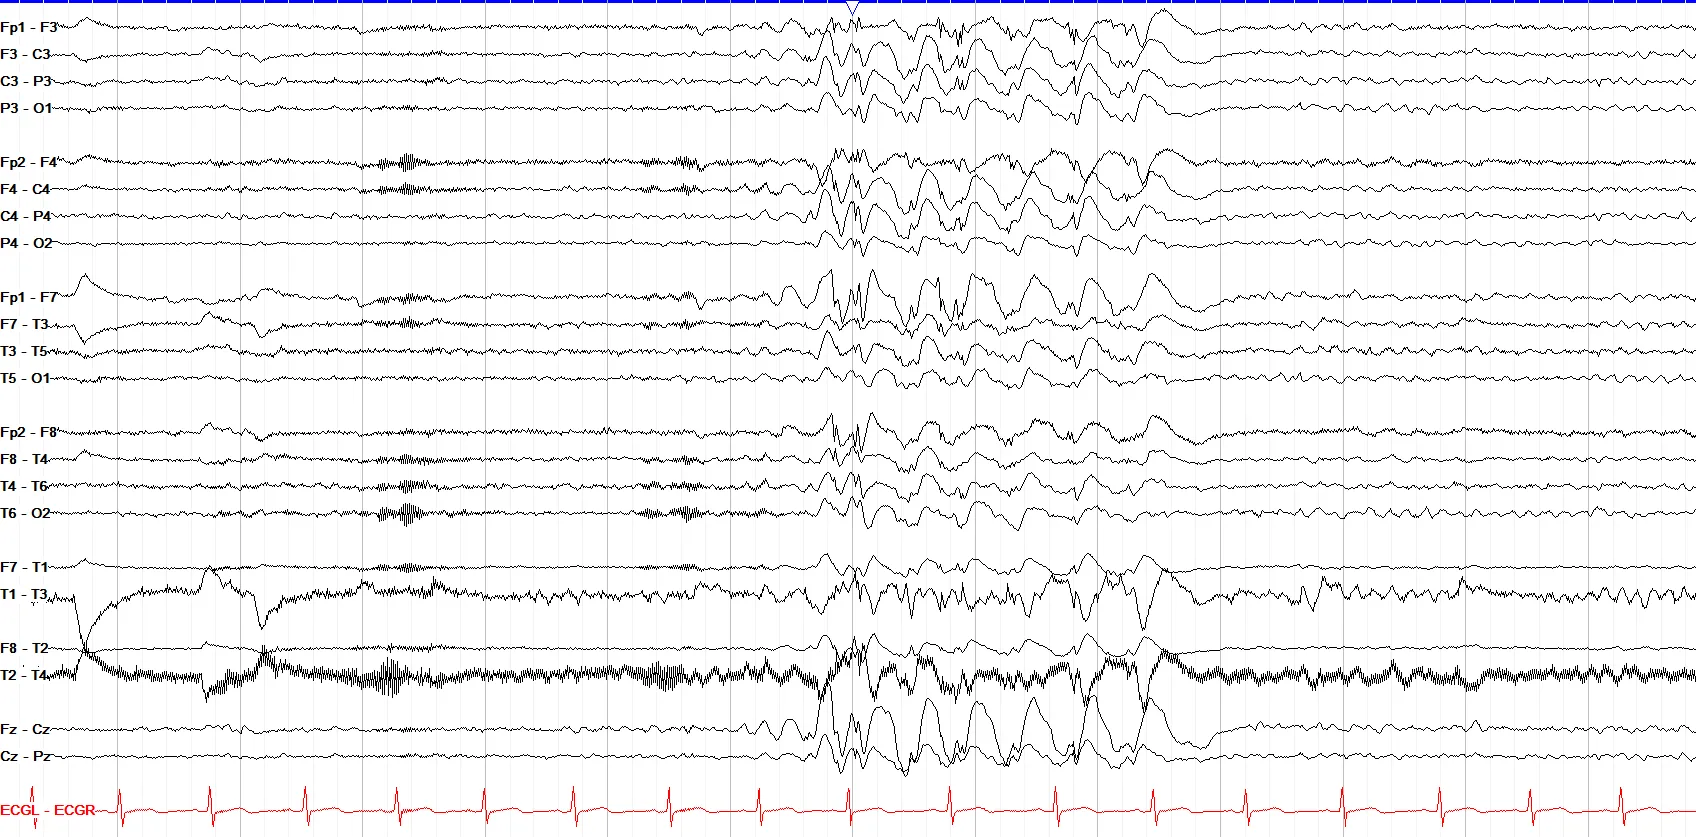
Note that most of these very high amplitude slow waves has a pair of spikes immediately preceding it, consistent with polyspikes
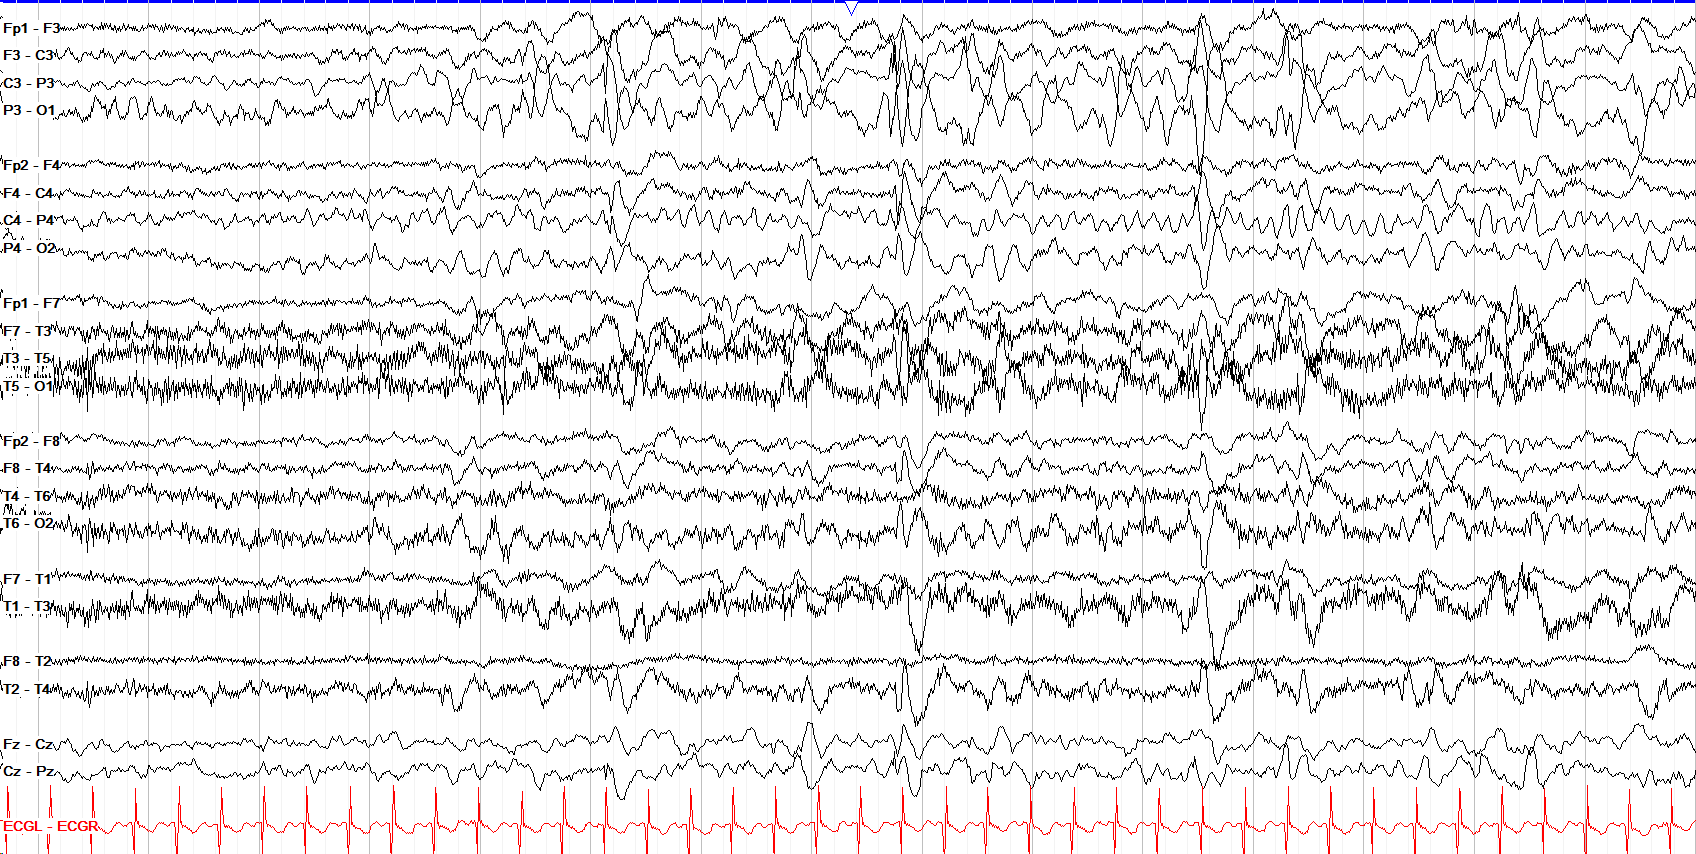
These discharges are fairly bisynchronous, although the amplitudes are highest over P3. On the right side, C4, seems to be the focus. Note the field to the bitemporal regions.
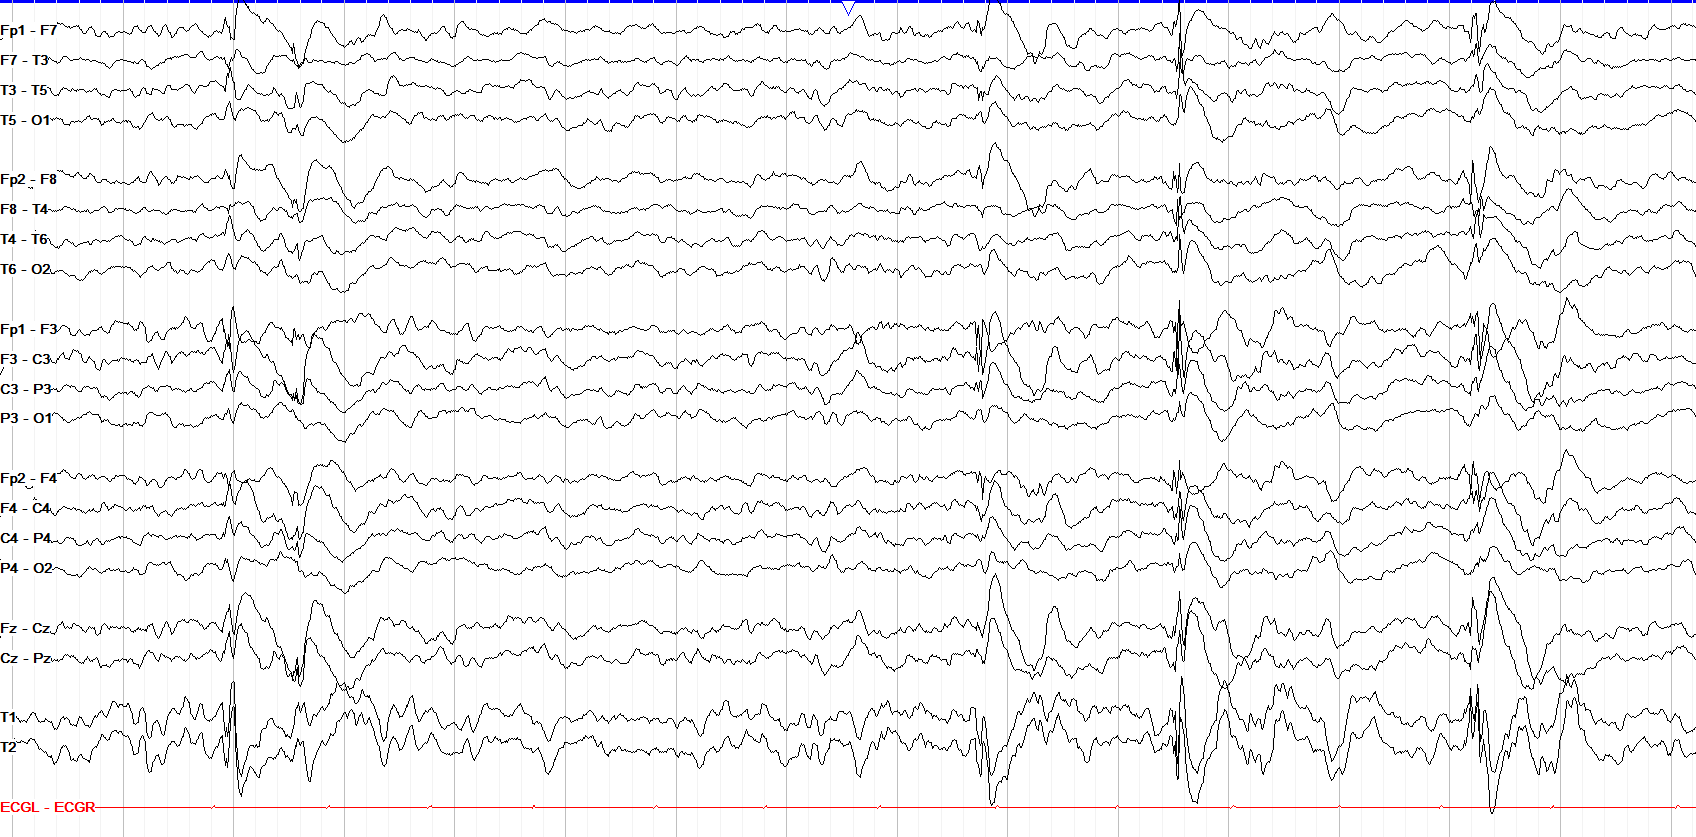
These generalized discharges have a frontal predominance, which is fairly common in generalized epilepsy. Their symmetry and presence of clear spikes before the wave in each lead support these being generalized.
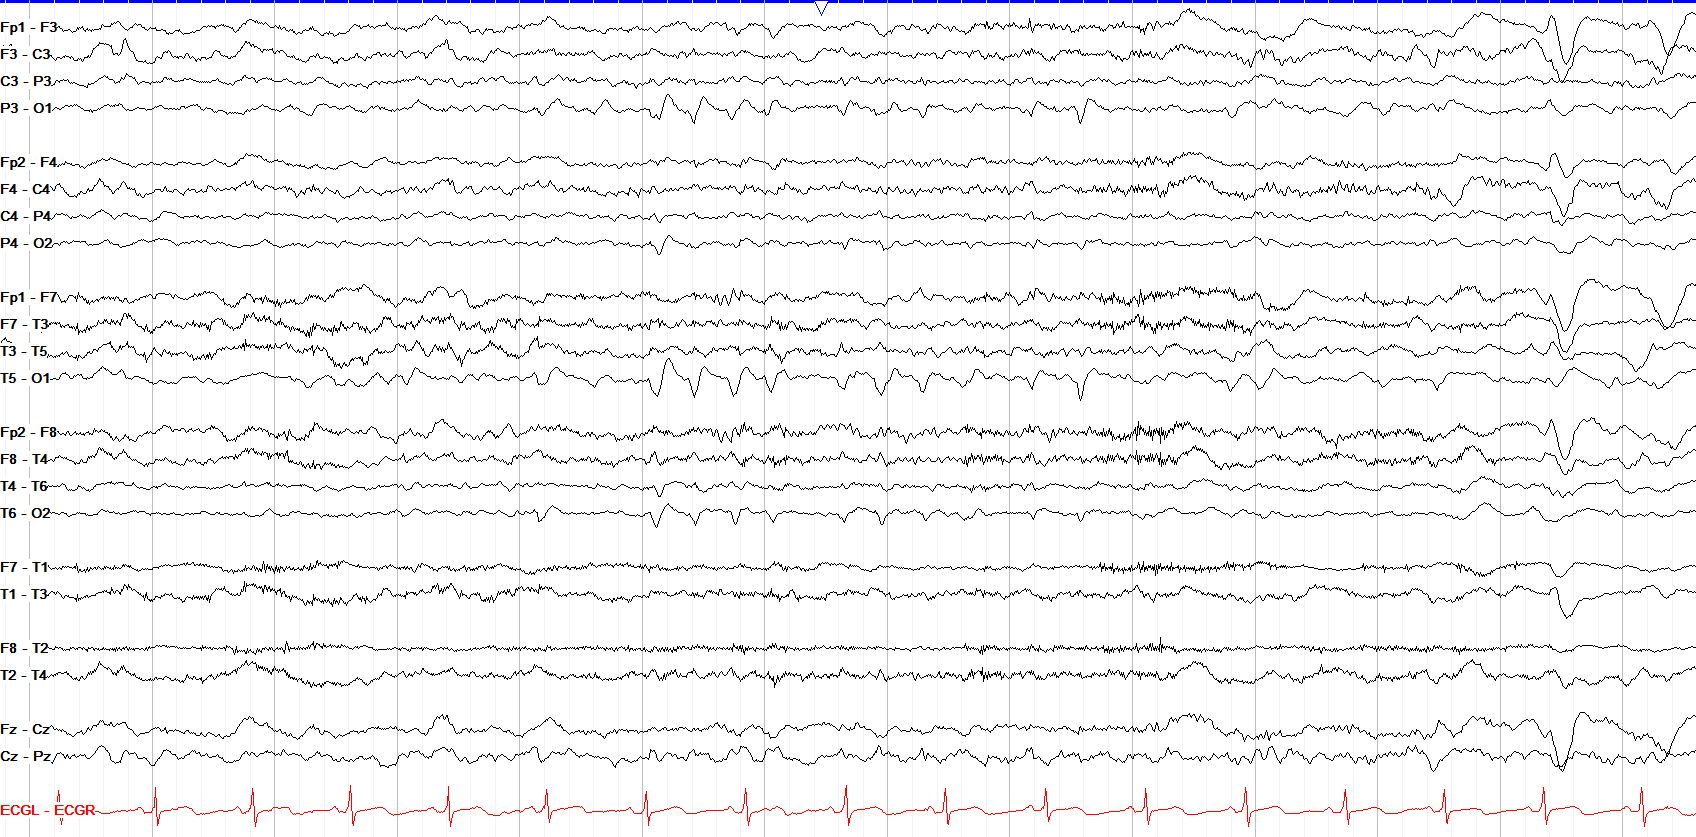
At times, interictal discharges will come in bursts or runs like this; as long as they do not continue to evolve, it is not a seizure. Note the small field to the right occipital region, seen best in the temporal chain.
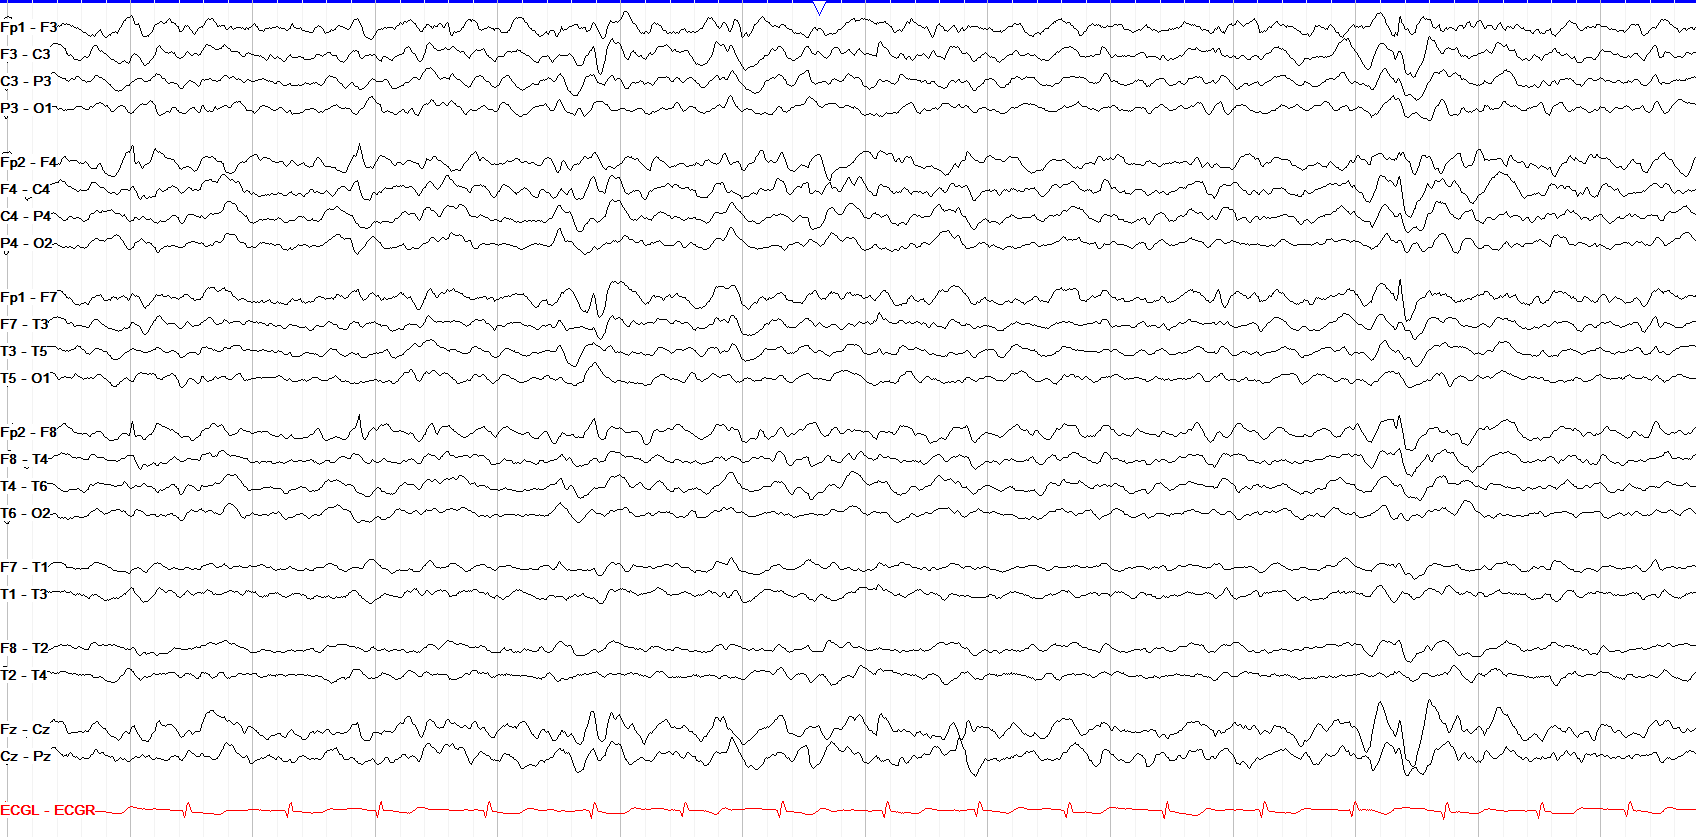
In the first half of this page we have a sharp and slow wave in the left frontal region, likely Fp1 max but slightly butting up against the end of chain phenomenon. In the latter half of the page we see another one, this one less a sharp and more of a spike and slow wave, with some more overt field into the right frontal region at Fp2.
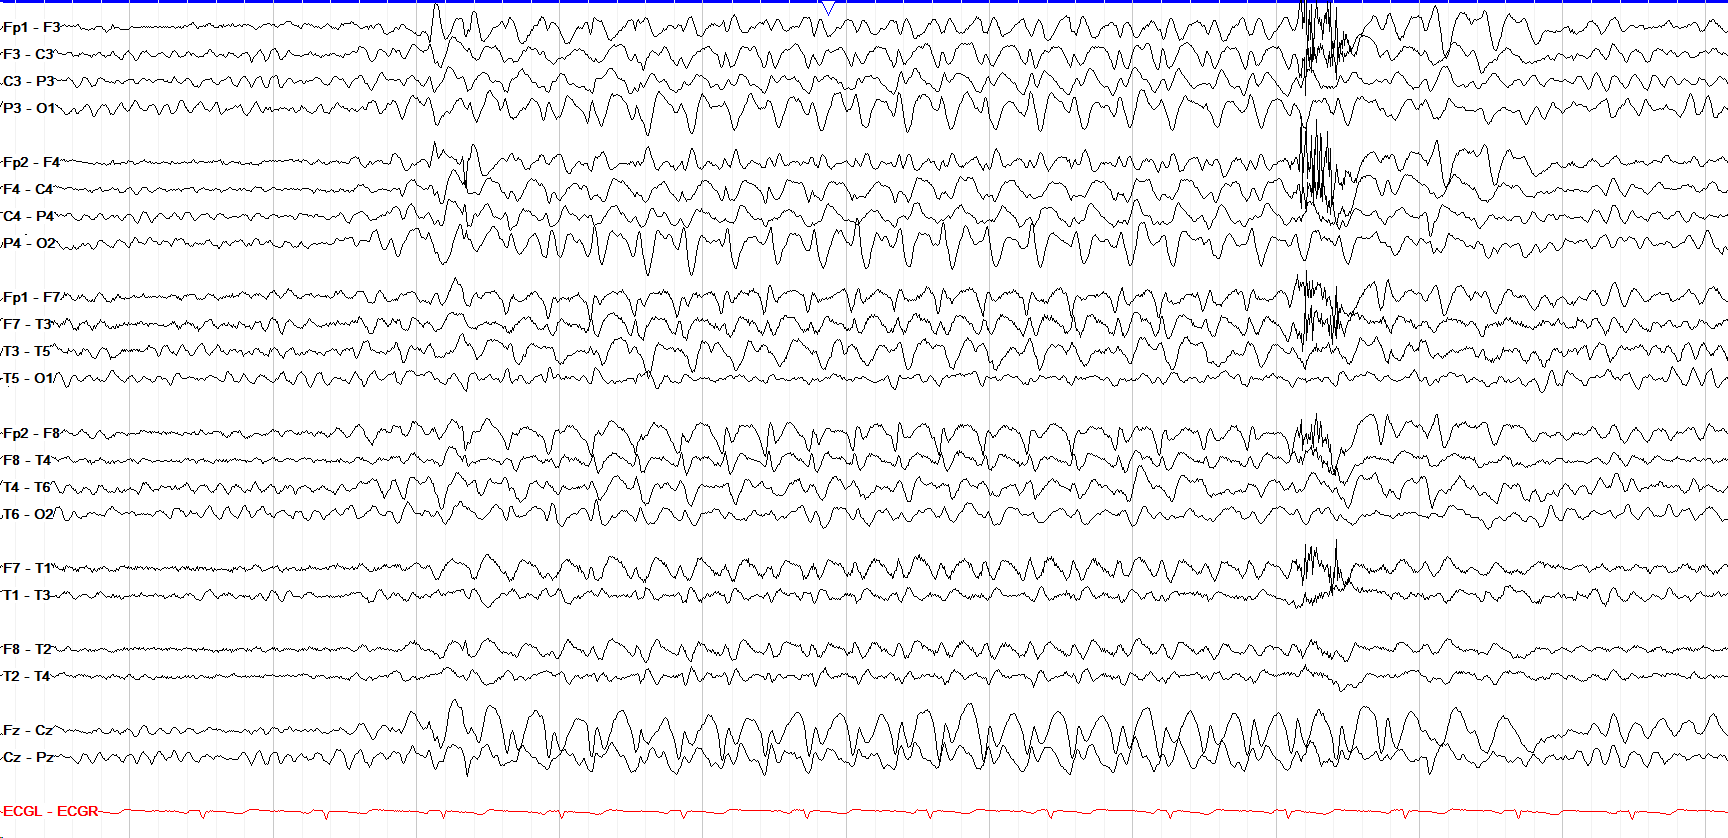
This ~8–second run of non-evolving 3 Hz frontally predominant generalized spike and slow waves nears seizure threshold but doesn’t quite last ten seconds. There is a notable phase reversal at F3 right at the beginning that may suggest some focality at onset, but it’s not enough to be certain given the overall more generalized onset. In such cases, other runs throughout the same tracing, or more detailed clinical context such as structural lesions, could clarify.
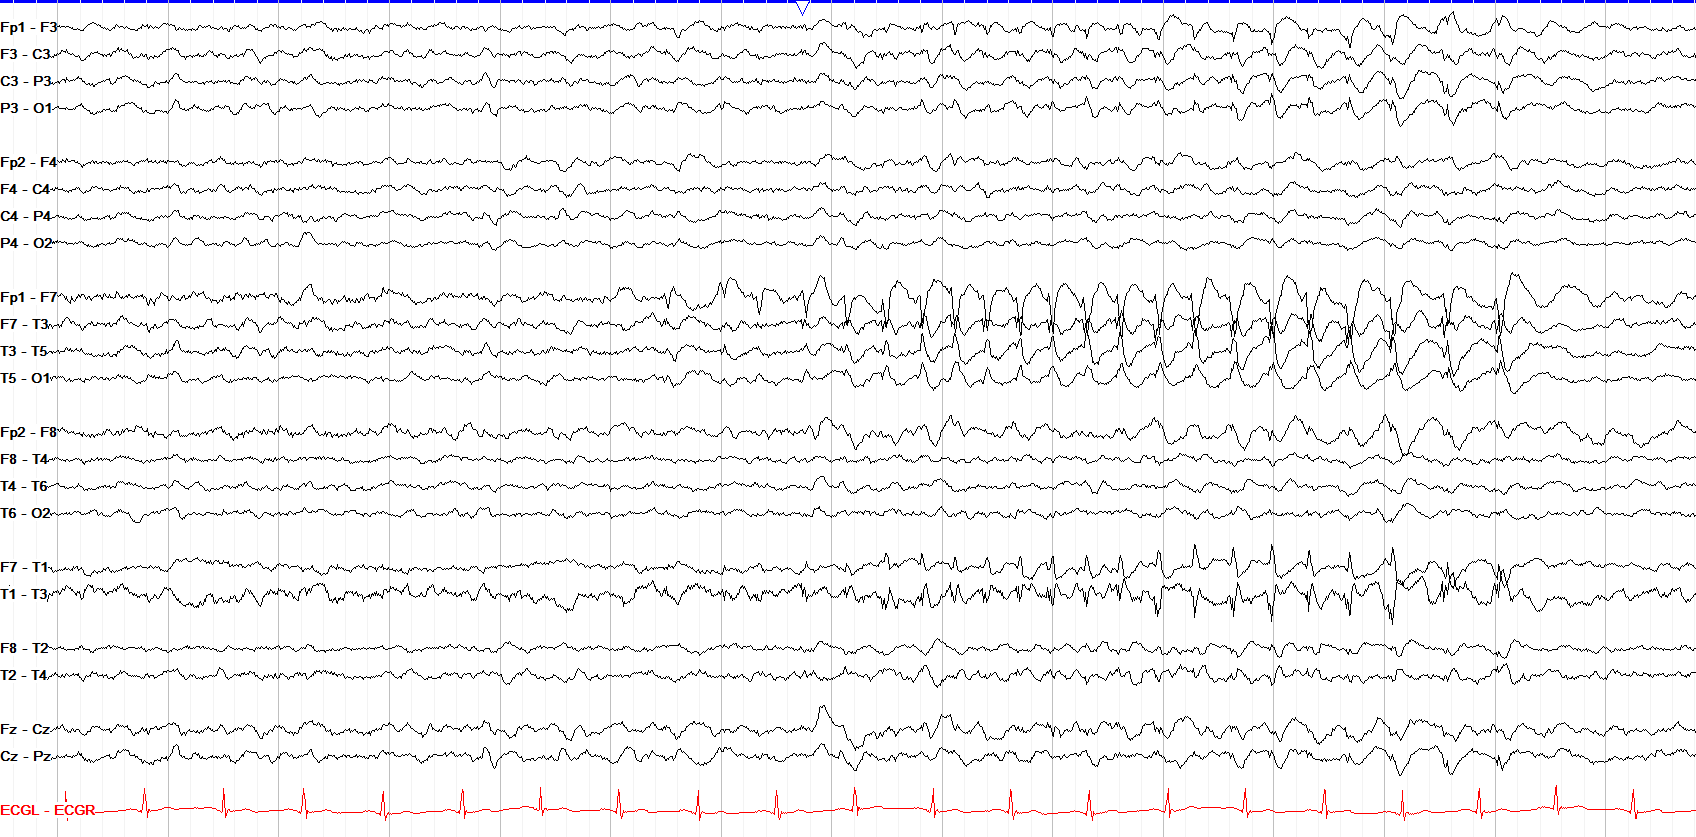
This subtly evolving run of ~3 Hz left anterior temporal spike and wave complexes, without a clinical correlate, does not meet seizure criteria given it is less than ten seconds, and it’s not a BIRD because it doesn’t reach 4 Hz. Even without evolution and without reaching ten seconds, though, if it had a clinical correlate it would be considered a seizure.
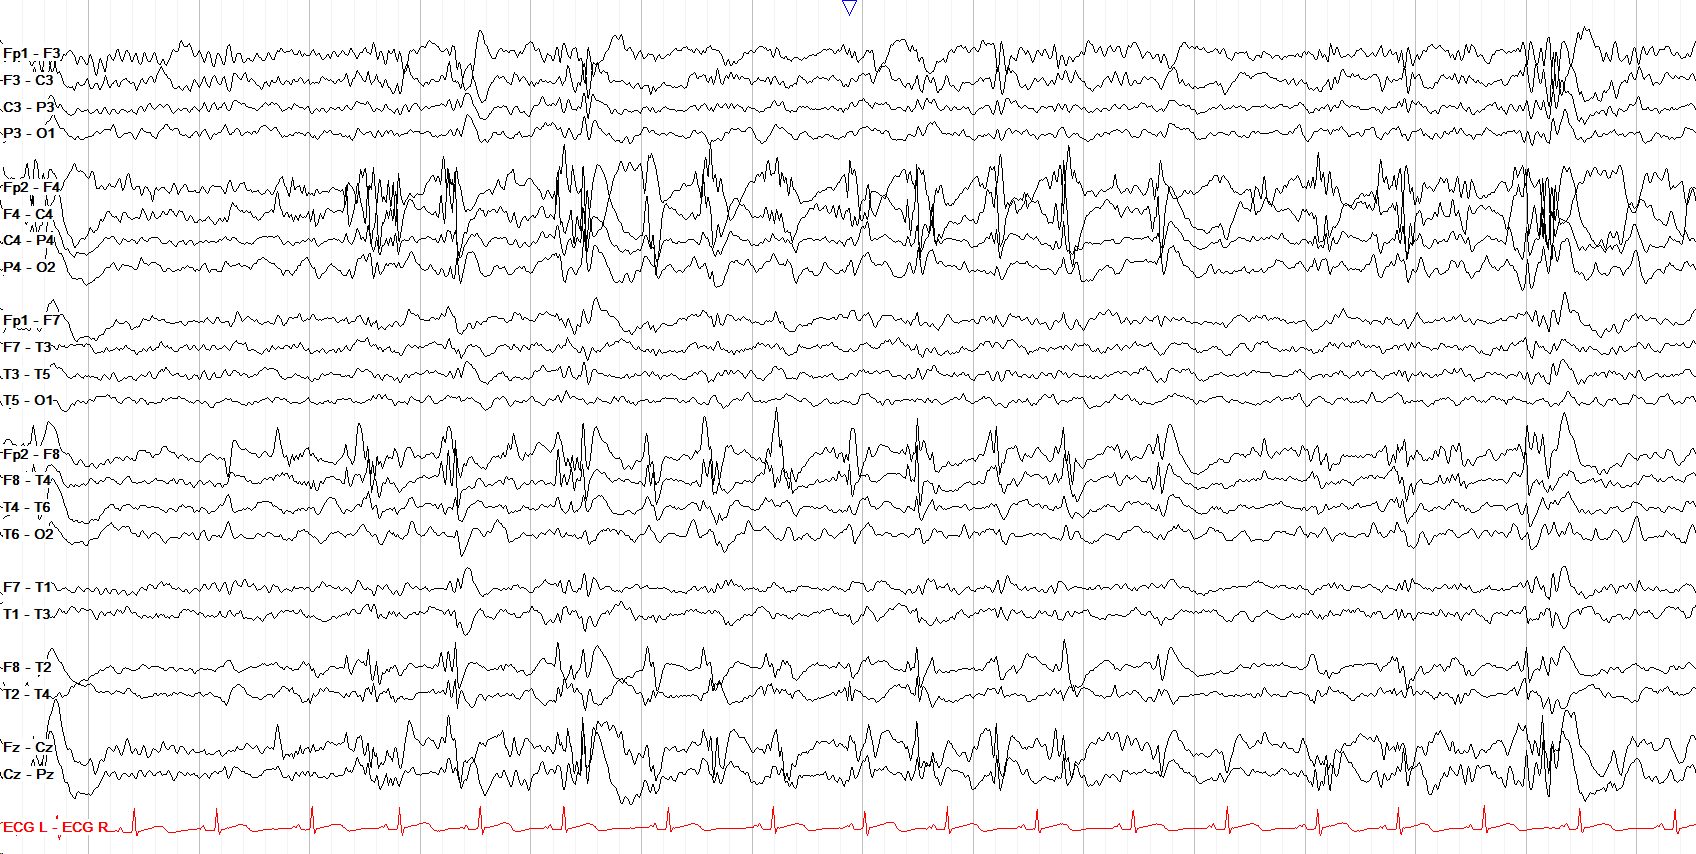
Here we see a 1.5 Hz nonevolving run of right frontotemporal polyspike and wave complexes, some with an aftergoing slow wave and some with spread into the left frontal region. The periodic nature of these discharges puts them on the ictal-interictal continuum (IIC). The background is diffusely slow with delta, theta and some overriding faster frequencies without a clear AP gradient or PDR.
paroxysmal fast activity
1 pattern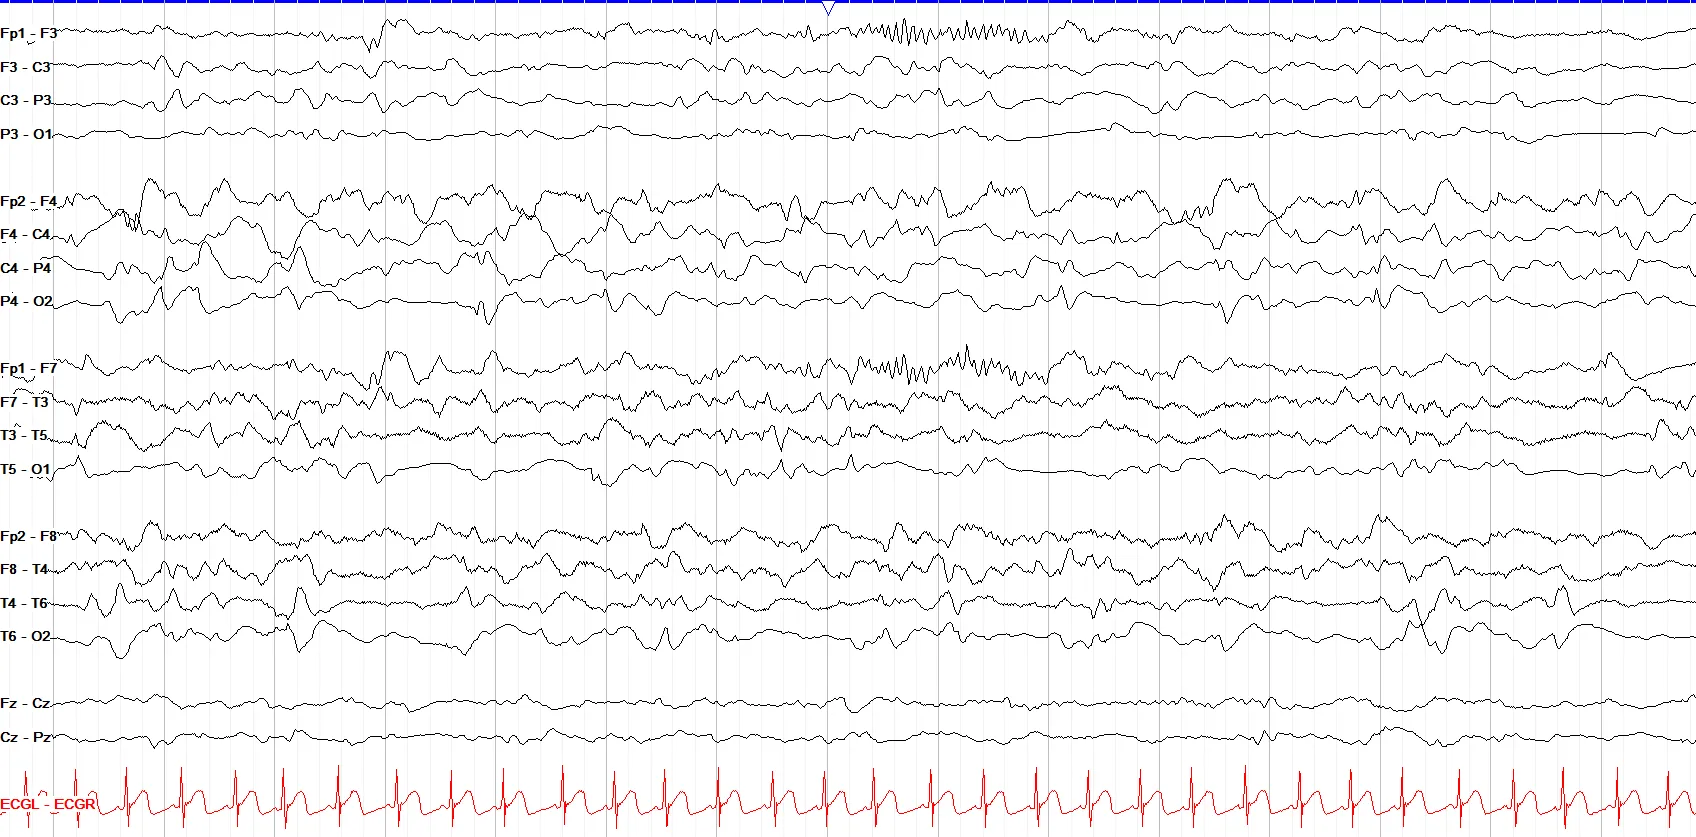
Paroxysmal fast activity is an epileptiform pattern most commonly seen with generalized epilepsy and Lennox-Gastaut Syndrome.
generalized rhythmic delta
4 patterns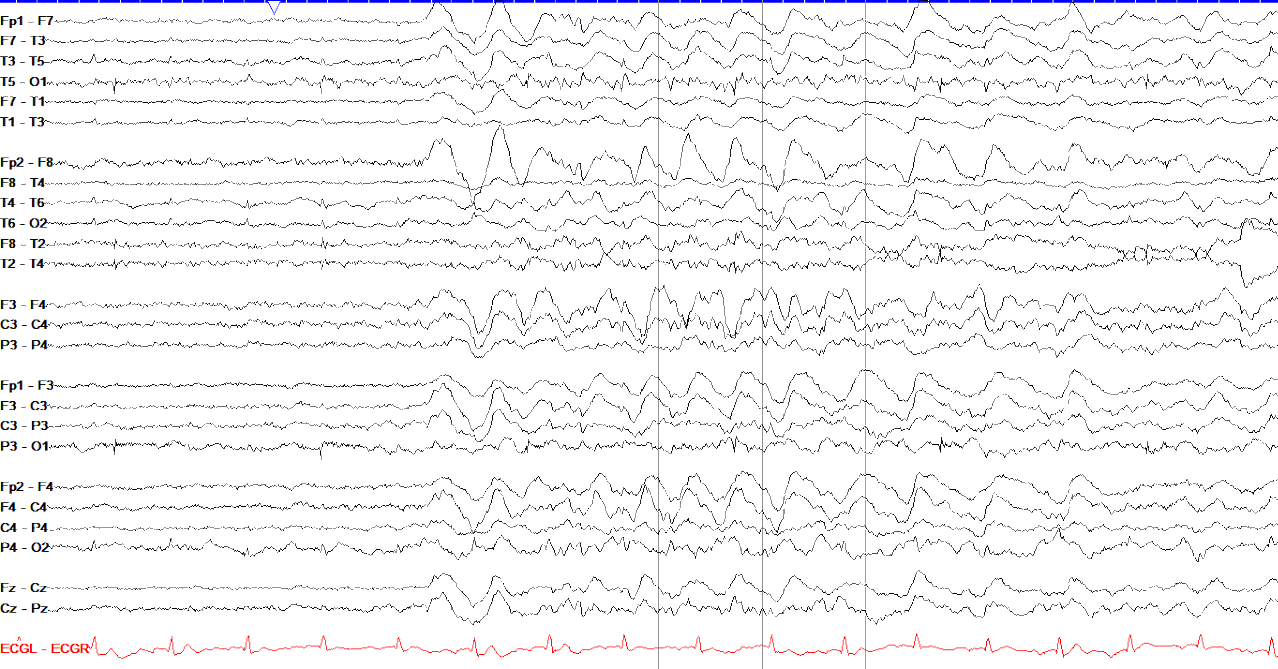
Generalized rhythmic delta activity (GRDA) is commonly seen with toxic and metabolic encephalopathies. It usually falls below the IIC in terms of seizure risk.
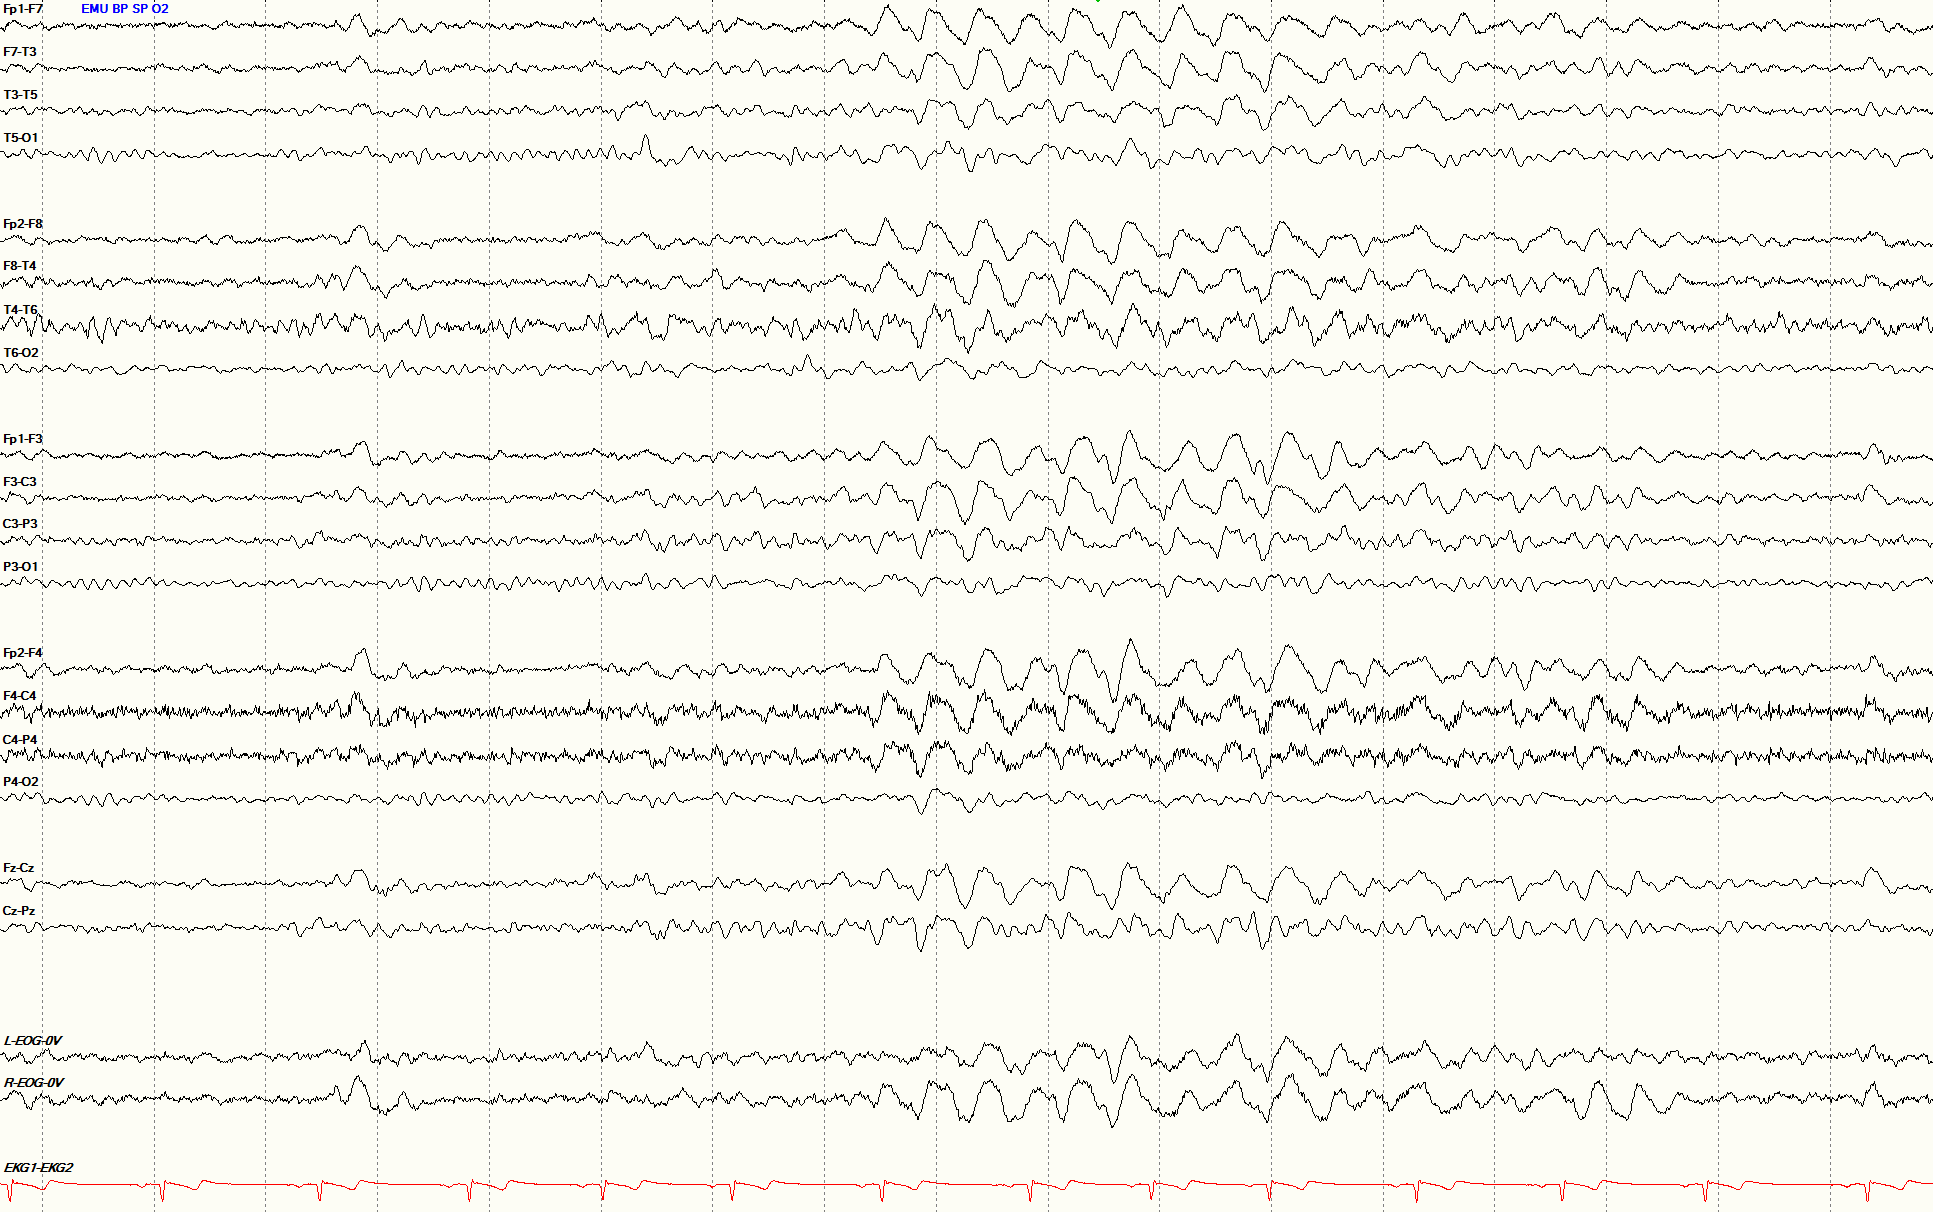
When GRDA shows superimposed fast (+F) or sharp (+S) activity, concern rises even though GRDA remains formally excluded from the IIC, while any evolution seen can be concerning for a shift to ictal activity.
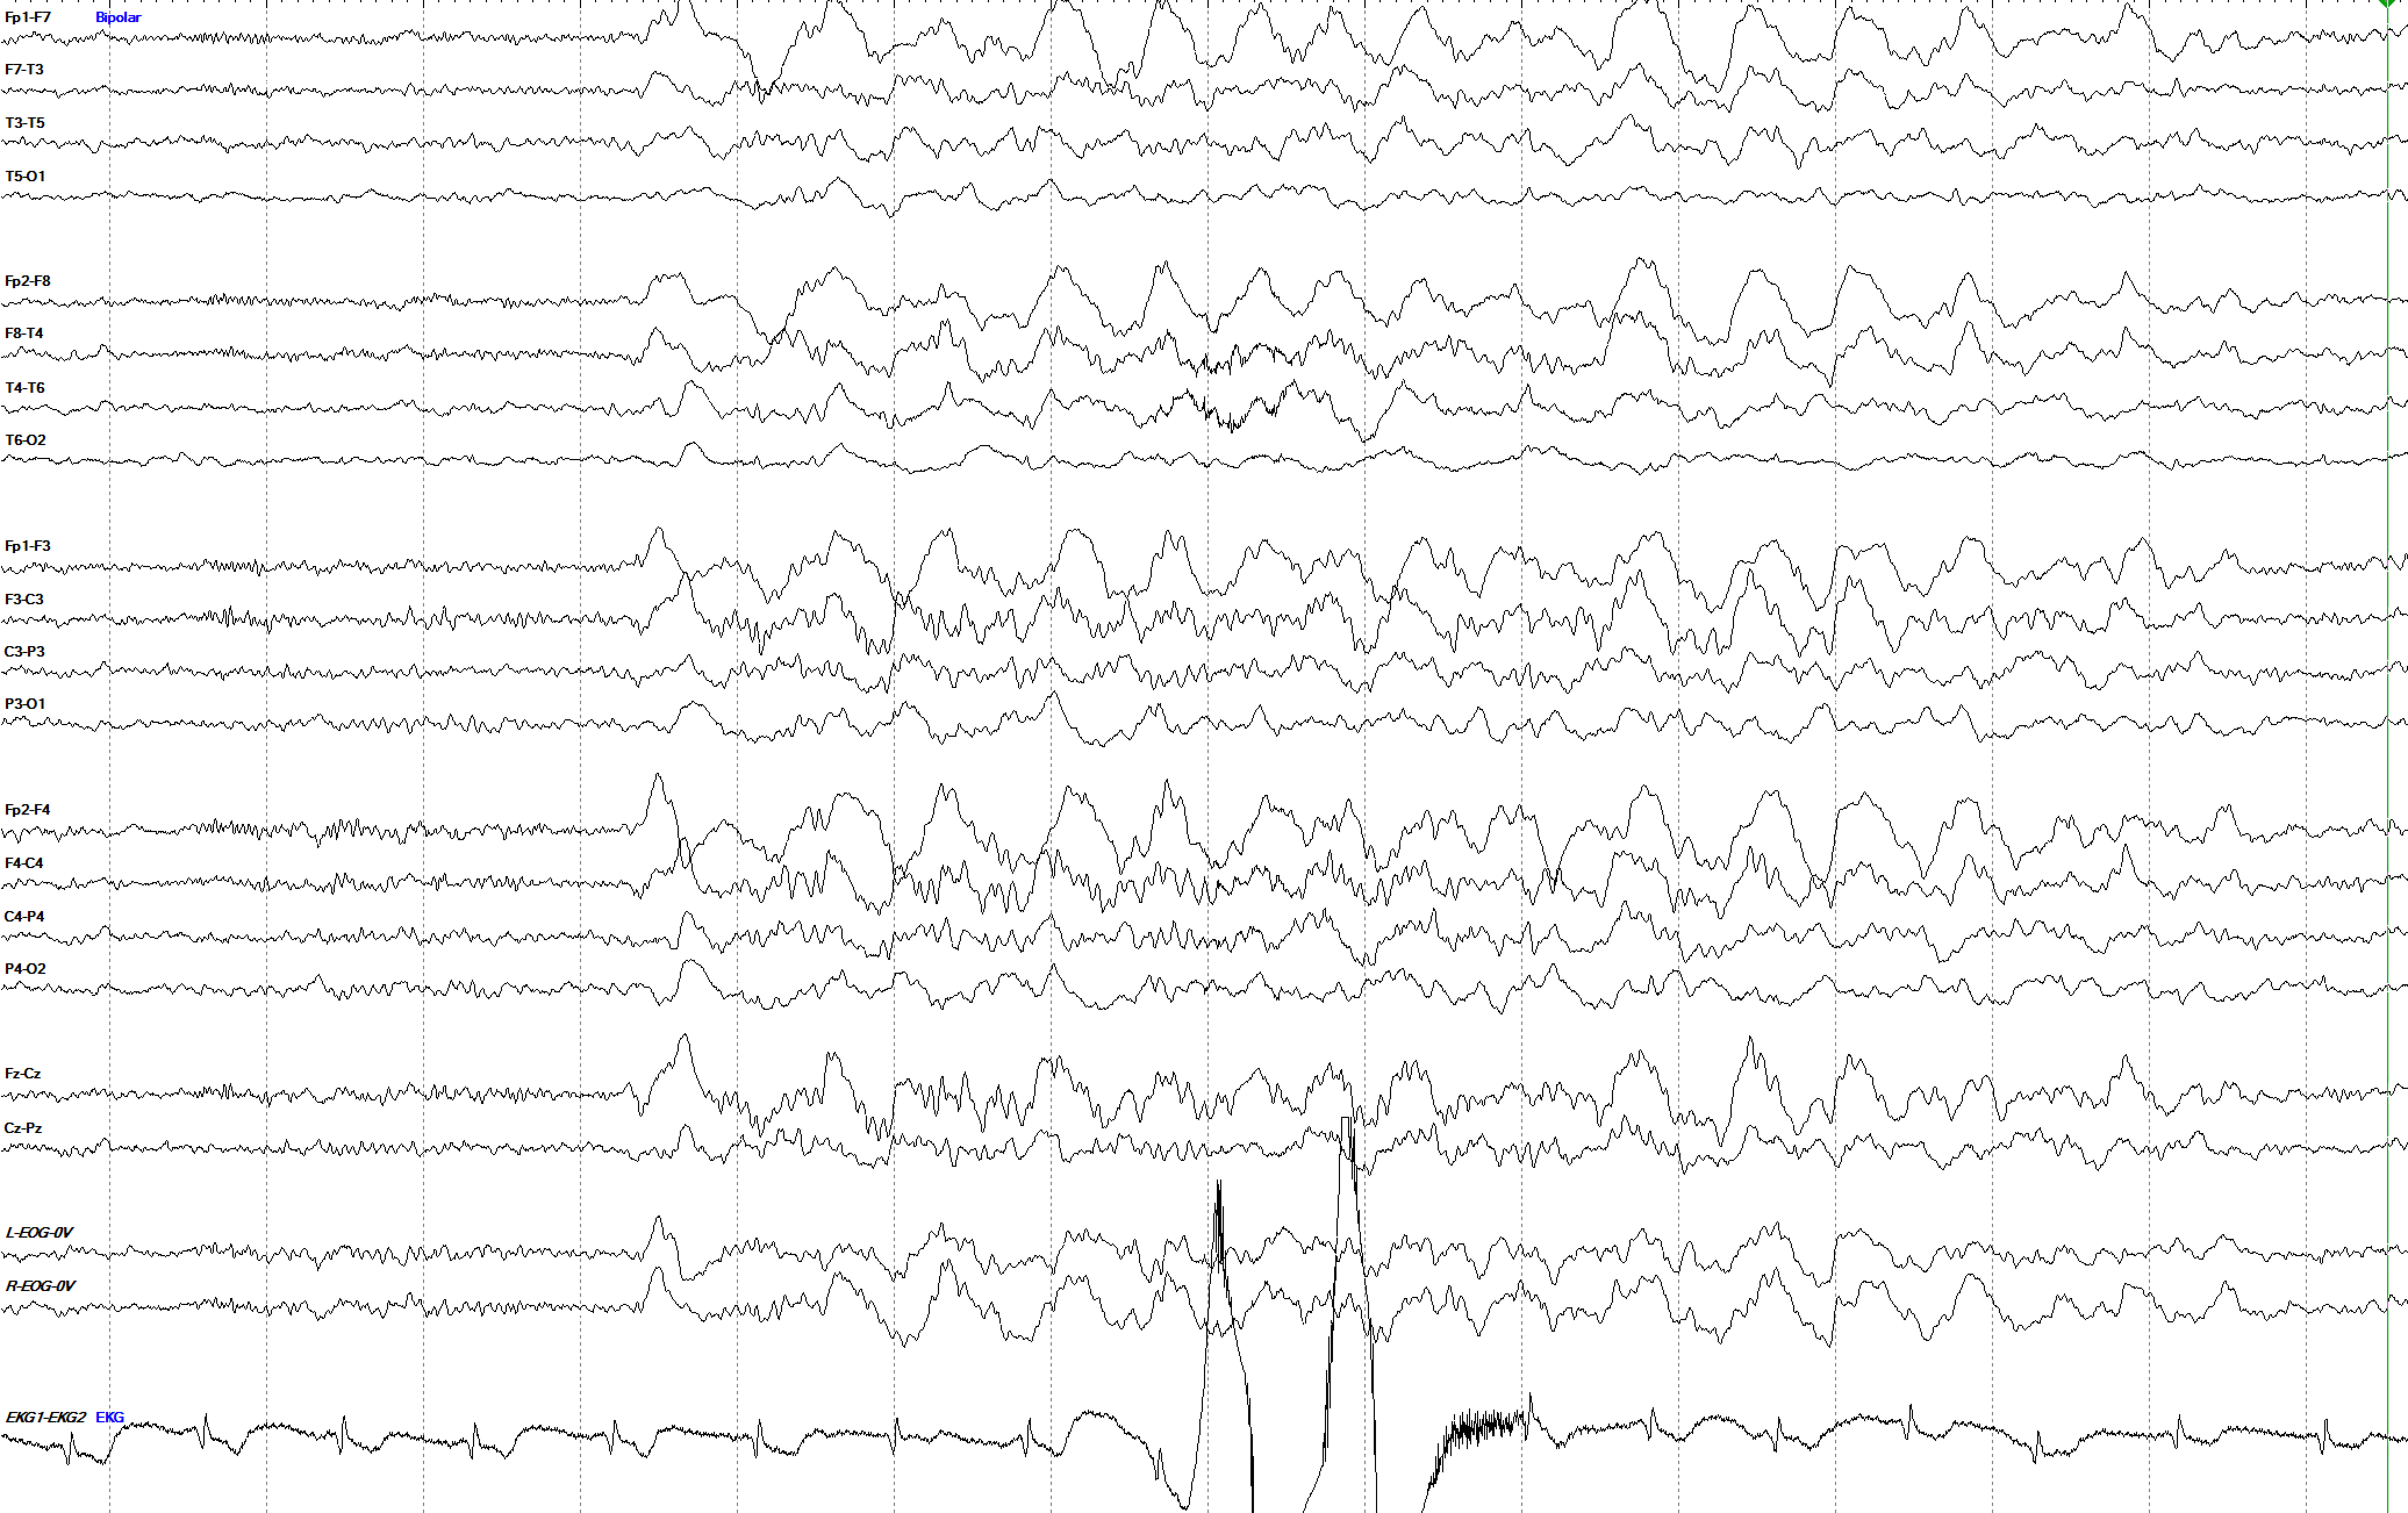
GRDA with frontal predominance used to be termed frontally predominant intermittent rhythmic delta activity (FIRDA).
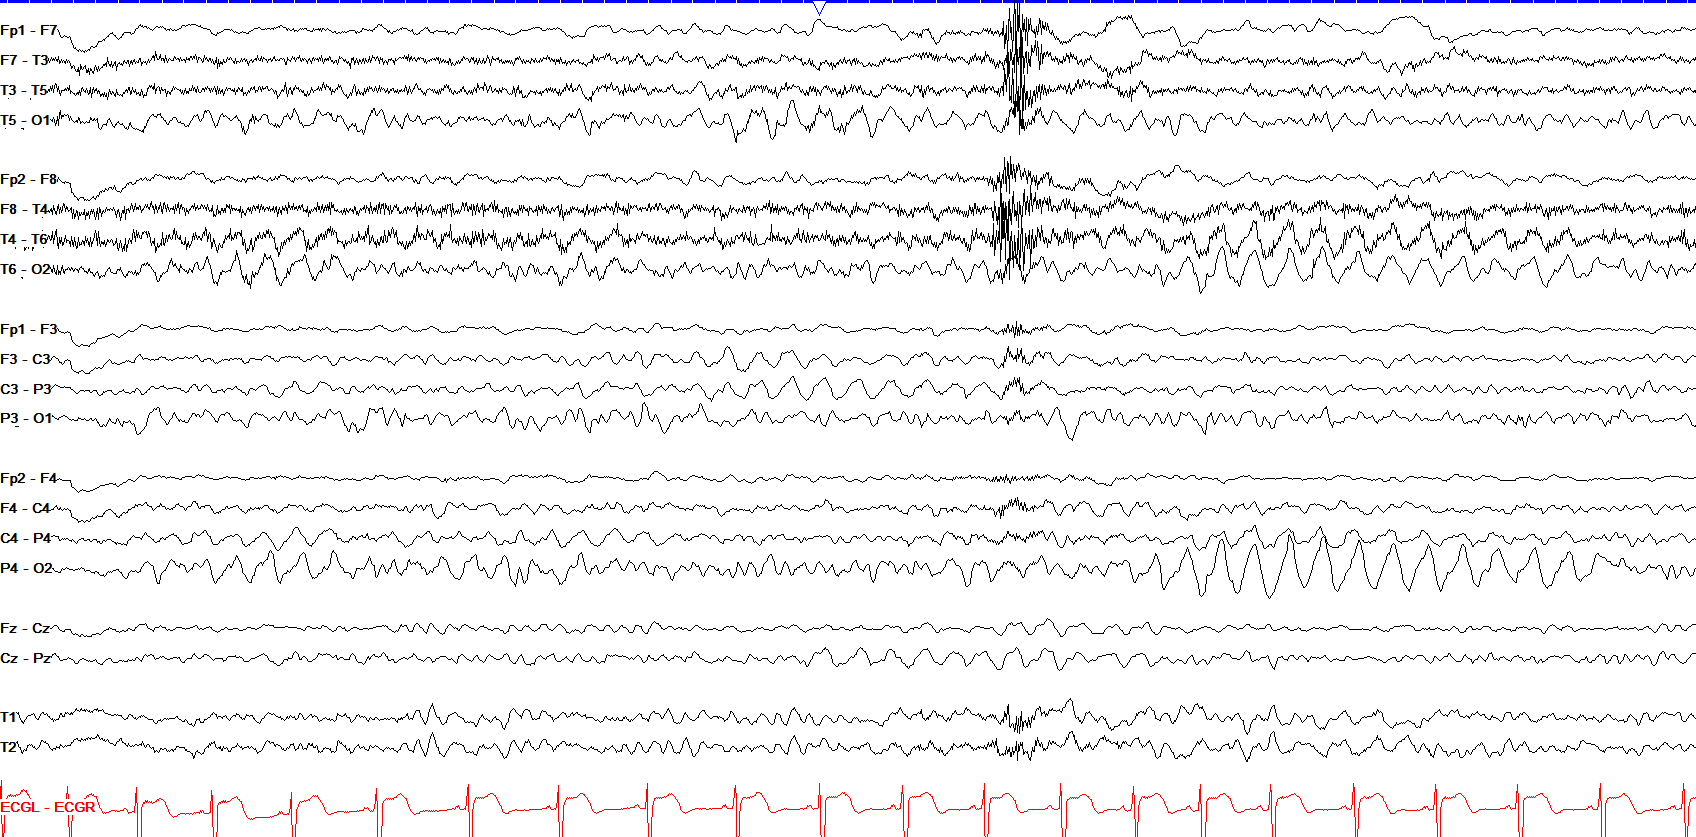
Unlike generalized or frontally predominant GRDA, occipital predominant GRDA is more associated with generalized pediatric epilepsy but can also be seen with encephalopathy. The asymmetry and notched morphology in this example both also suggest higher seizure association.
generalized periodic discharges
7 patterns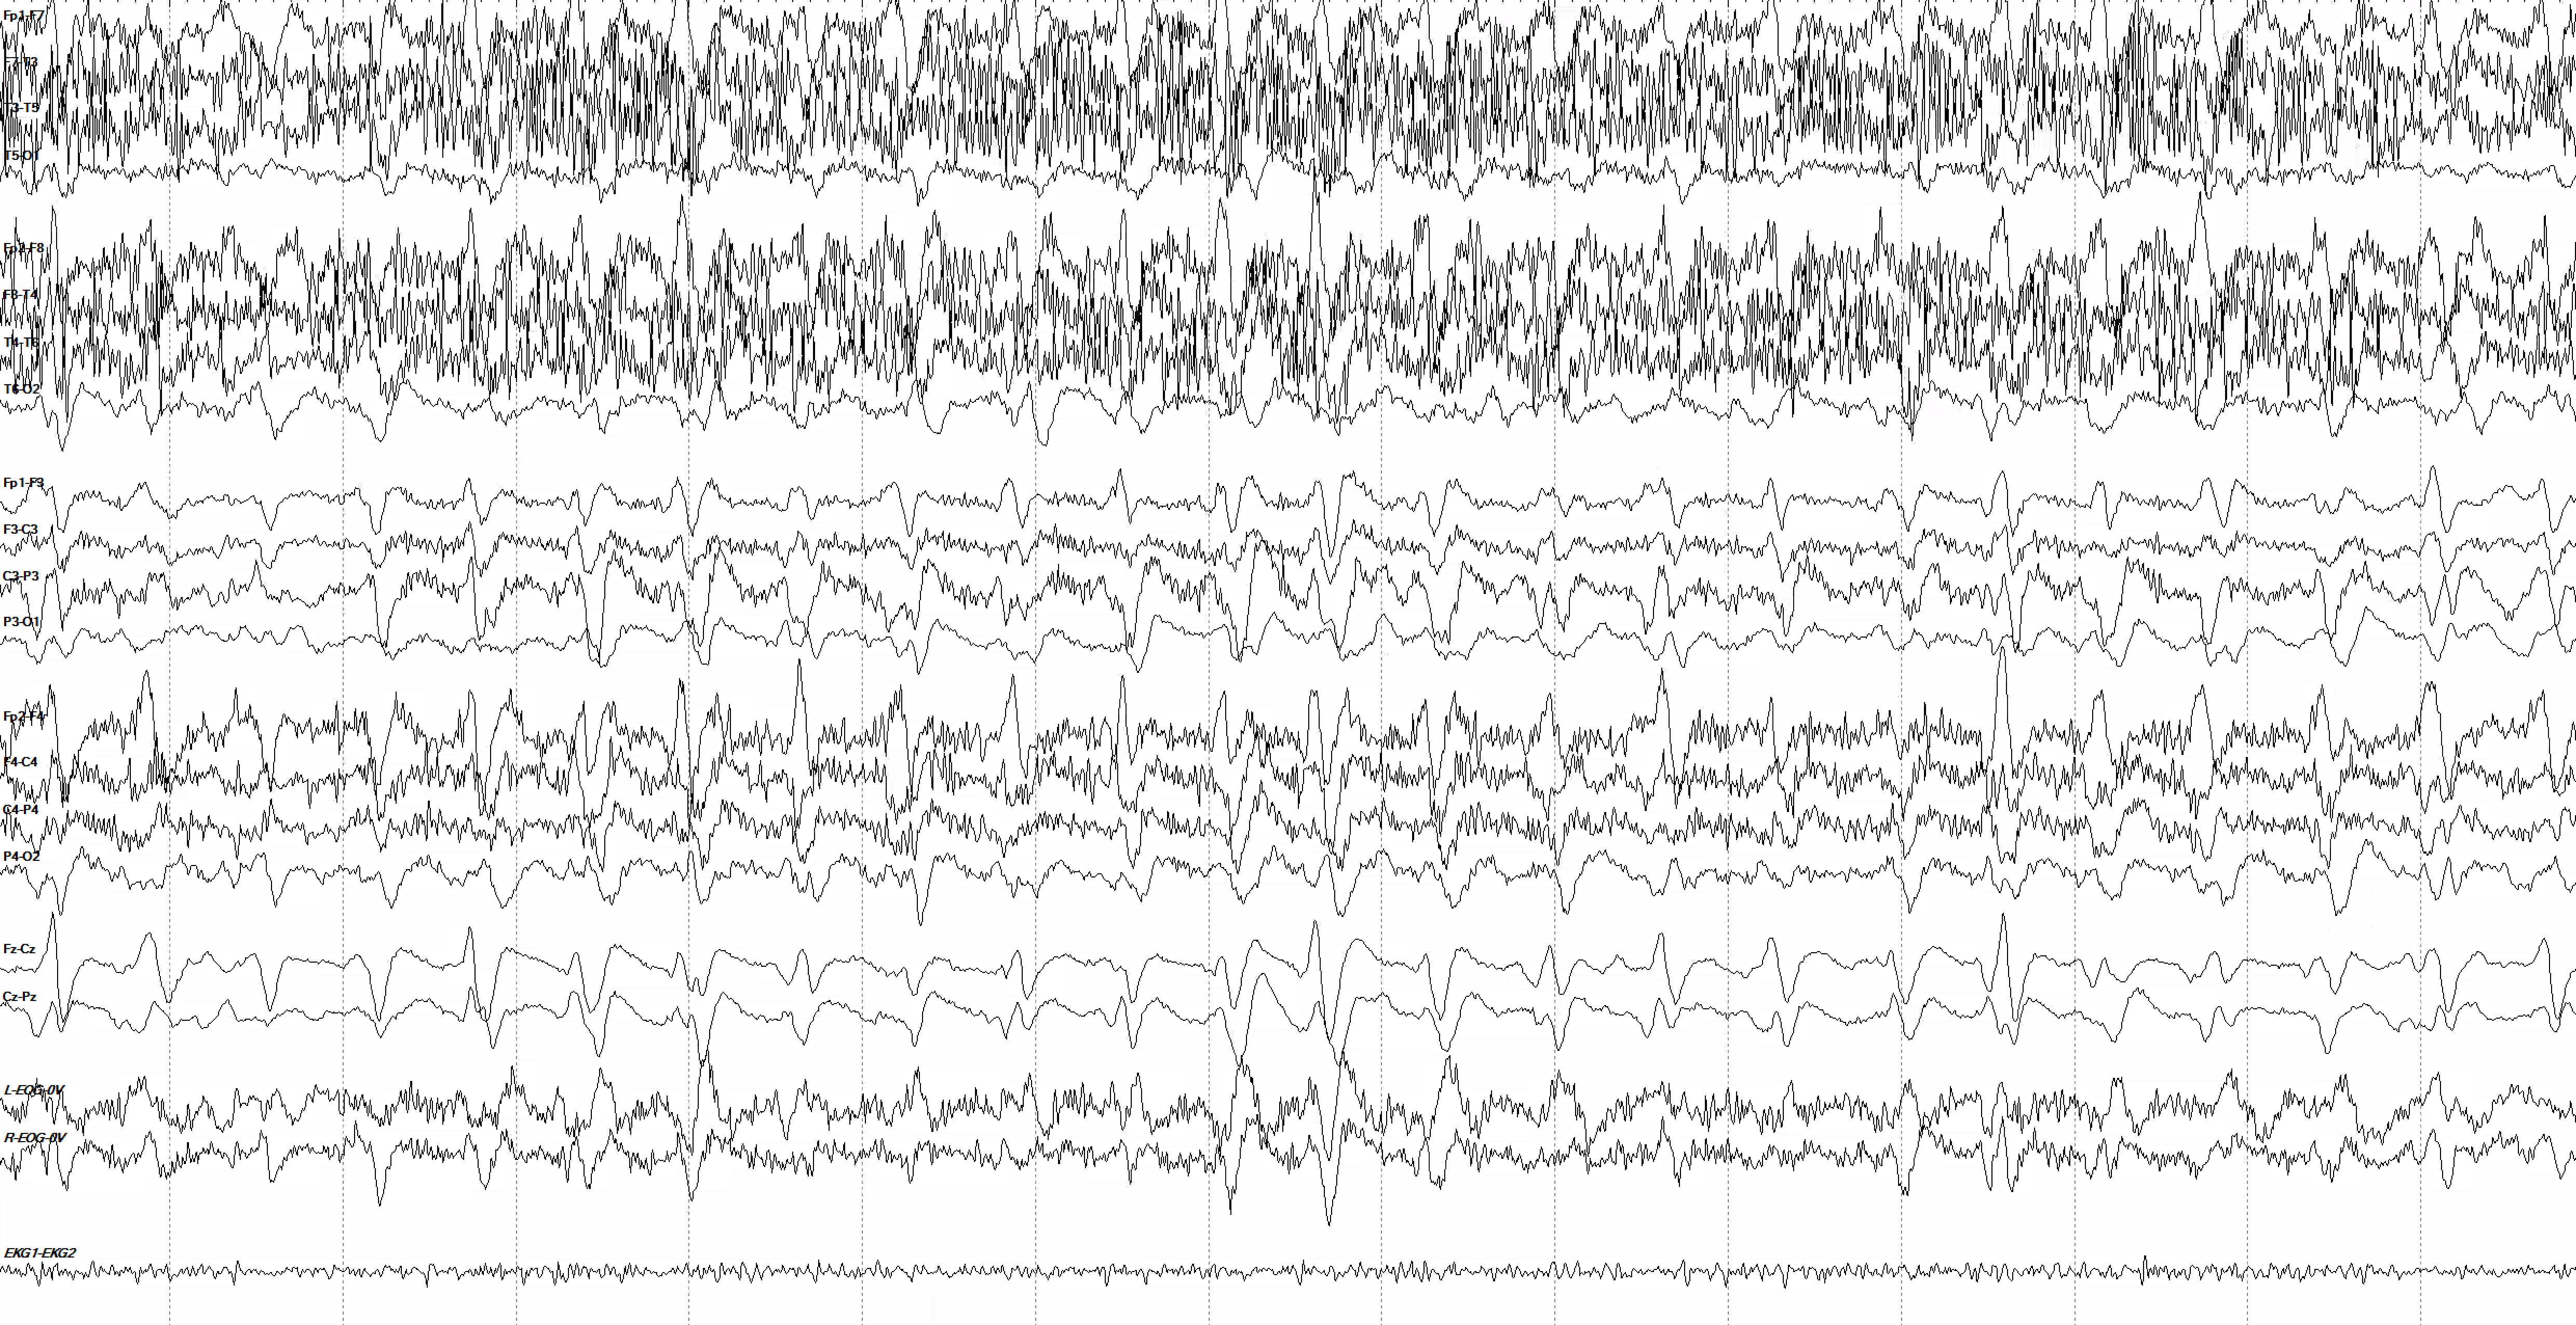
Generalized periodic discharges (GPDs) with triphasic morphology used to be termed triphasic waves, and are marked by a three-phase morphology in which each phase is slightly longer than the last, plus an anterior-to-posterior lag.
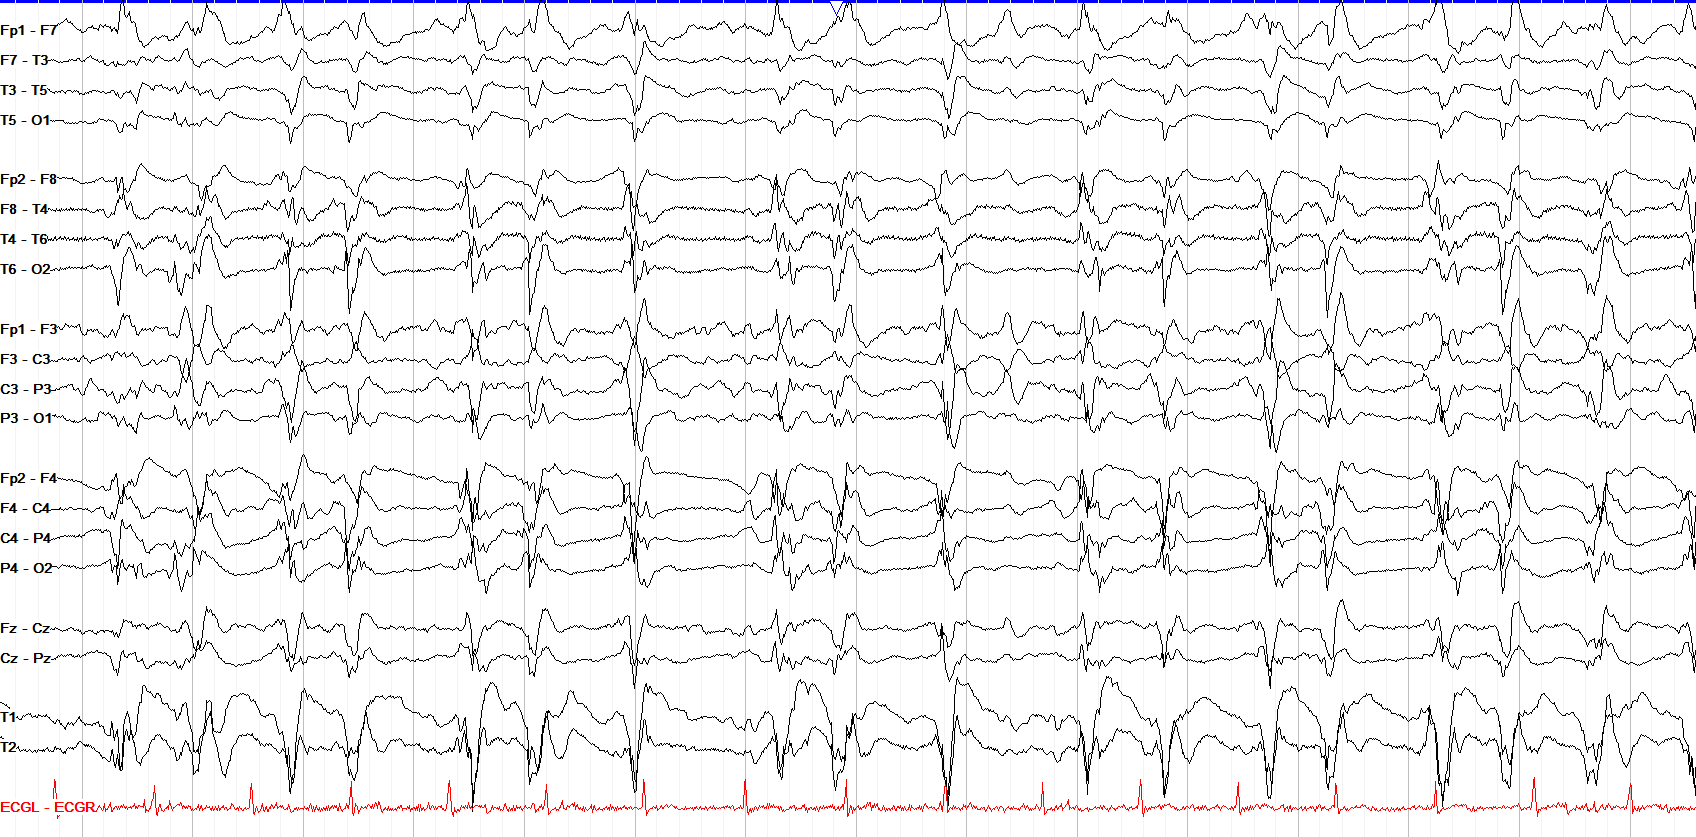
While GPDs generally fall on the lower end of the IIC, superimposed fast activity (+F) or rhythmic delta (+R) and faster frequencies push them closer to the ictal end of the spectrum.
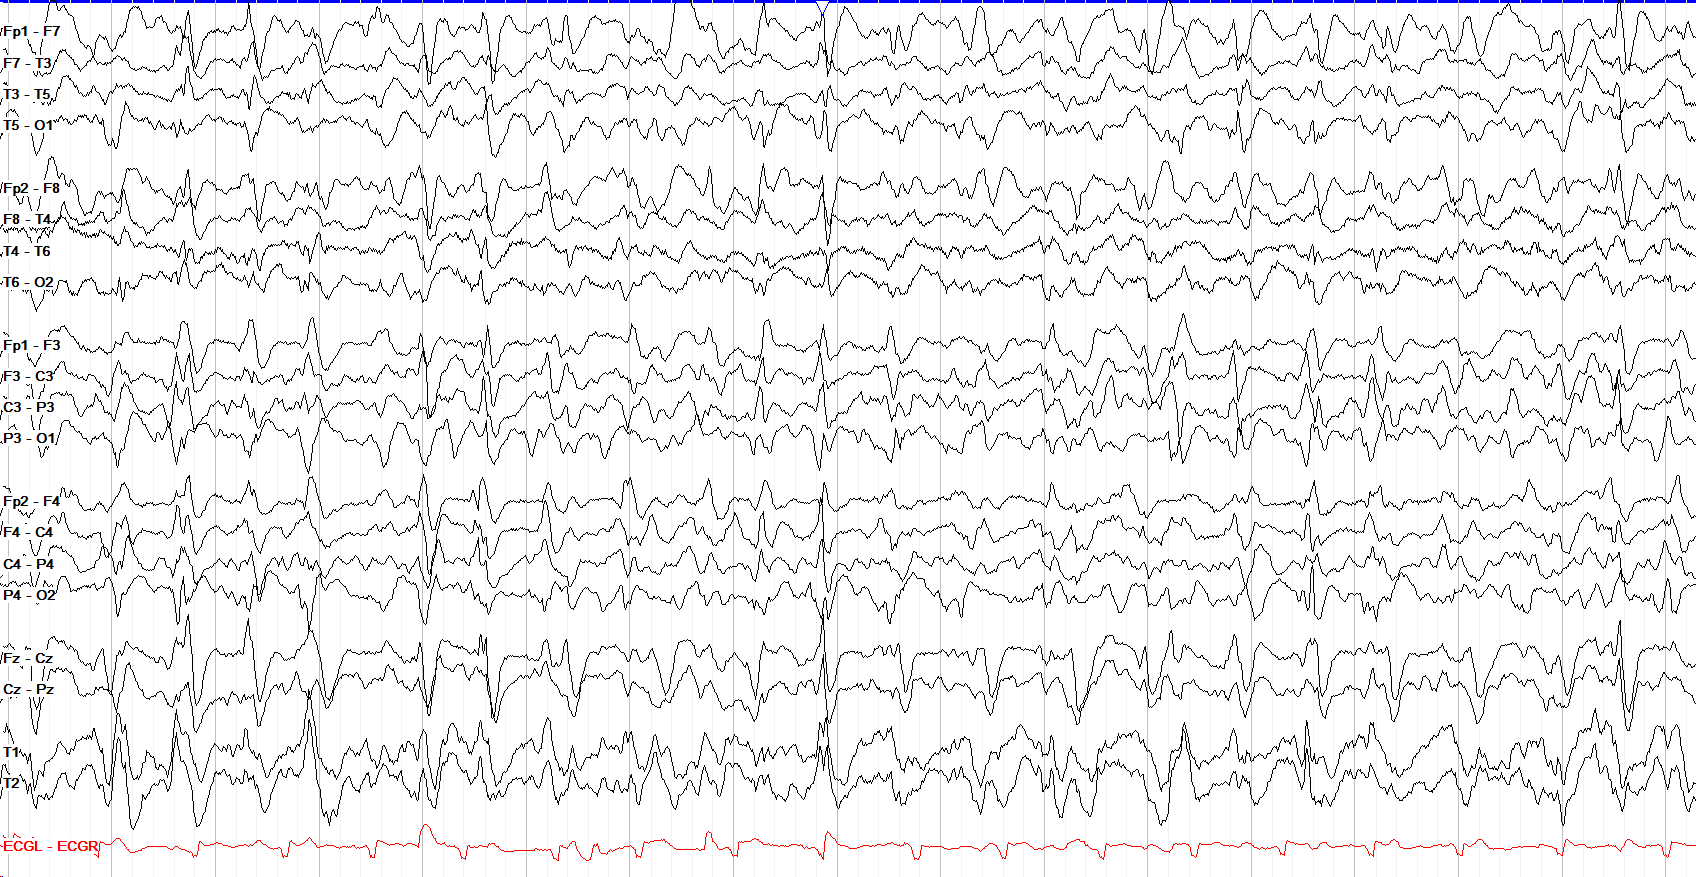
The rhythmic and periodic patterns exist on a spectrum rather than discrete entities, so morphologies can be mixed, as here where we see GPDs with a mix of sharply contoured and triphasic characteristics.
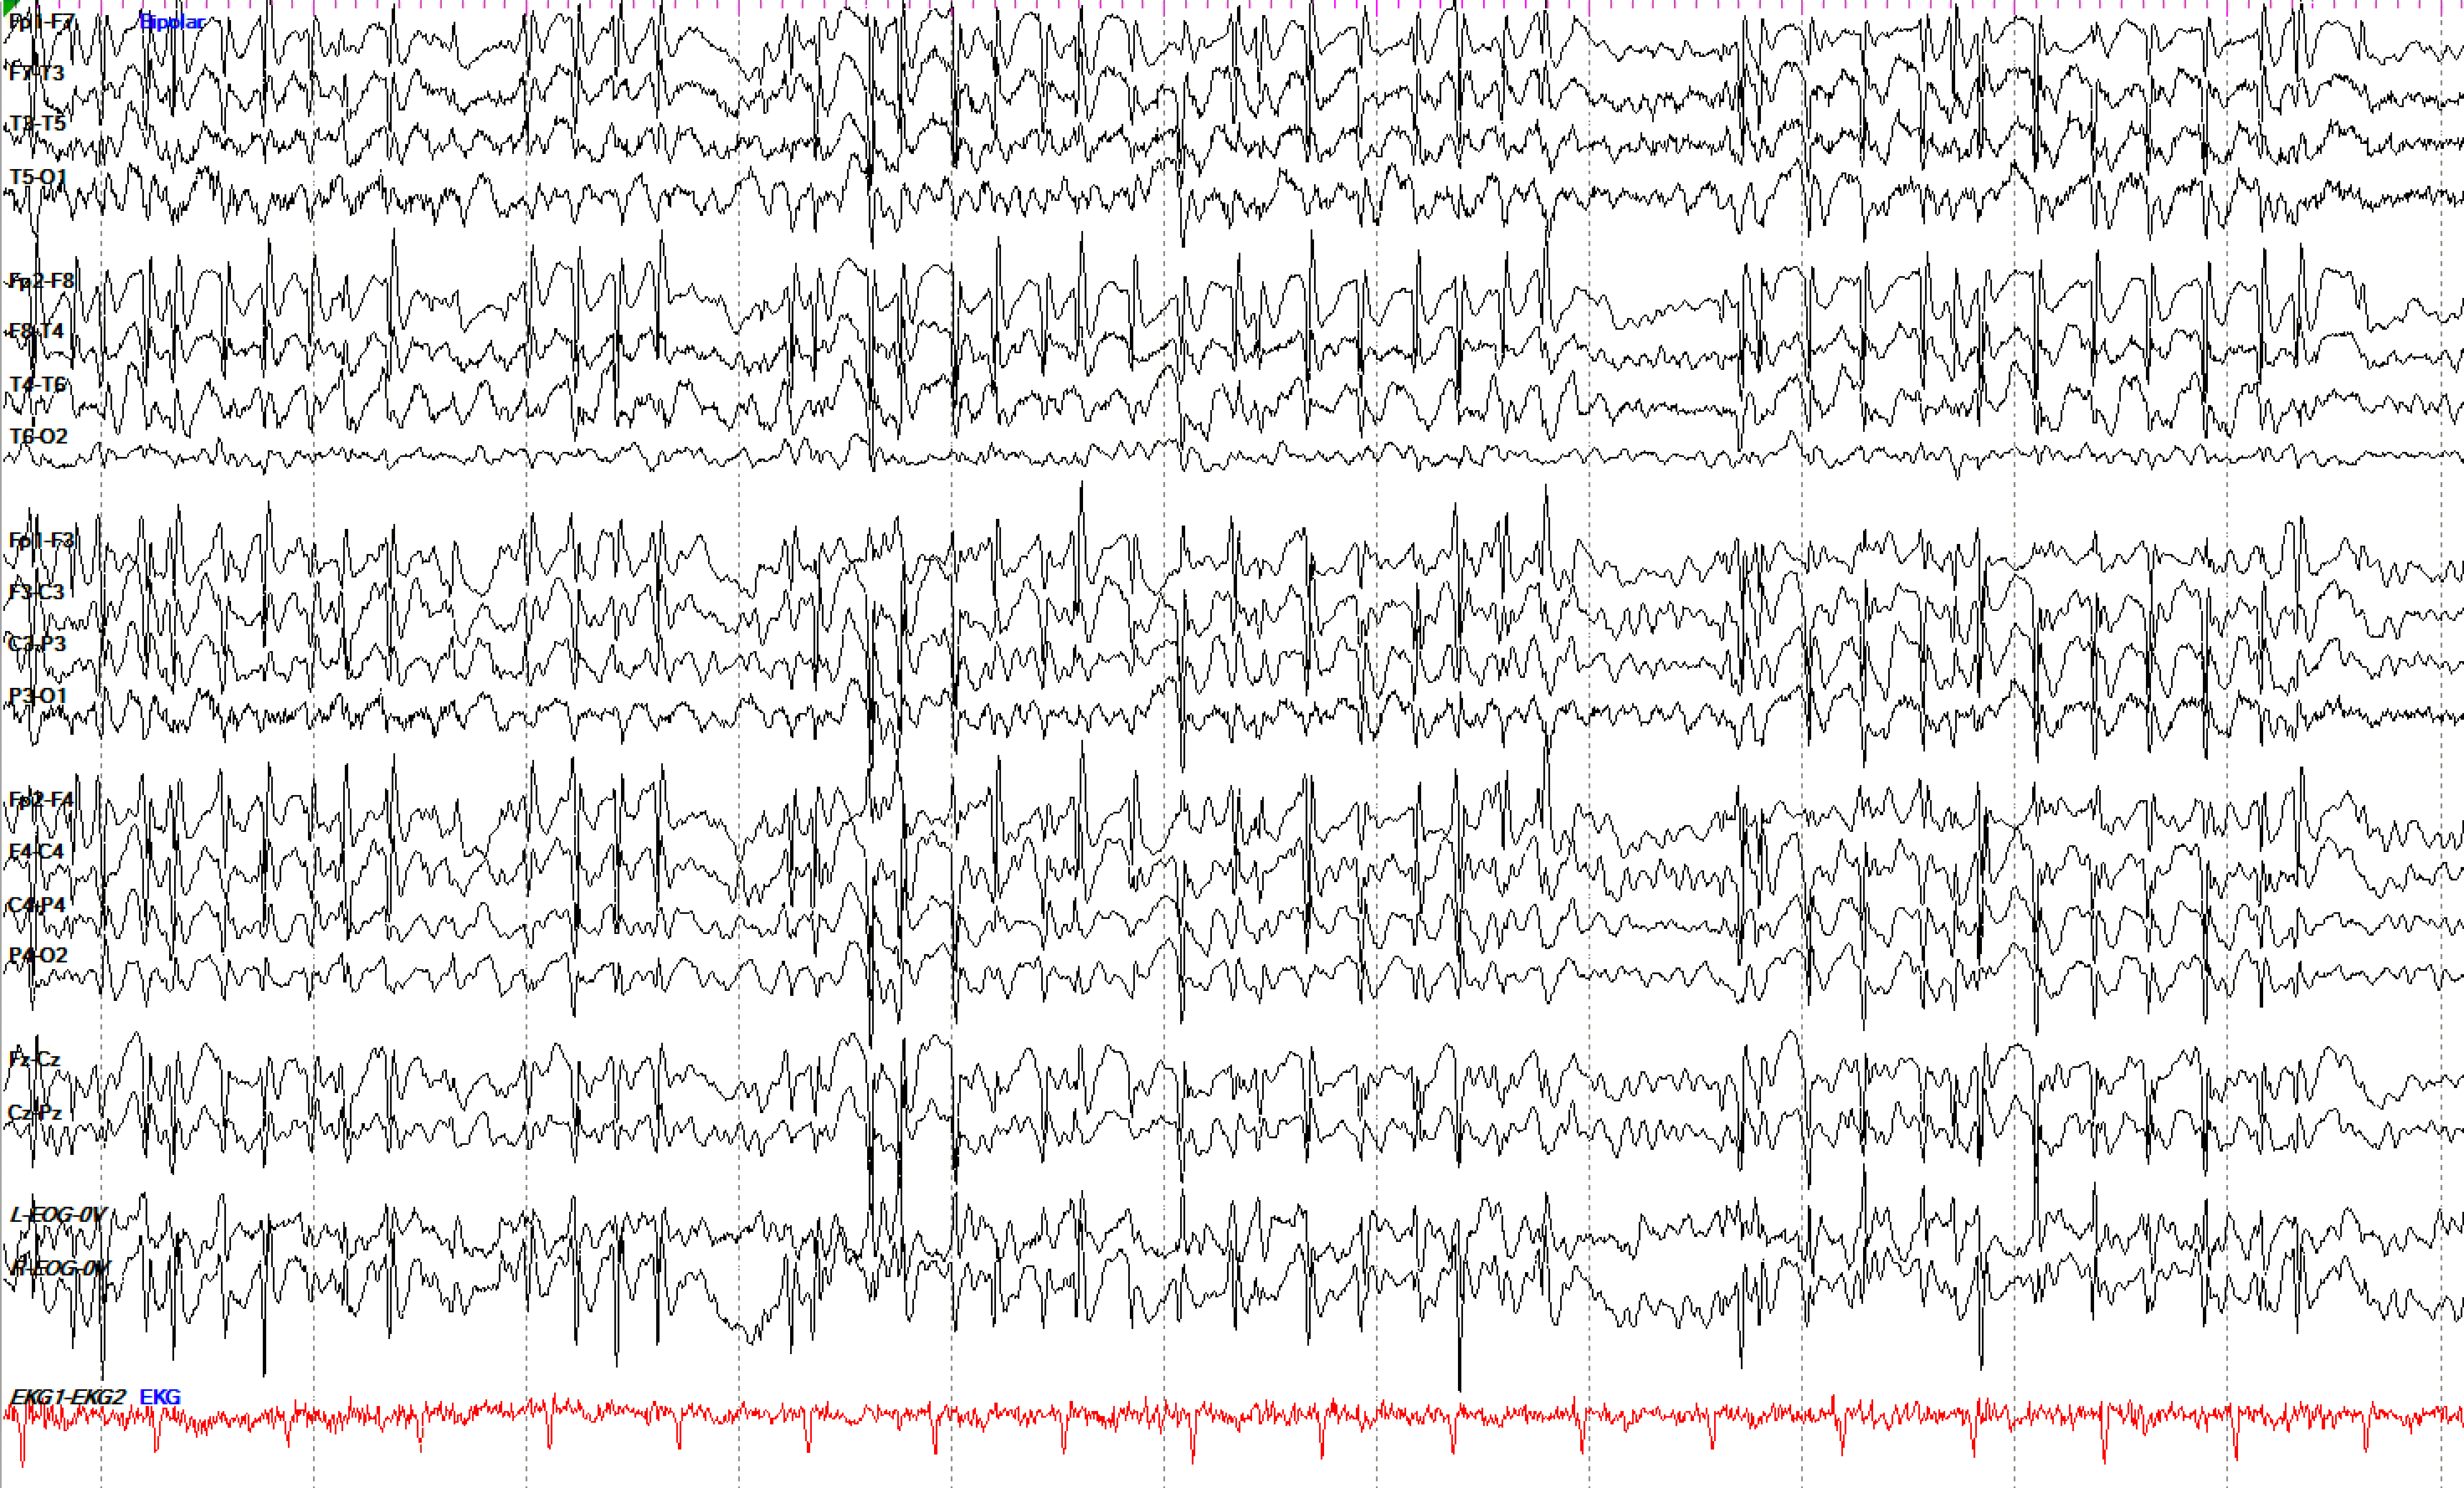
When a periodic pattern exceeds 2.5 Hz for 10 or more seconds it shifts from being on the IIC to being overt seizure activity, as seen here.
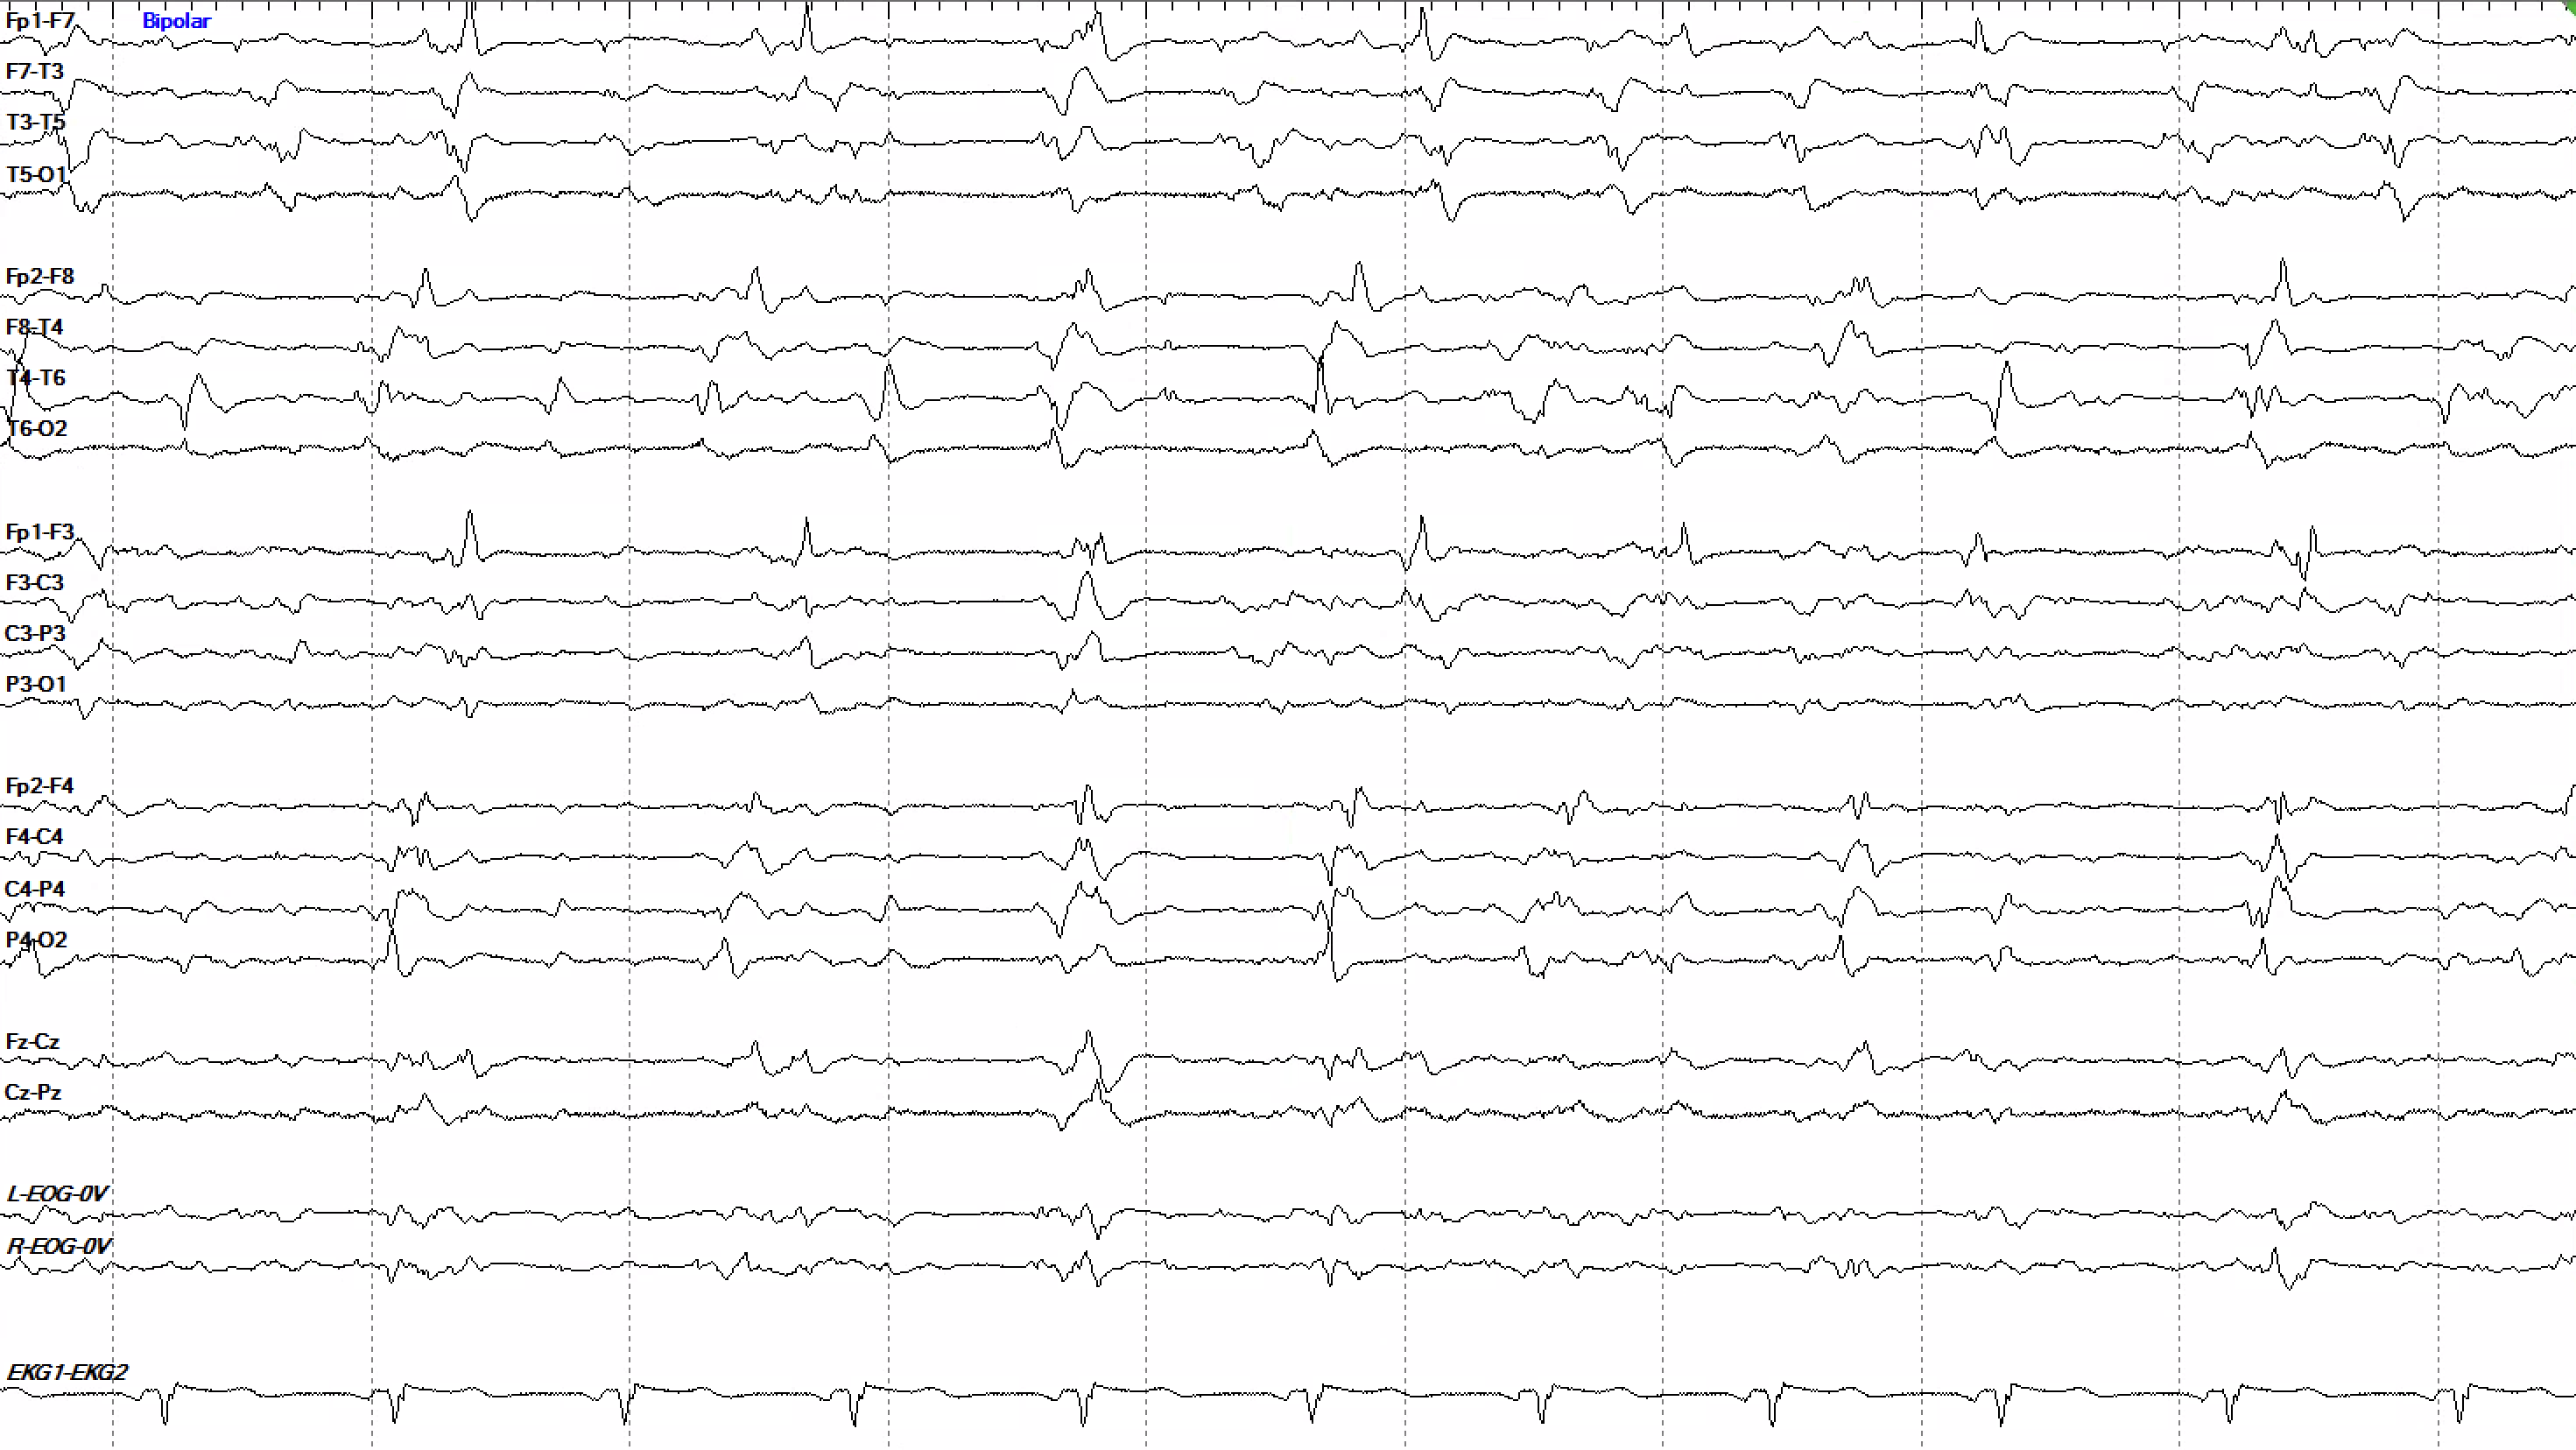
You may encounter tracings that appear to have two discrete periodic sets of discharges, one on the left side and one on the right; these can be either a single population with one hemisphere slower (asynchronous GPDs), or two truly discrete populations (bilateral independent periodic discharges, BIPDs). Looking for similar asynchronicity elsewhere in the recording can help clarify.
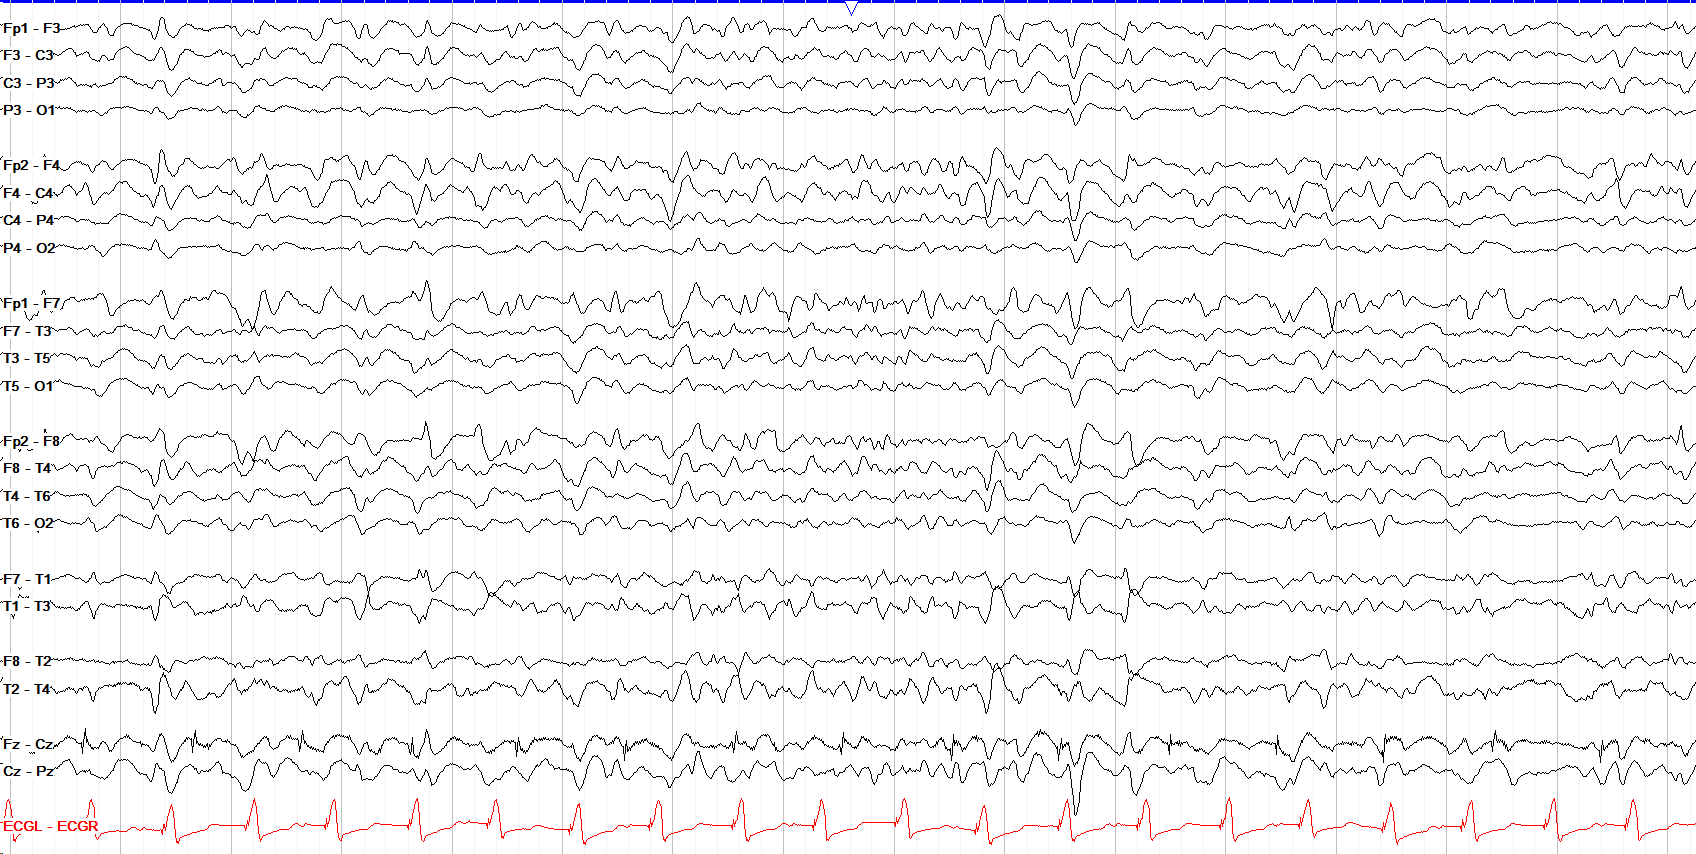
This shows a disorganized, mostly theta background, consistent with moderate generalized slowing. We also see some generalized periodic discharges around 1 Hz; most are poorly formed but with some we do see the classic triphasic shape and AP lag.
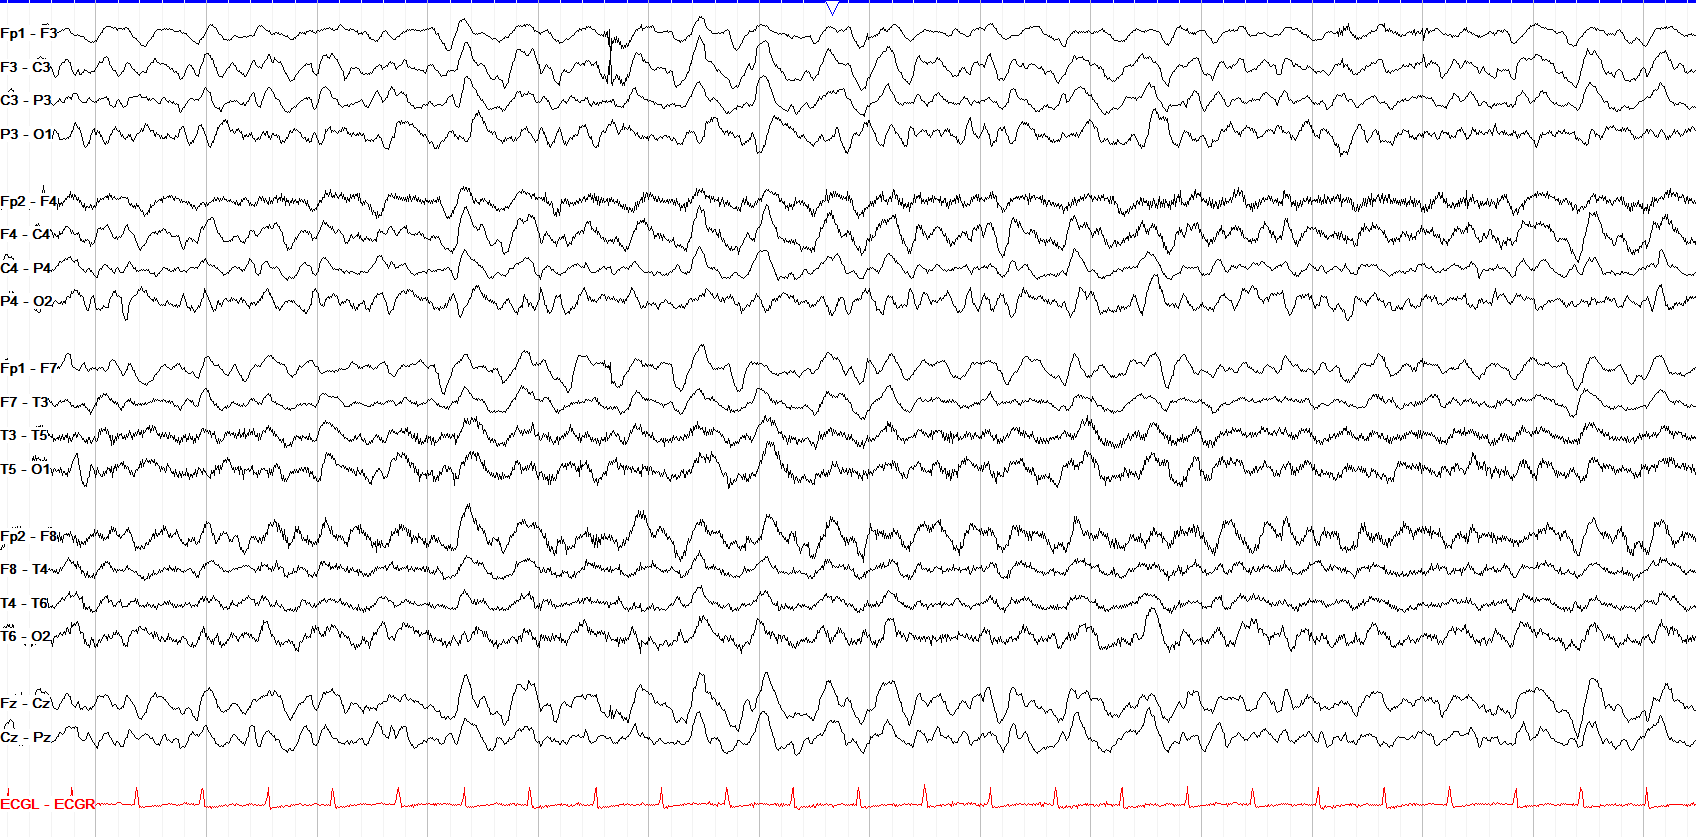
Rhythmic and periodic patterns are not always perfectly distinct, as we see here with a run of frontally predominant GRDA (previously termed FIRDA) among which there is the suggestion of poorly formed GPDs with triphasic morphology (three phases, AP lag).
lateralized rhythmic delta
3 patterns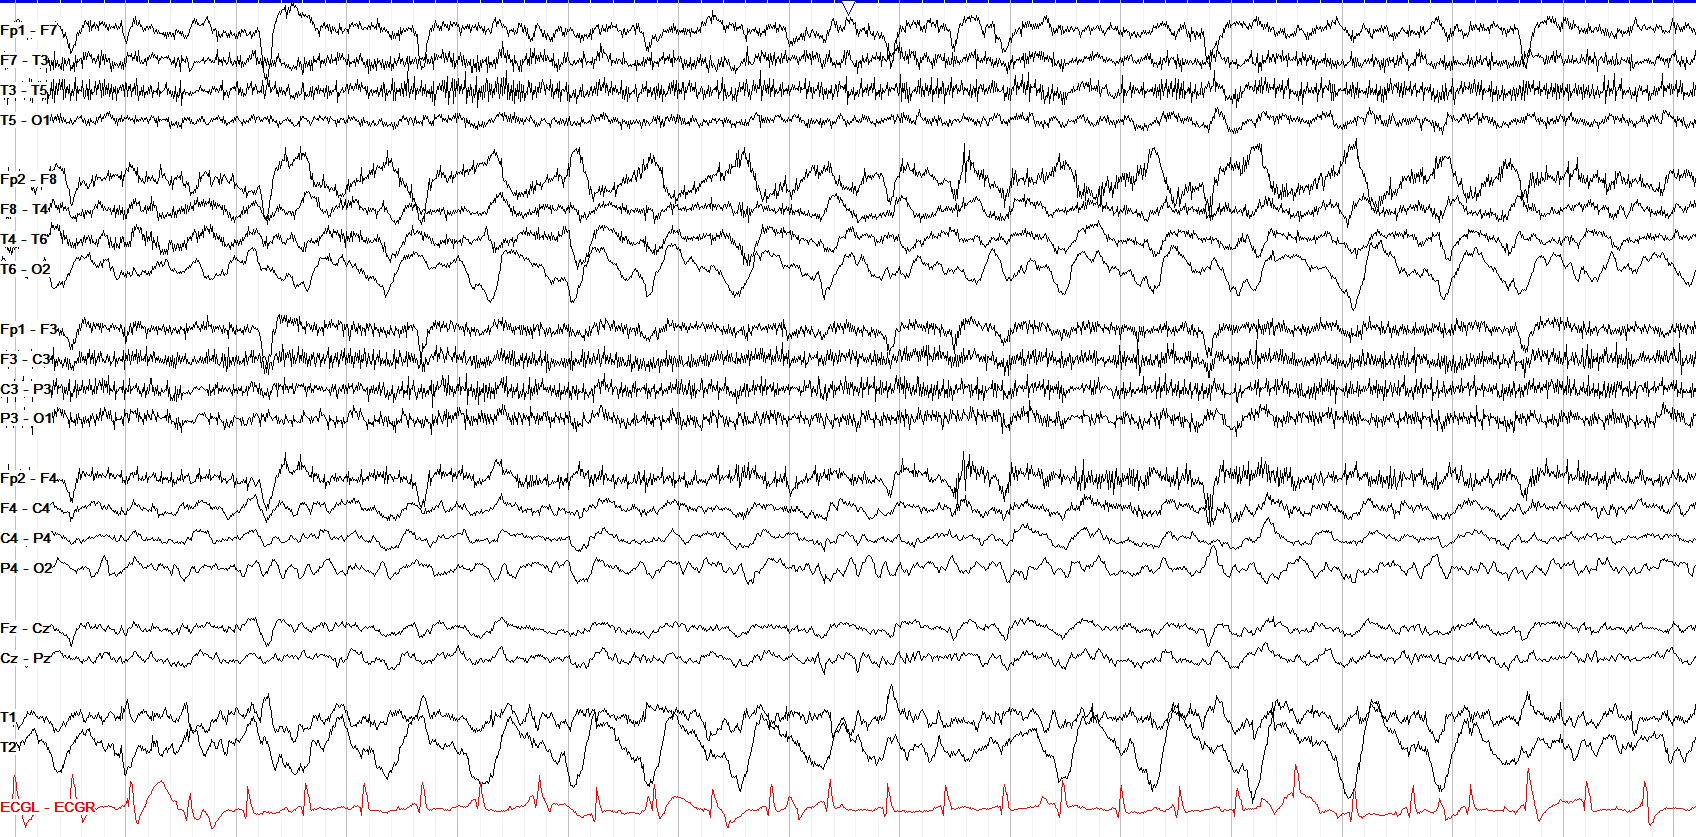
Lateralized rhythmic delta activity sits above GPDs on the IIC and suggests underlying cortical irritability. Any evolution suggests shift into more overt seizure activity.
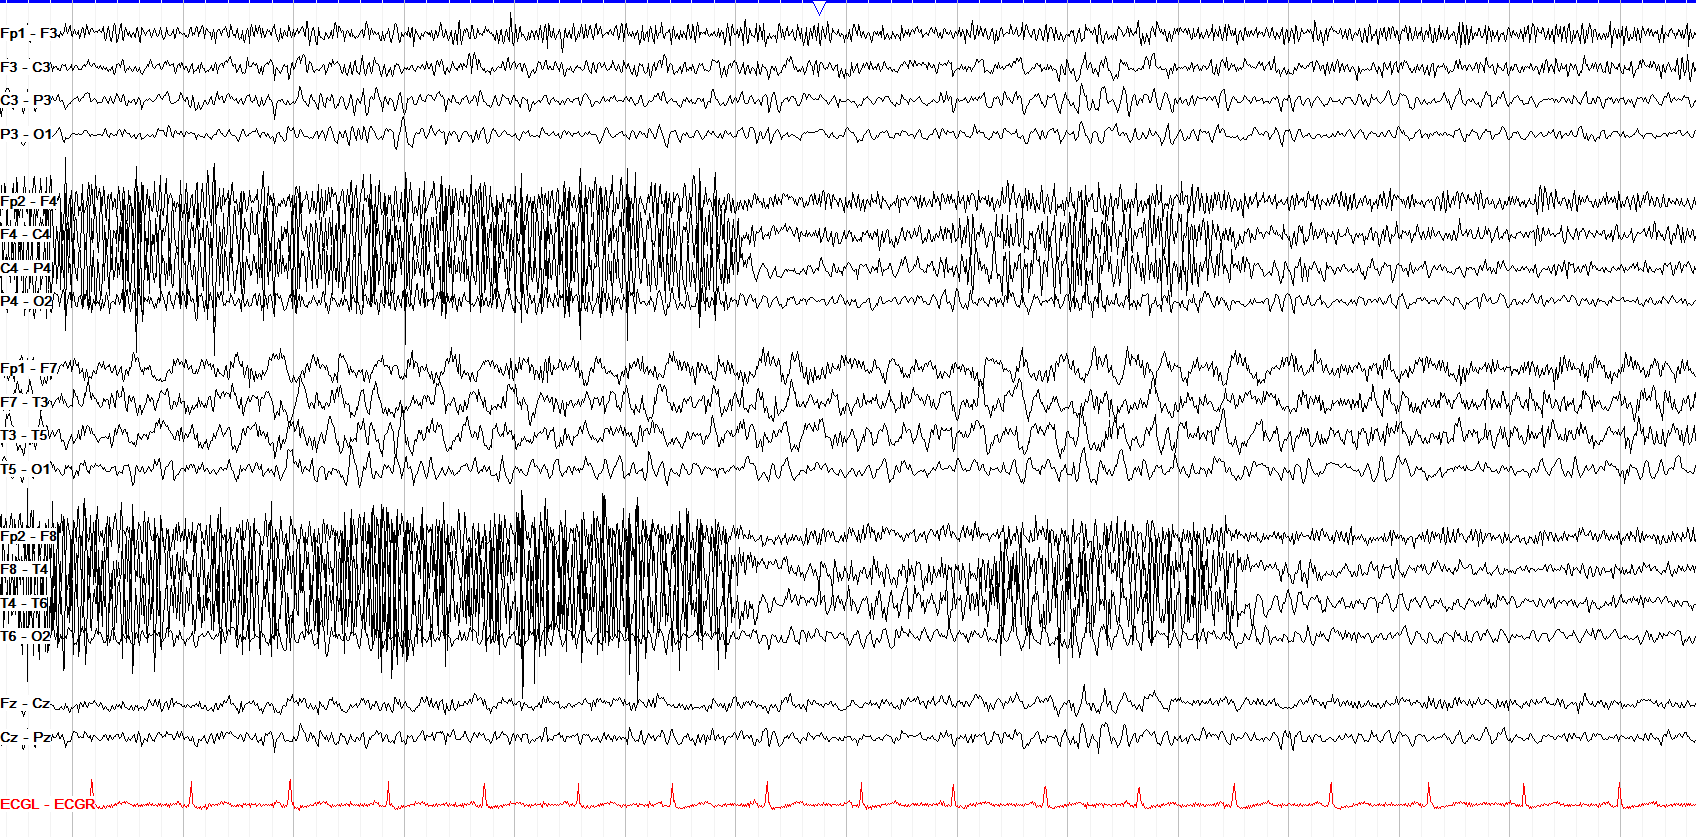
Temporal lateralized rhythmic delta activity used to be termed temporal intermittent rhythmic delta activity (TIRDA). It is commonly associated with underlying ipsilateral mesial temporal lobe epilepsy.
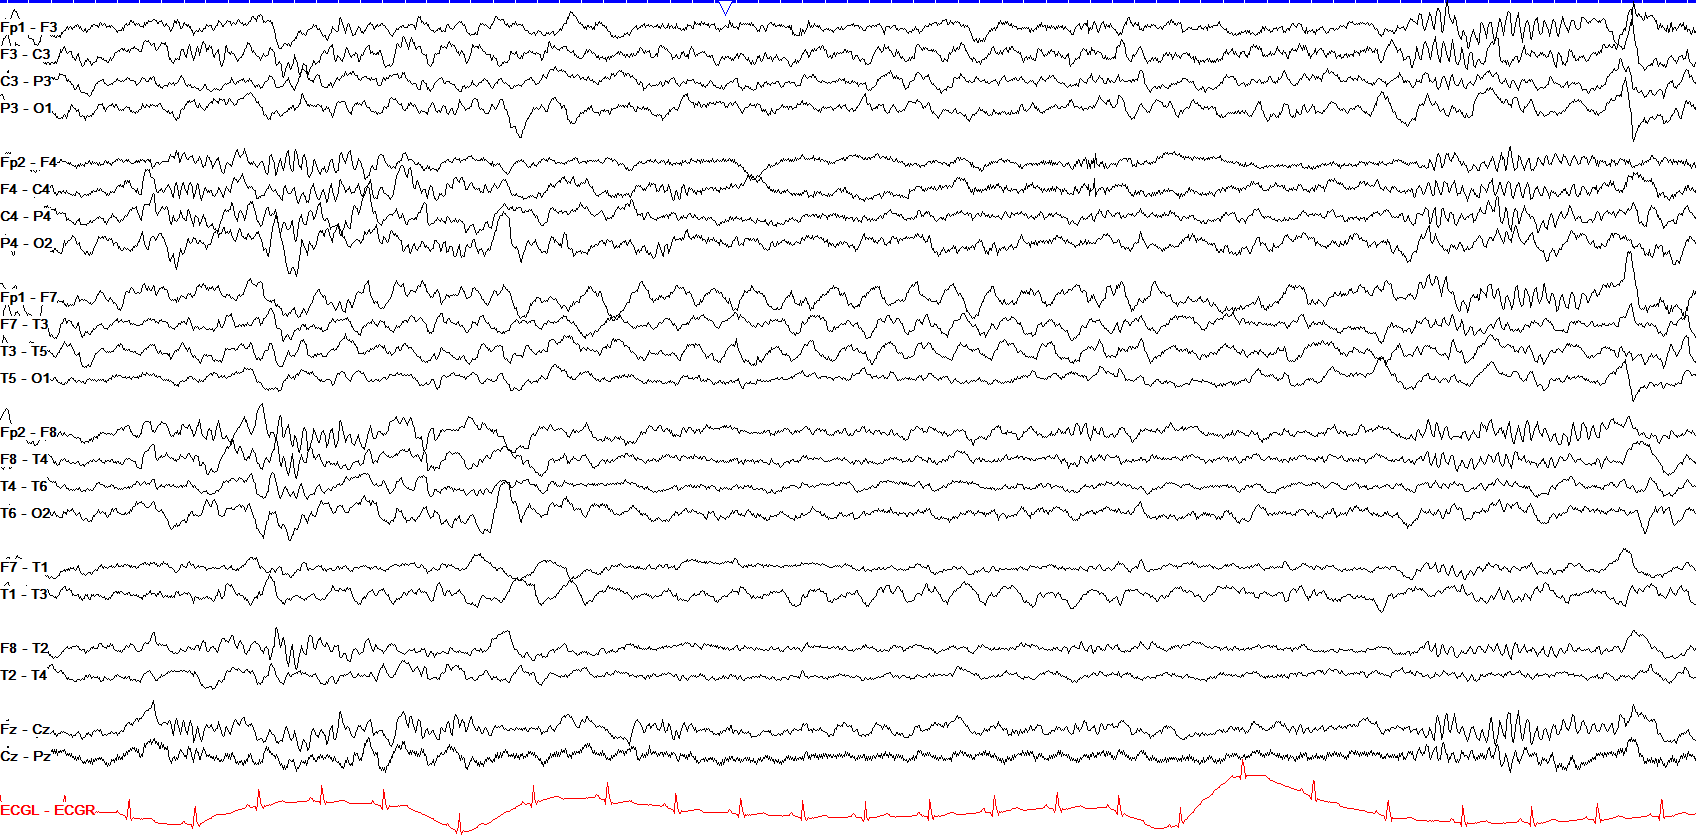
Rhythmic delta activity is abnormal in both the waking and sleeping states. While slow wave sleep has high amplitude diffuse rhythmic delta at times, it should not be focal or lateralized.
lateralized periodic discharges
3 patterns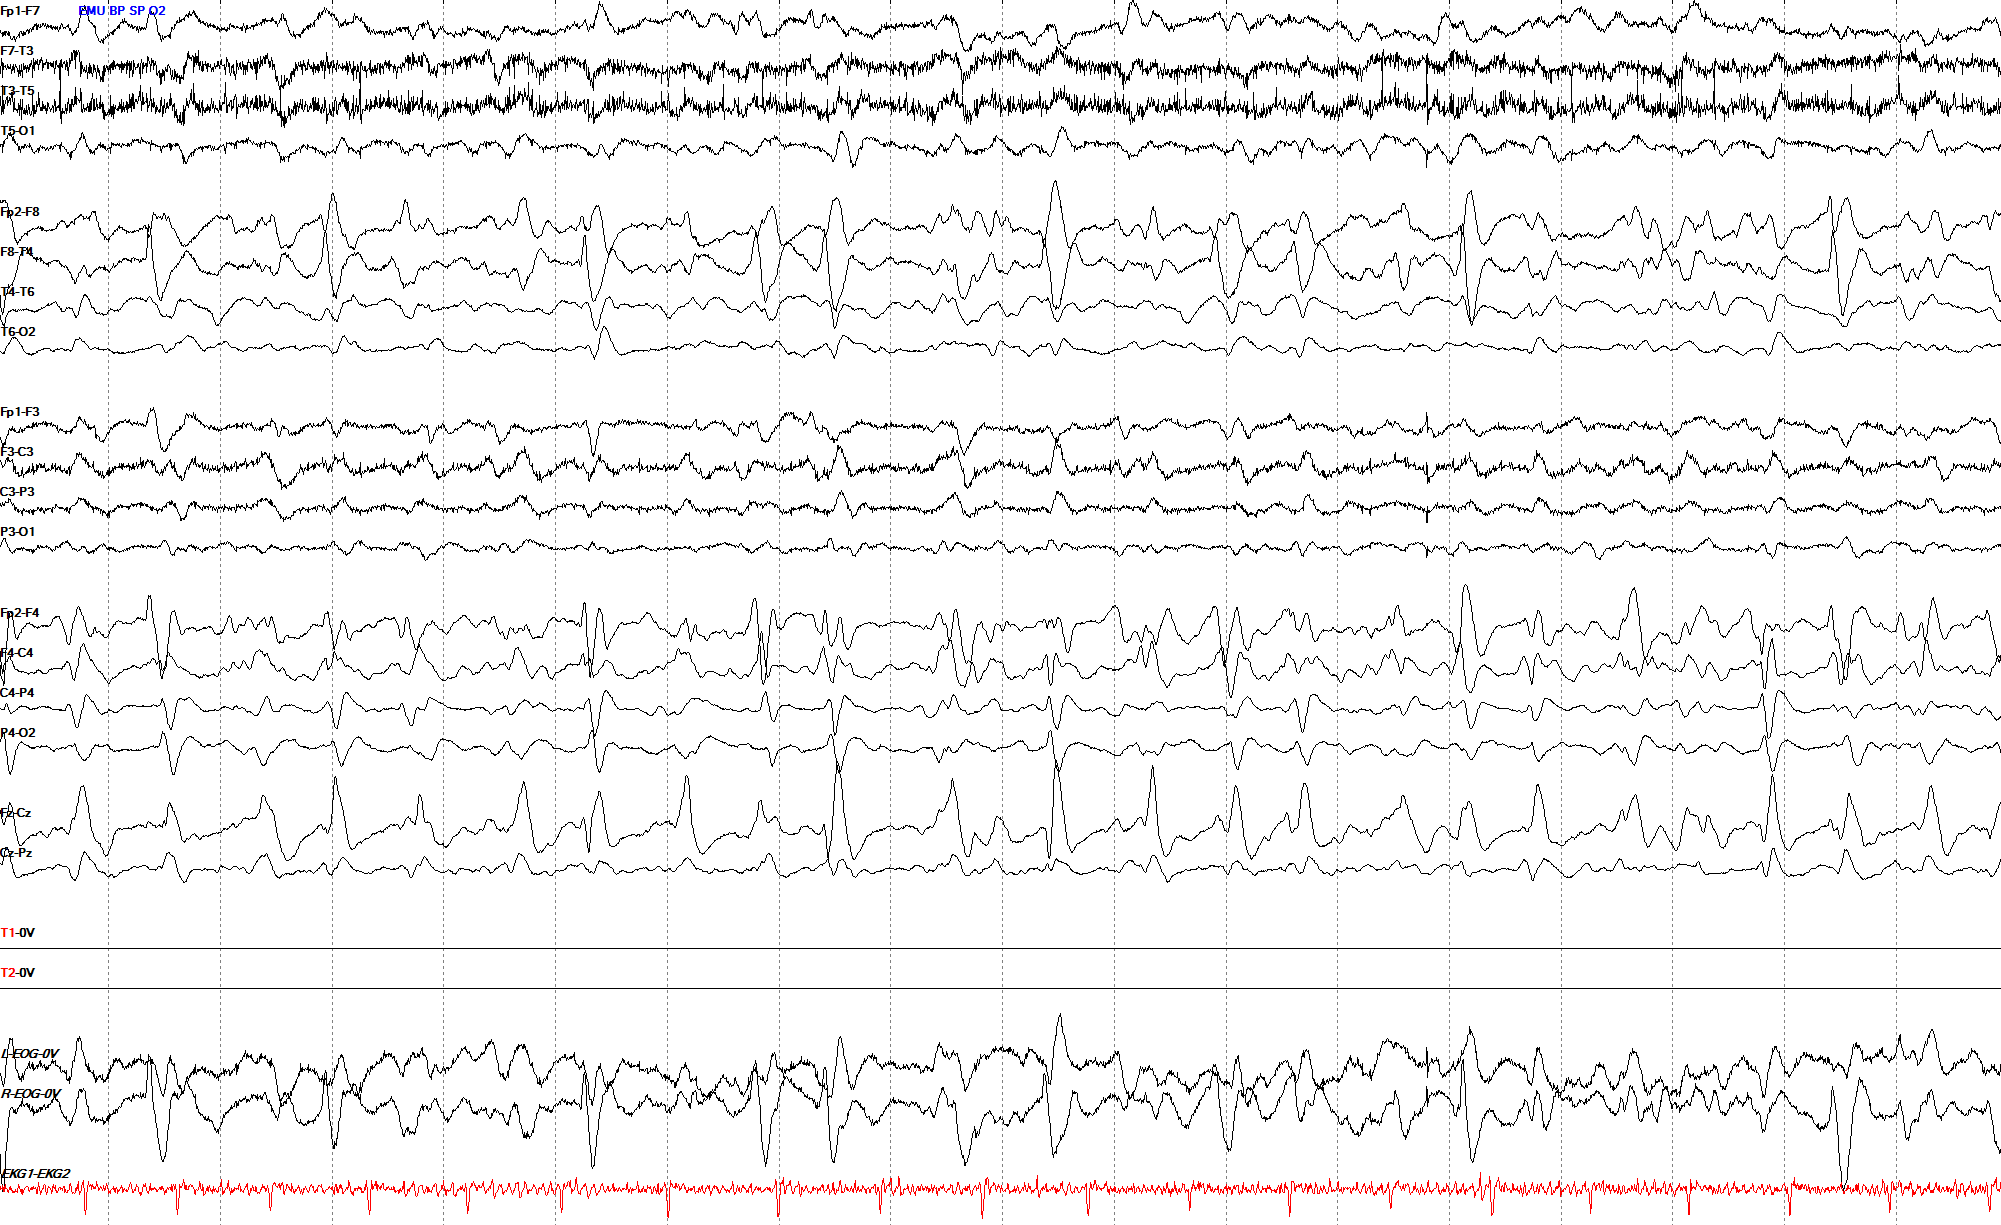
Lateralized periodic discharges (LPDs) sit fairly high on the IIC and suggest prominent underlying cortical irritability. They can often arise in the acute setting of underlying strokes, tumors, bleeds and more.
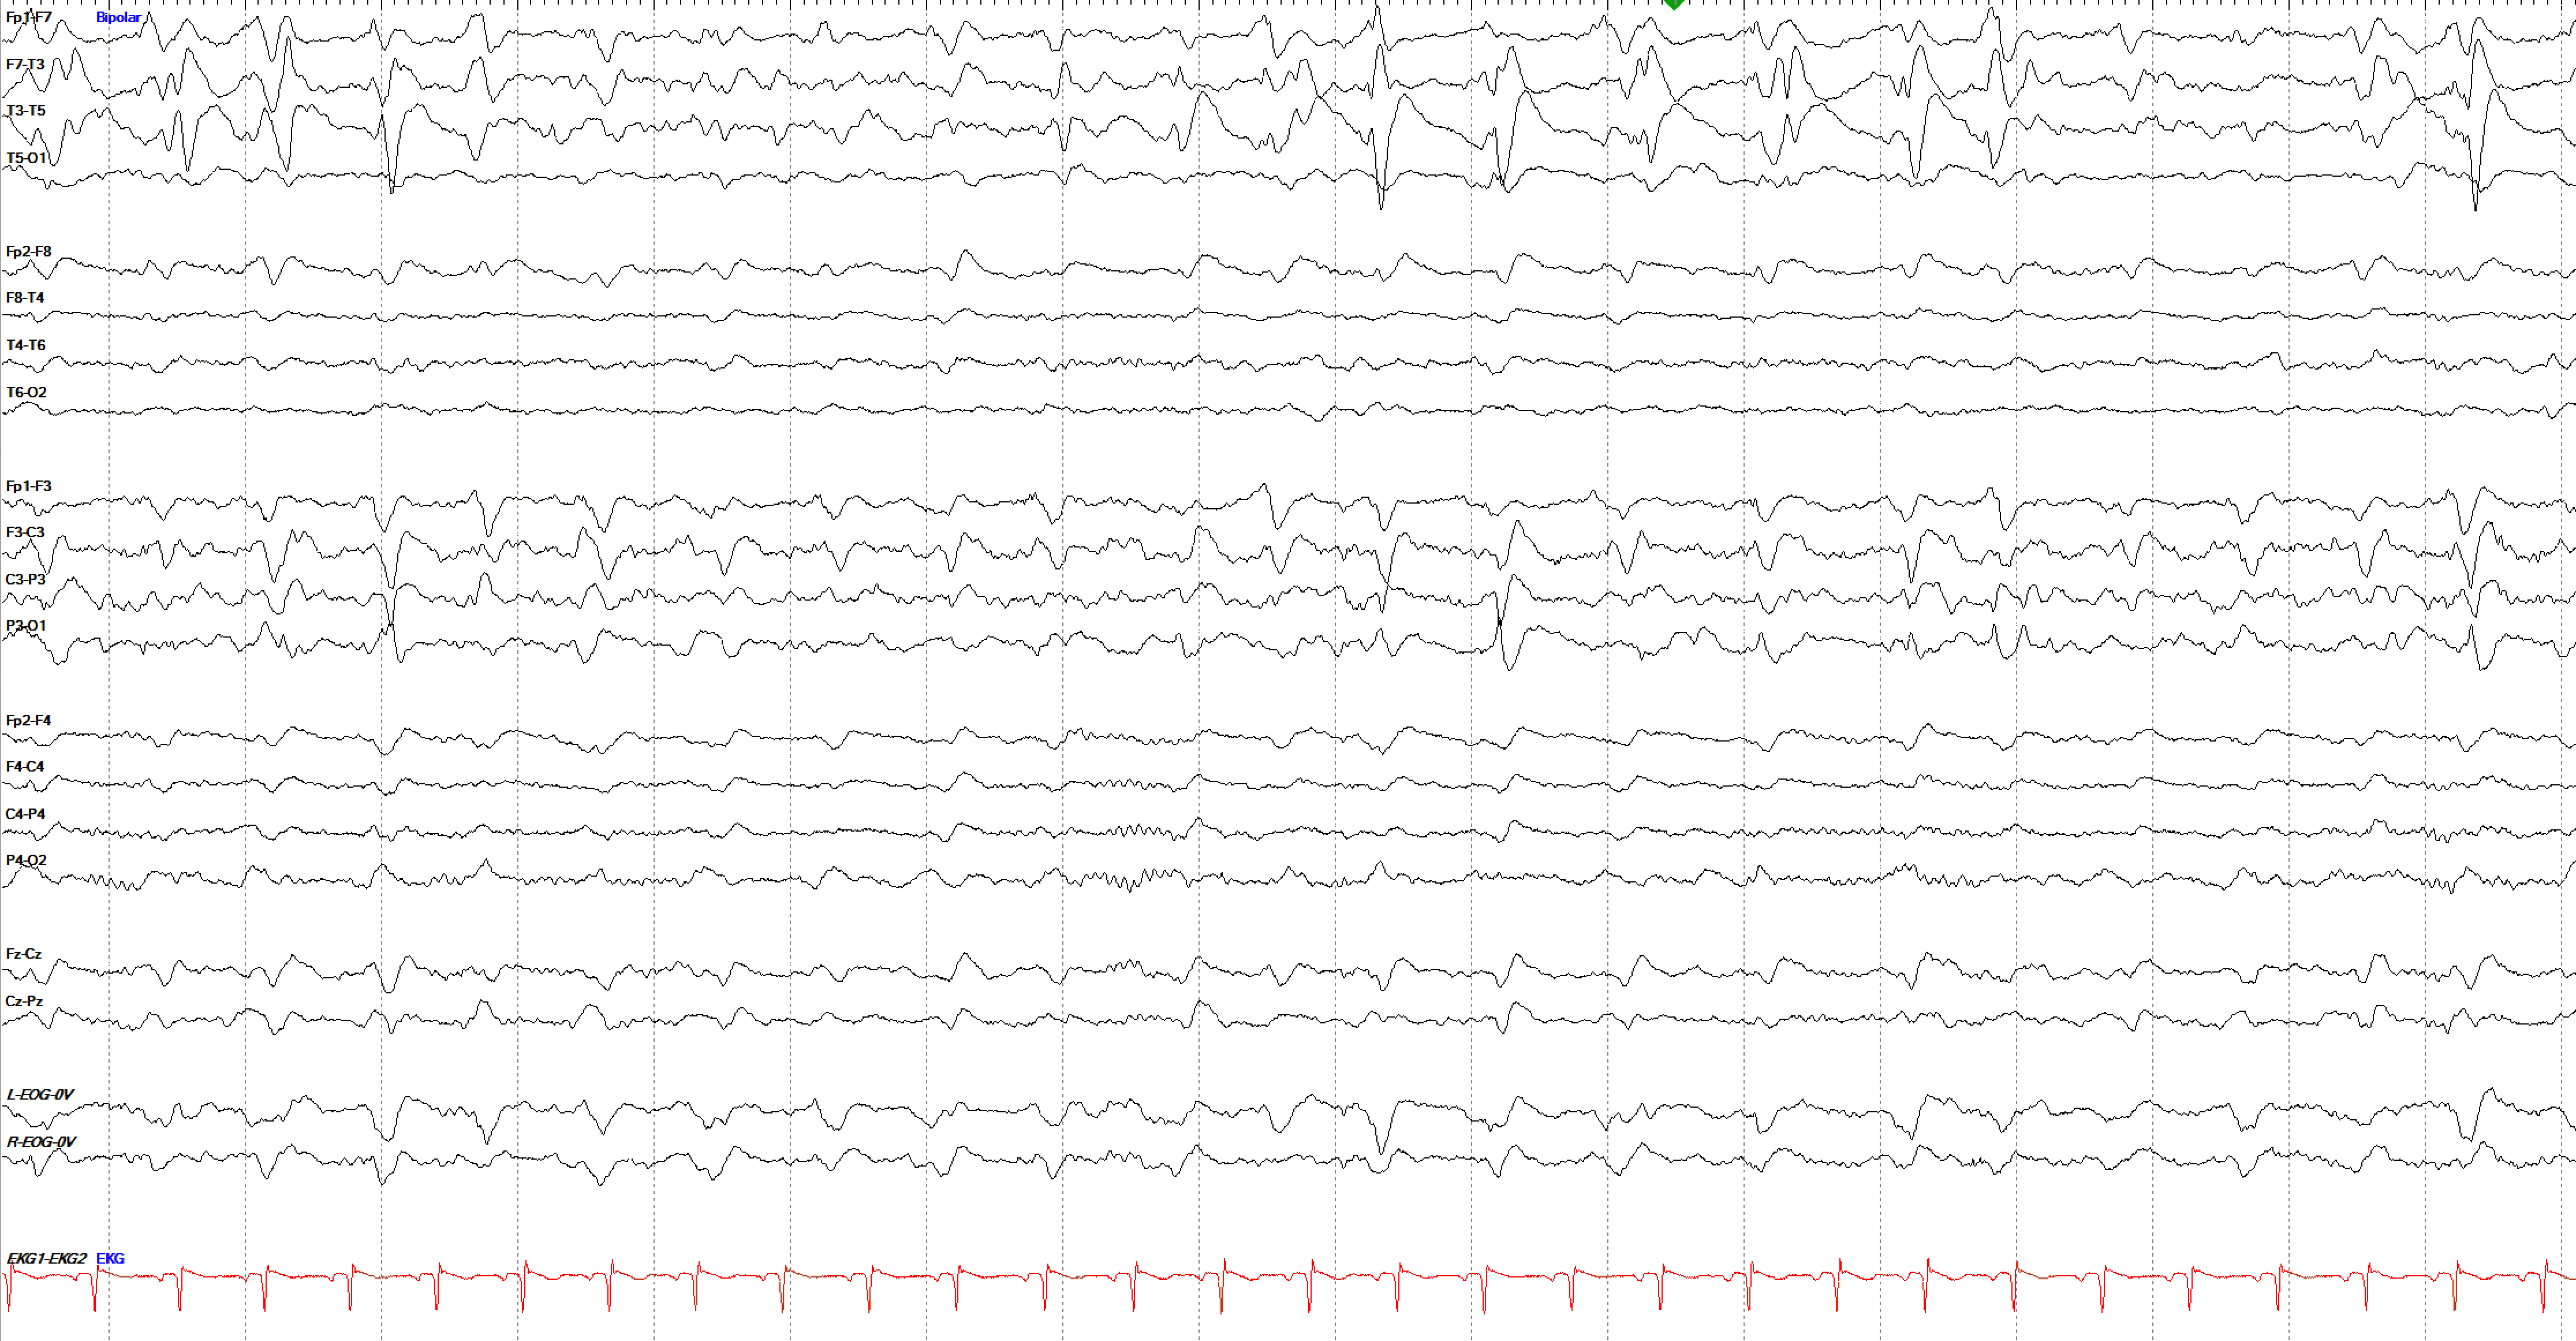
Similar to rhythmic patterns and GPDs, LPDs can show superimposed sharp (+S) or fast (+F) activity, which pushes it higher on the IIC toward seizure risk. Any LPDs that exceed 2.5 Hz for ten or more seconds are considered overt seizure.
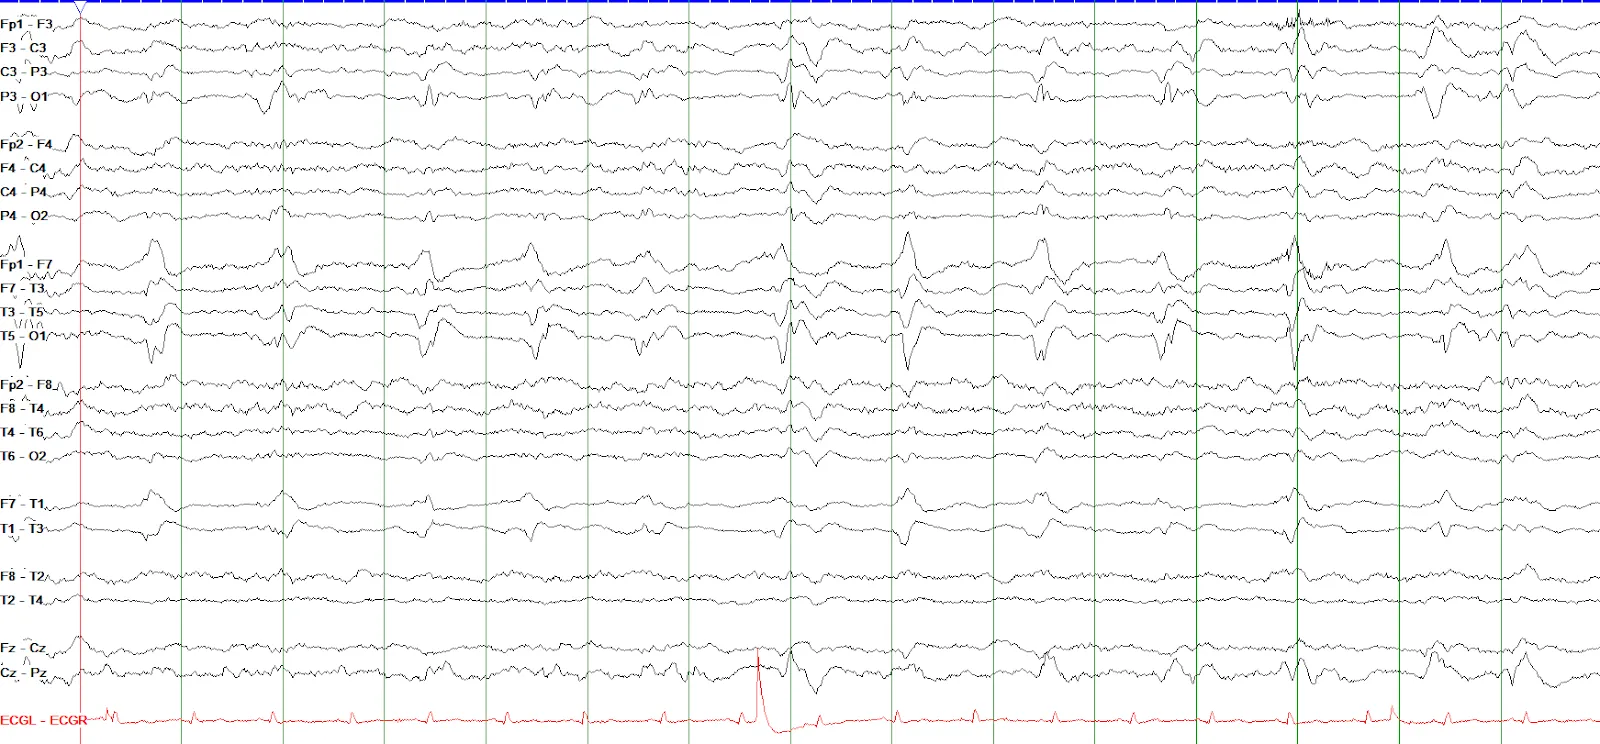
Lateralized periodic discharges were previously termed periodic lateralized epileptiform discharges (PLEDs). Temporal predominant LPDs can be often seen with herpes simplex encephalitis (HSE).
brief potentially ictal rhythmic discharges
2 patterns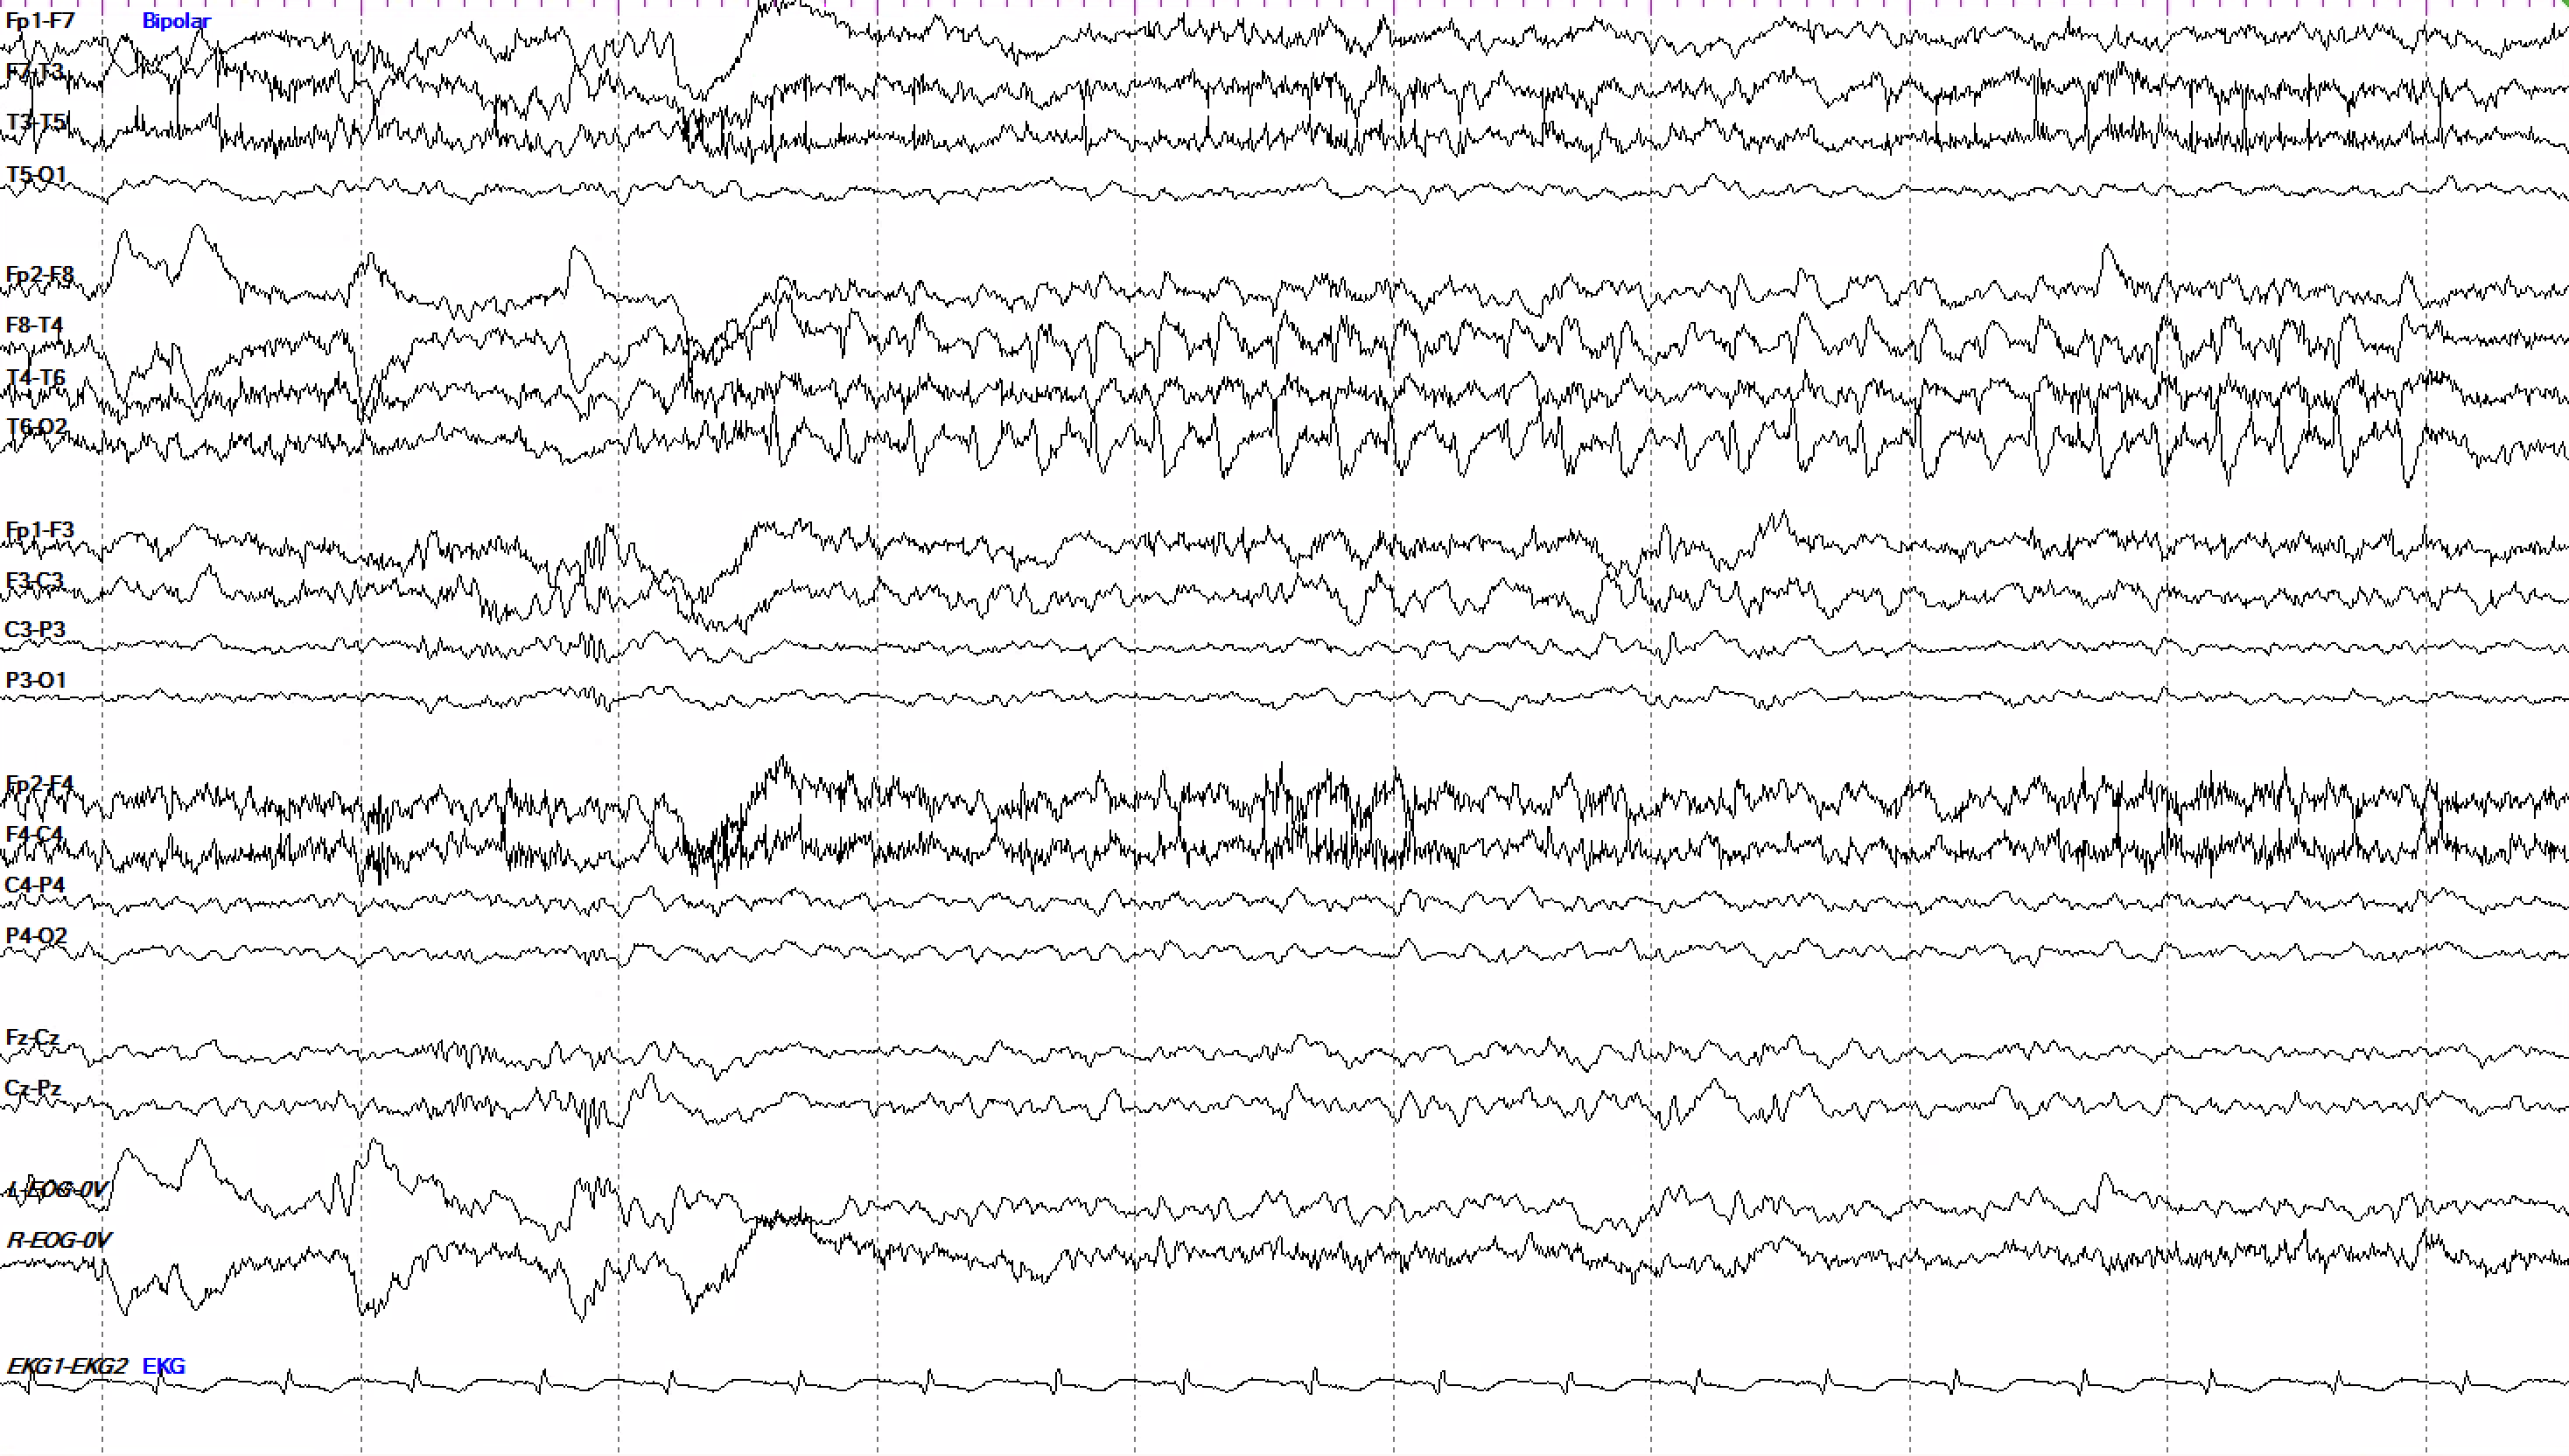
Brief potentially ictal rhythmic discharges (BIRDs) are ictal-appearing rhythms faster than 4 Hz and shorter than ten seconds. They aren’t a seizure but are very close to one on the IIC, due only to their brevity.
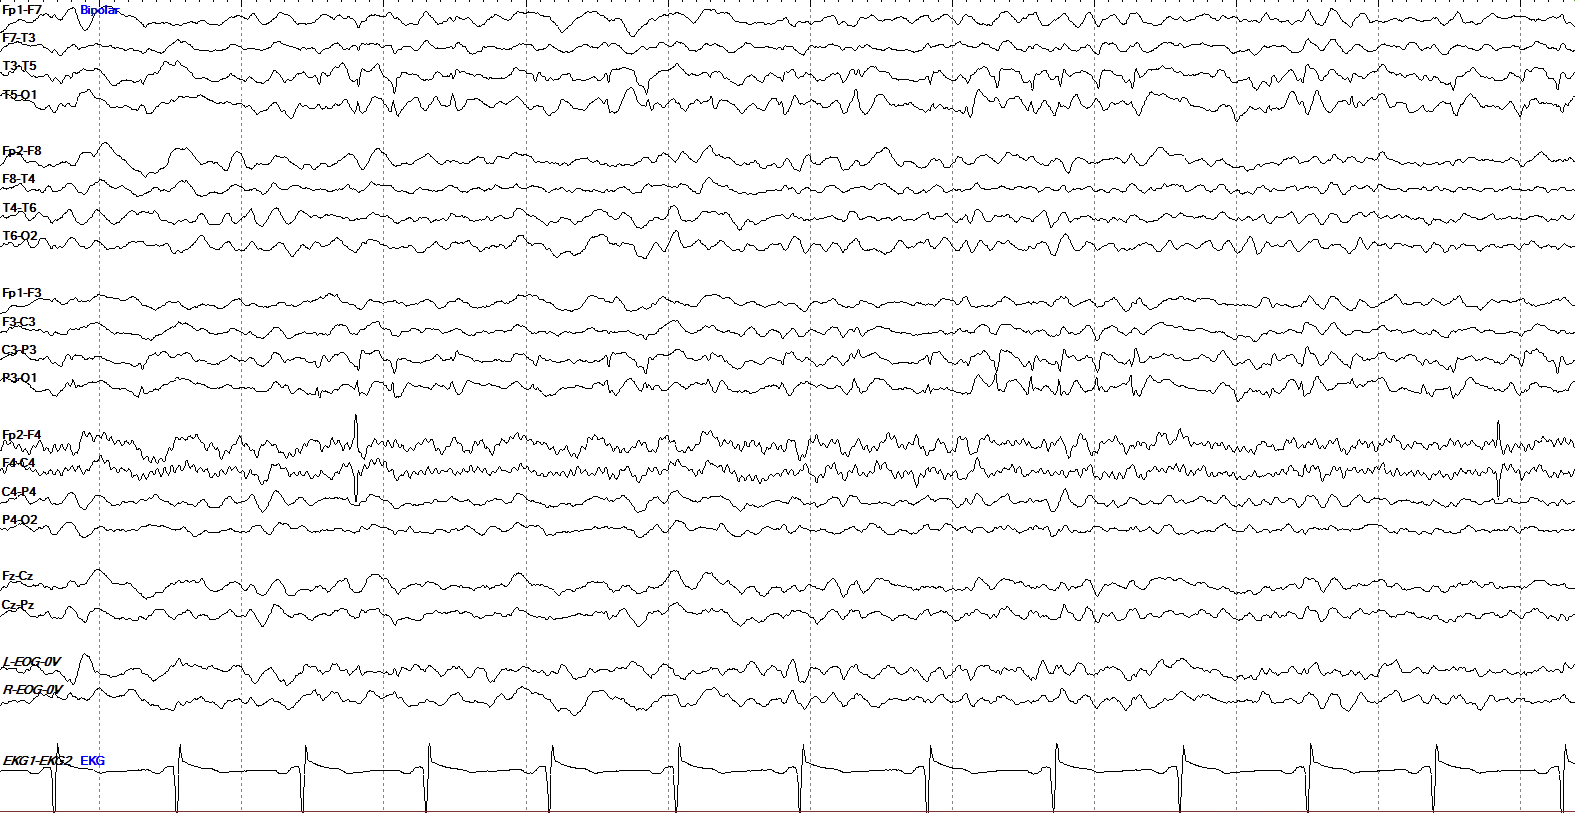
BIRDs that clearly evolve or resemble a patient’s own interictal discharges or seizures are definite BIRDs, while those that don’t but are sharply contoured are termed possible BIRDs.
focal seizures
4 patterns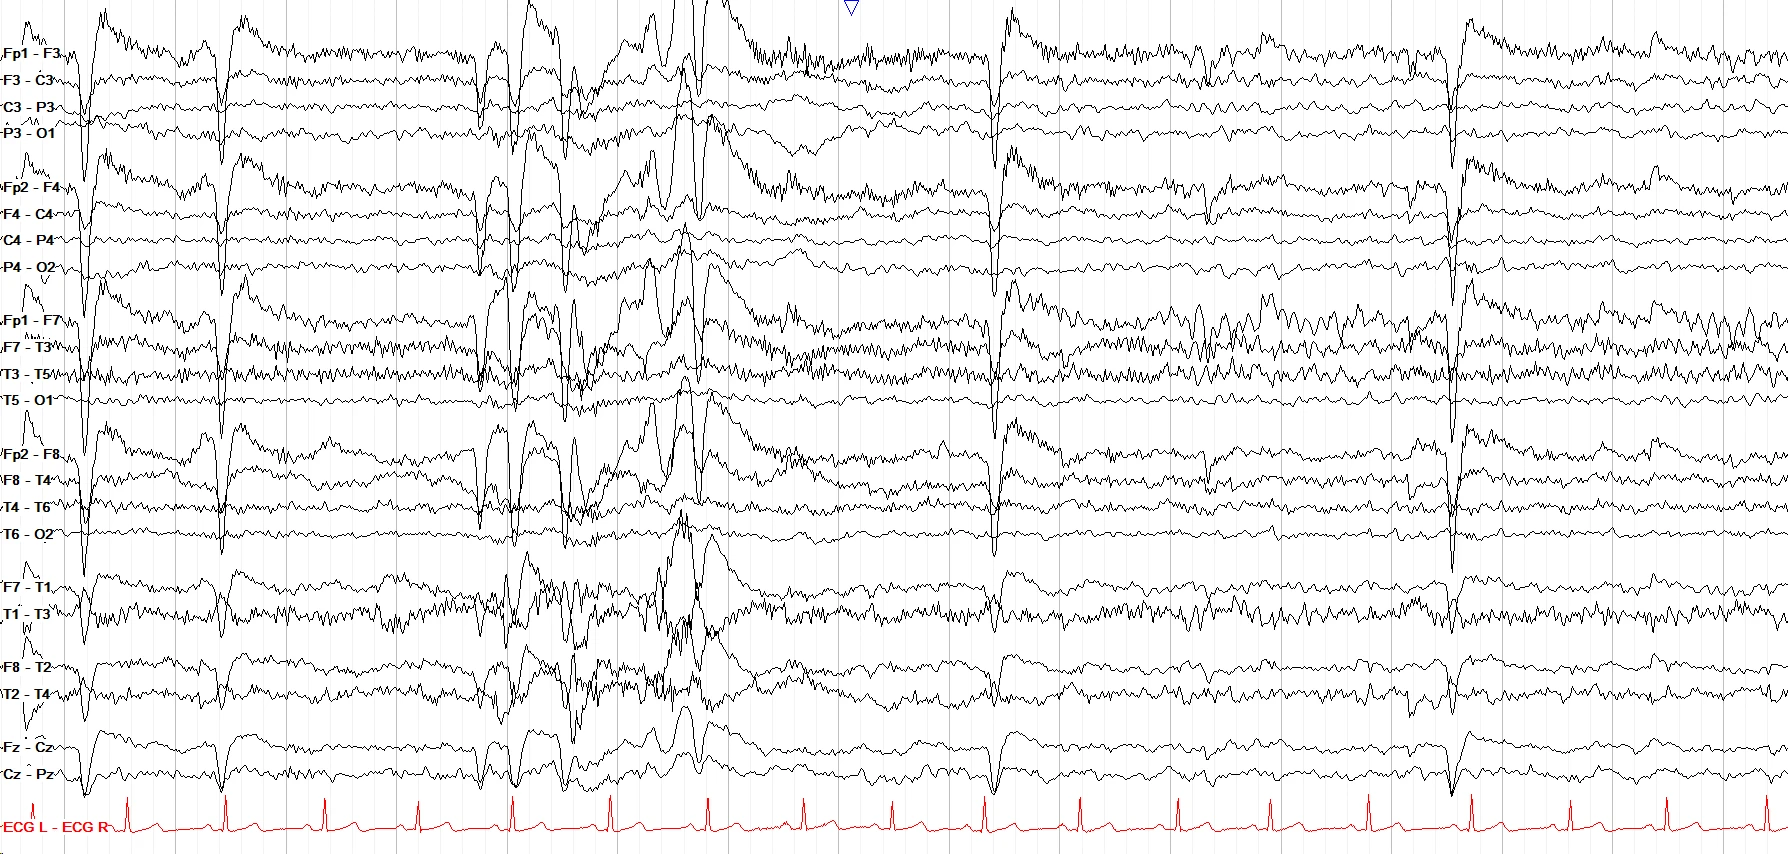
Sharply contoured alpha activity begins in the left temporal region, which spreads into the parasagittal chain and slows in frequency to about 2-3 Hz while increasing in amplitude and evolving in morphology to frank spike and slow waves. Note that the left mid-temporal beta activity seen prior to seizure onset on the first page is also seen throughout this patient's tracing not associated with seizures, but low amplitude beta activity like that can sometimes be the seizure onset itself.
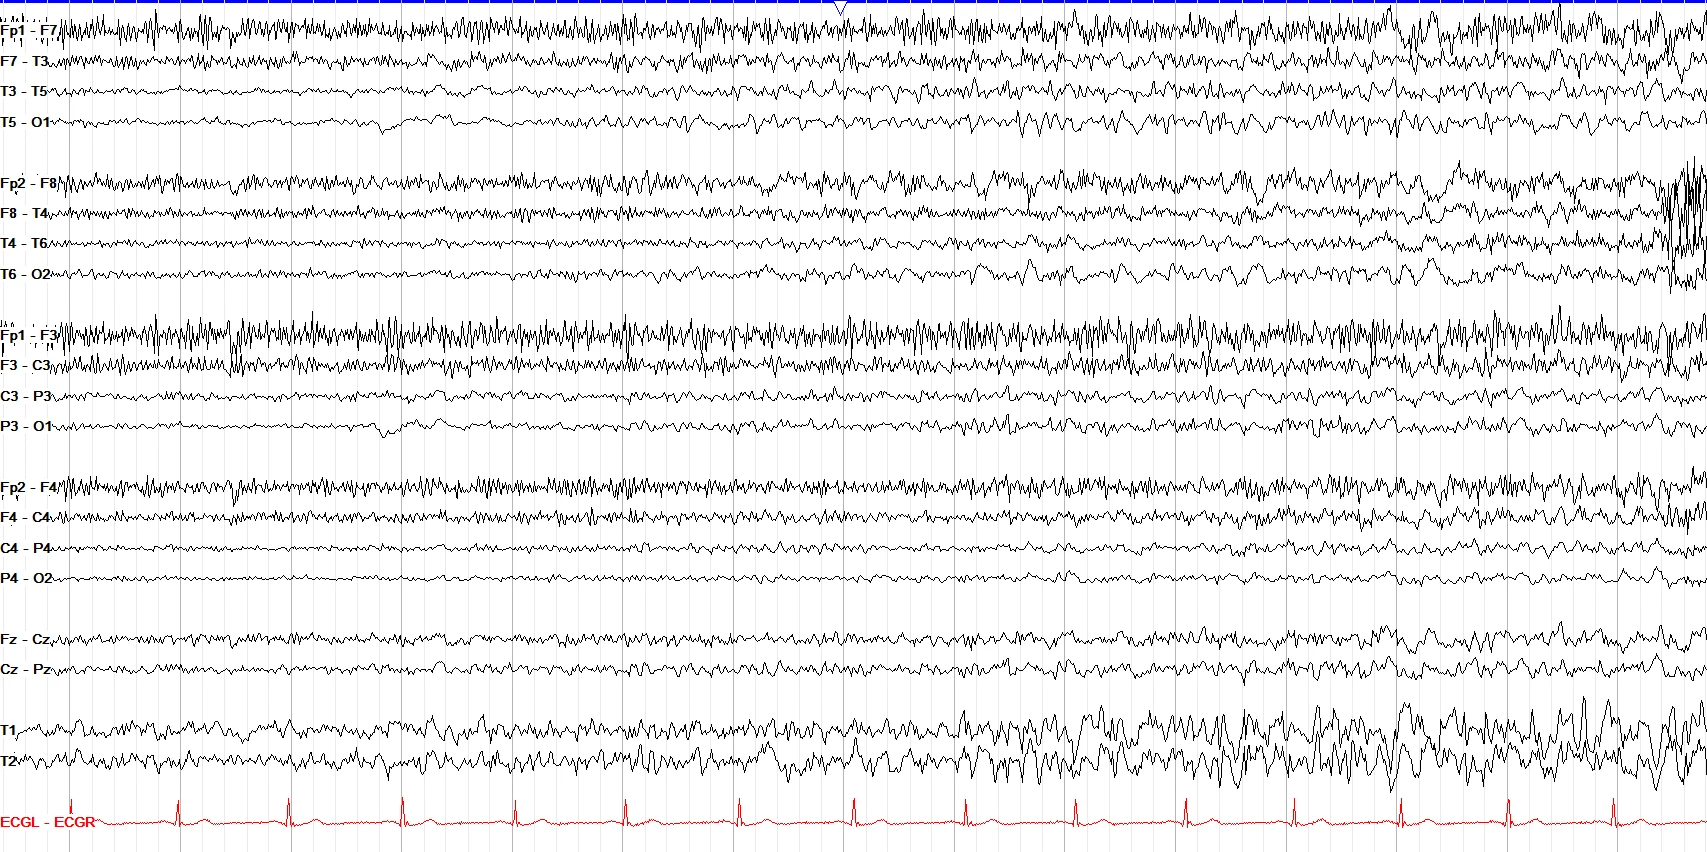
Sharply contoured alpha activity begins over the left posterior quadrant, more temporally, that evolves to rhythmic theta spikes with spread into the right posterior temporal region; after brief obscuration by myogenic artifact, rhythmic 4-5 Hz spike wave activity arises bilaterally; the left sided activity increases in amplitude and frequency to 6 Hz, spreads through the left > right hemisphere, with generalized 3 Hz spike wave activity prior to offset.
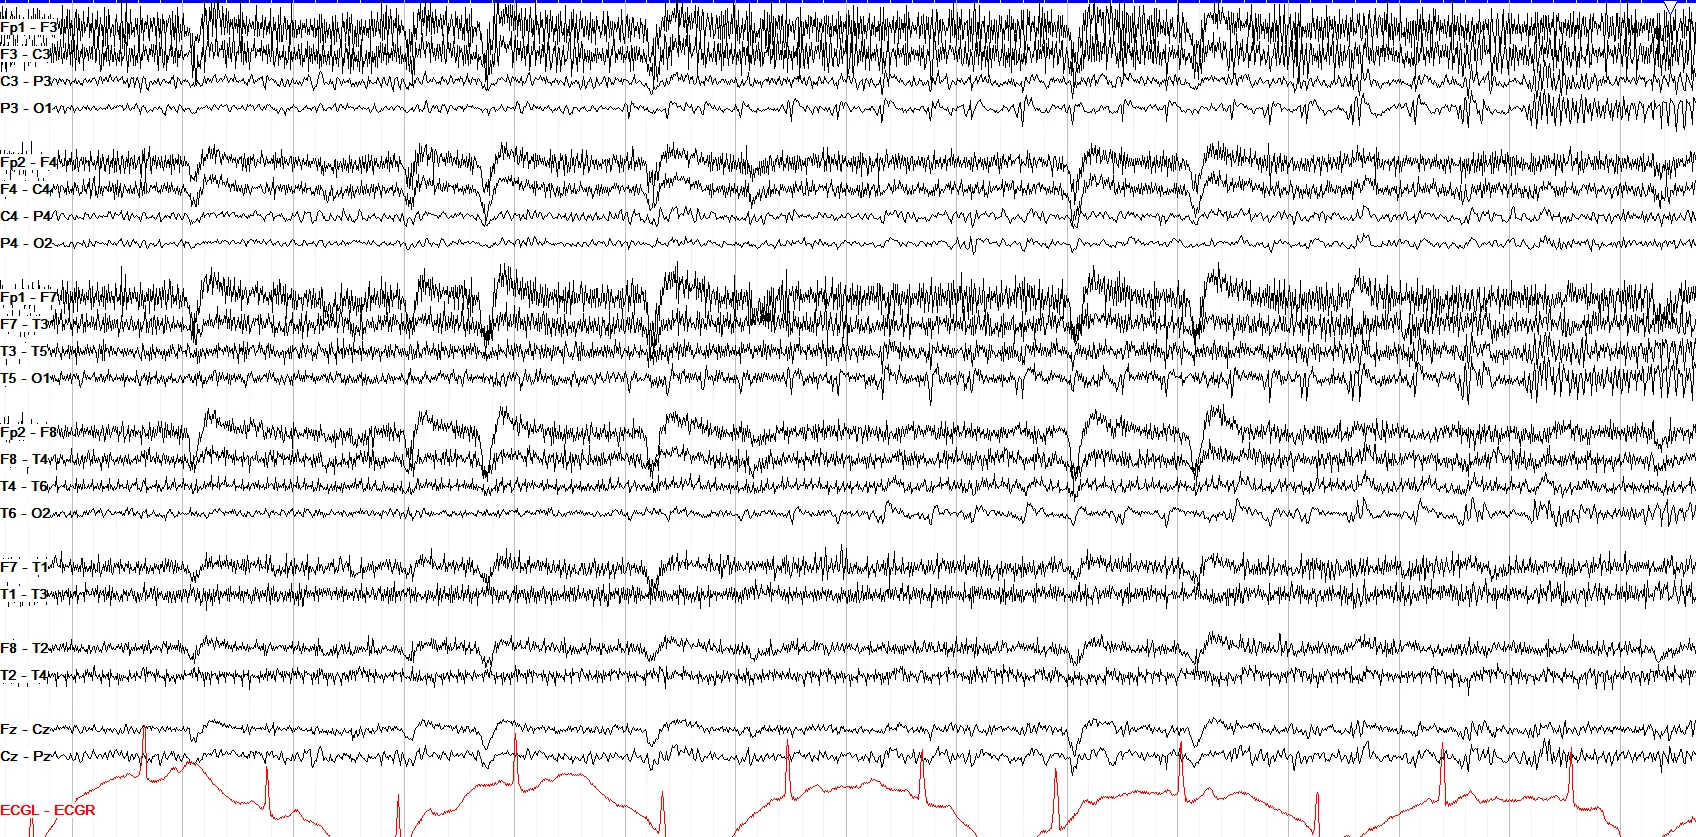
Here we have a left occipital seizure; toggle between the AP bipolar and circumferential montages to compare the same two pages in each. Note how the AP bipolar montage shows us a left sided predominance, but the circumferential montage clearly shows a phase reversal over O1, verifying that this is indeed a left occipital onset seizure, and the spiky activity seen in the right occipital region on the AP bipolar pages is just a field from the left side.
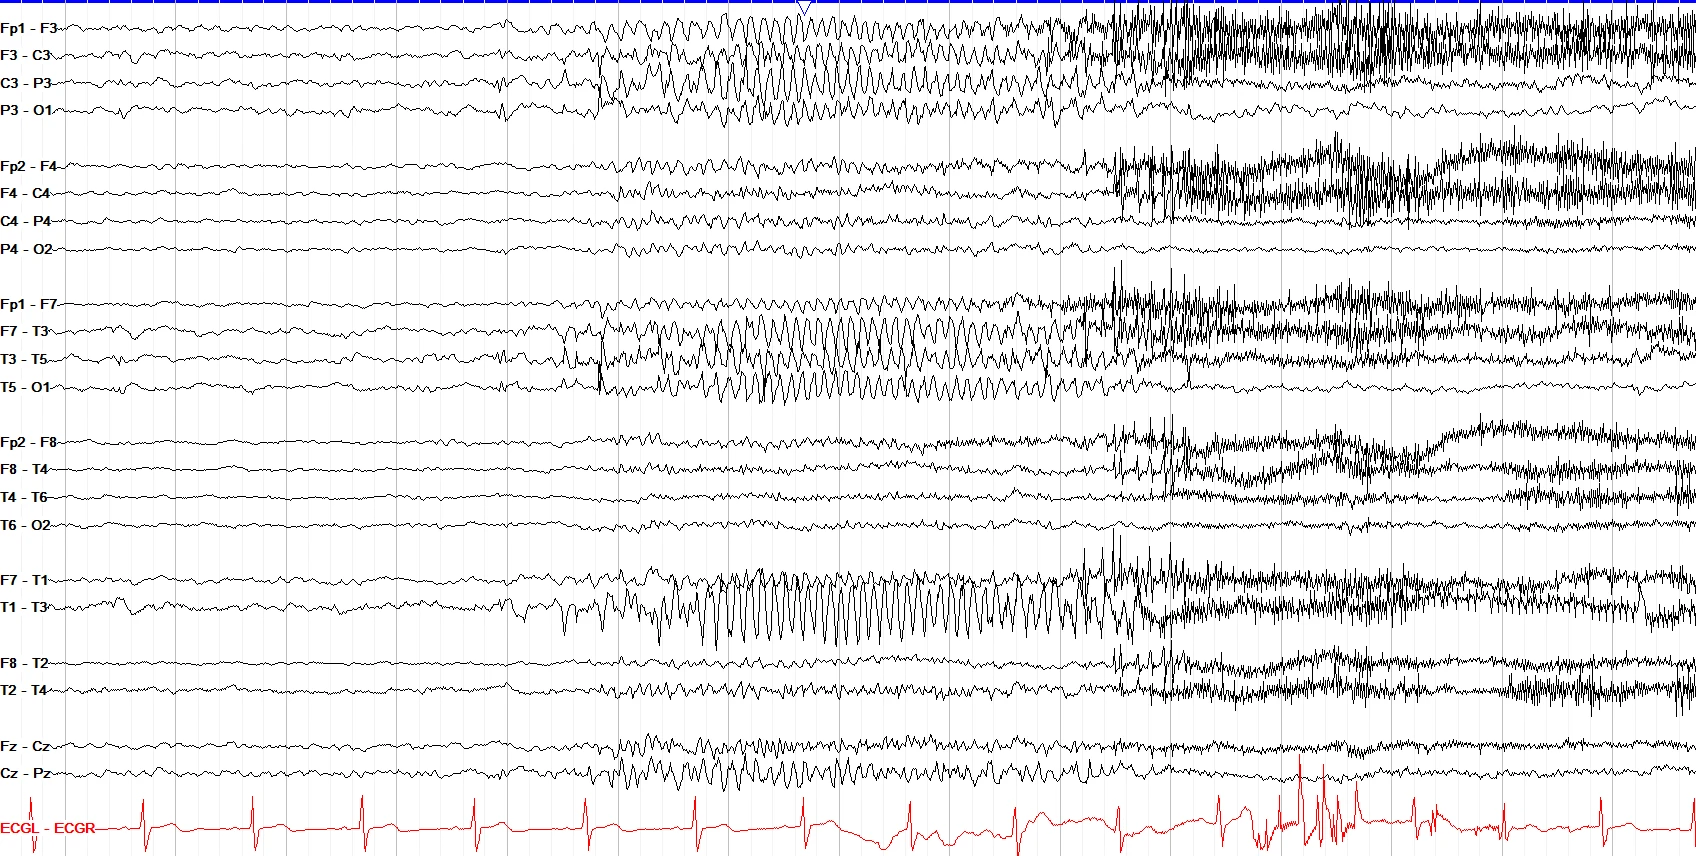
Out of sleep, a low amplitude and rather broad left hemispheric discharge, followed immediately by onset of left sided, poorly formed spikes that evolve quickly into higher amplitude, well formed left discharges, more prominent posteriorly, which slow slightly before an abrupt offset. The only clinical sign of this seizure was a subsequent arousal, and note that this seizure does not follow the 10 second rule.
generalized seizures
6 patterns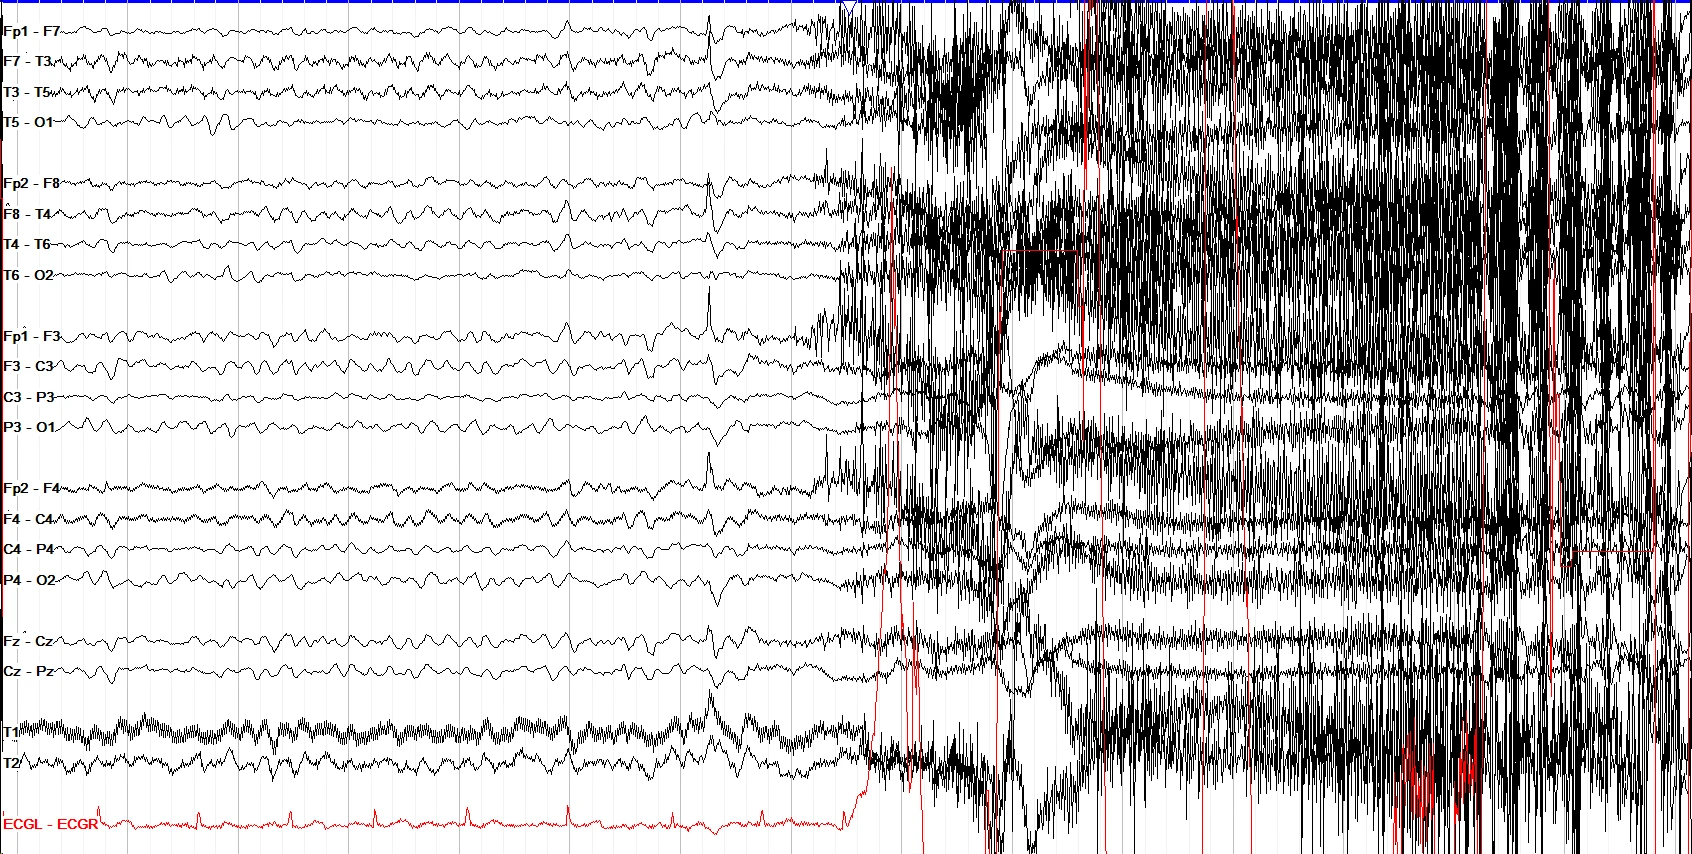
This example demonstrates nicely the two main phases of a tonic clonic seizure: the tonic phase, marked by diffuse and essentially constant myogenic artifact, and then the clonic phase, in which you get intermittent spike wave activity that corresponds to each clonic muscle contraction.
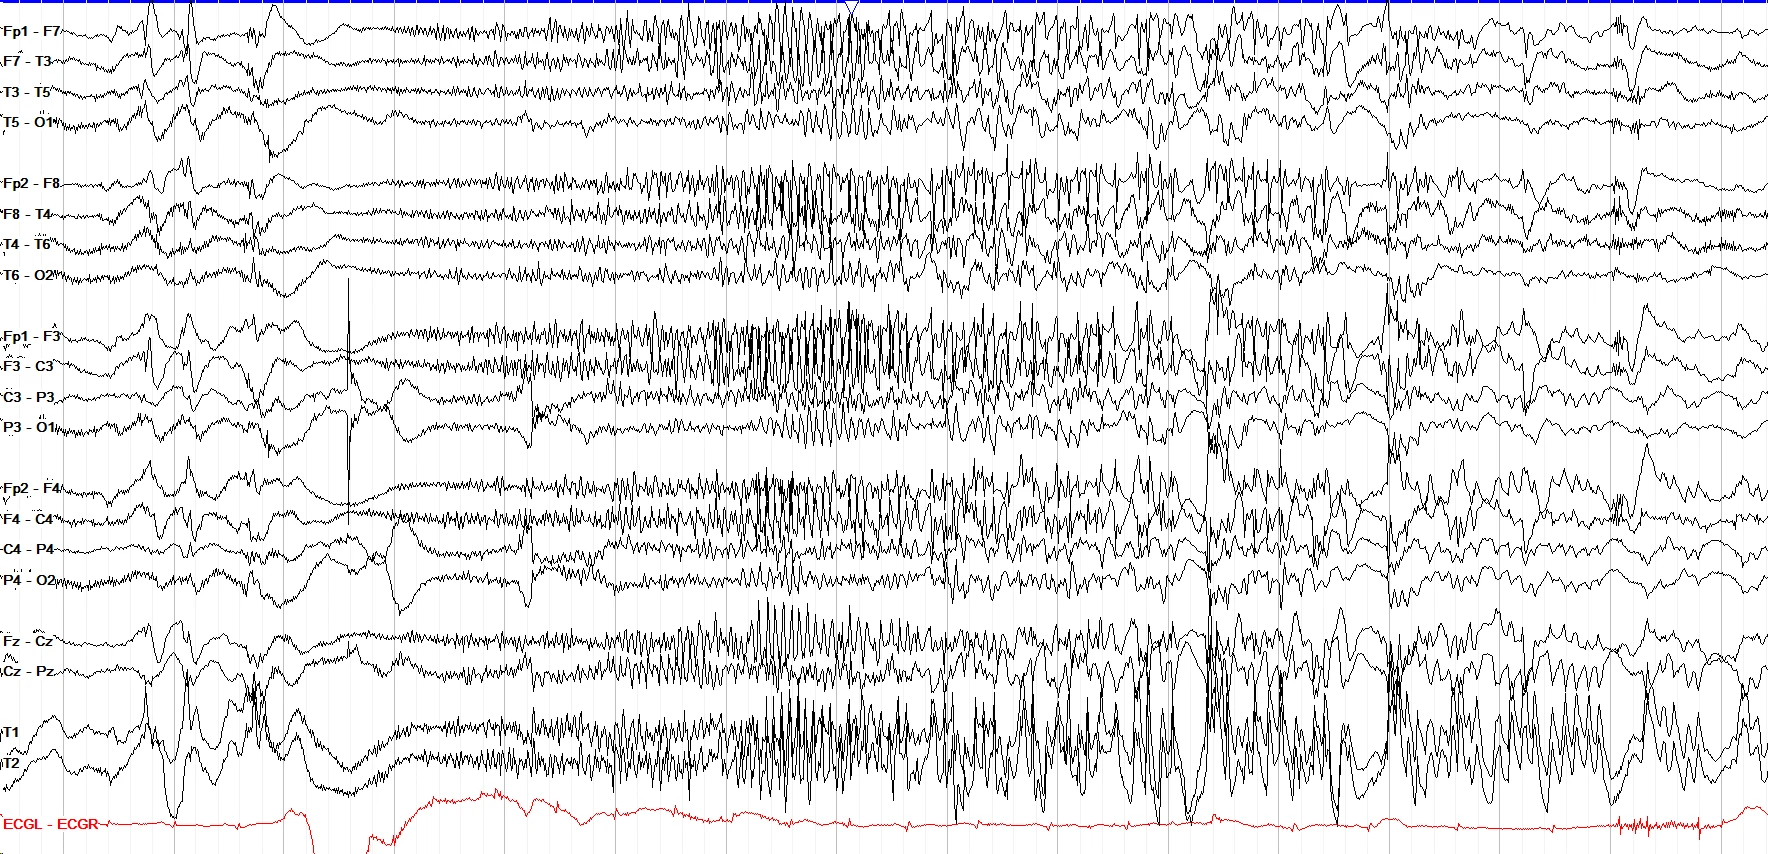
Tonic seizures are classically marked by a higher amplitude, generalized wave, then diffuse attenuation with overriding fast activity amongst widespread myogenic artifact. They do not have to follow the 10 second rule, and can be very brief.
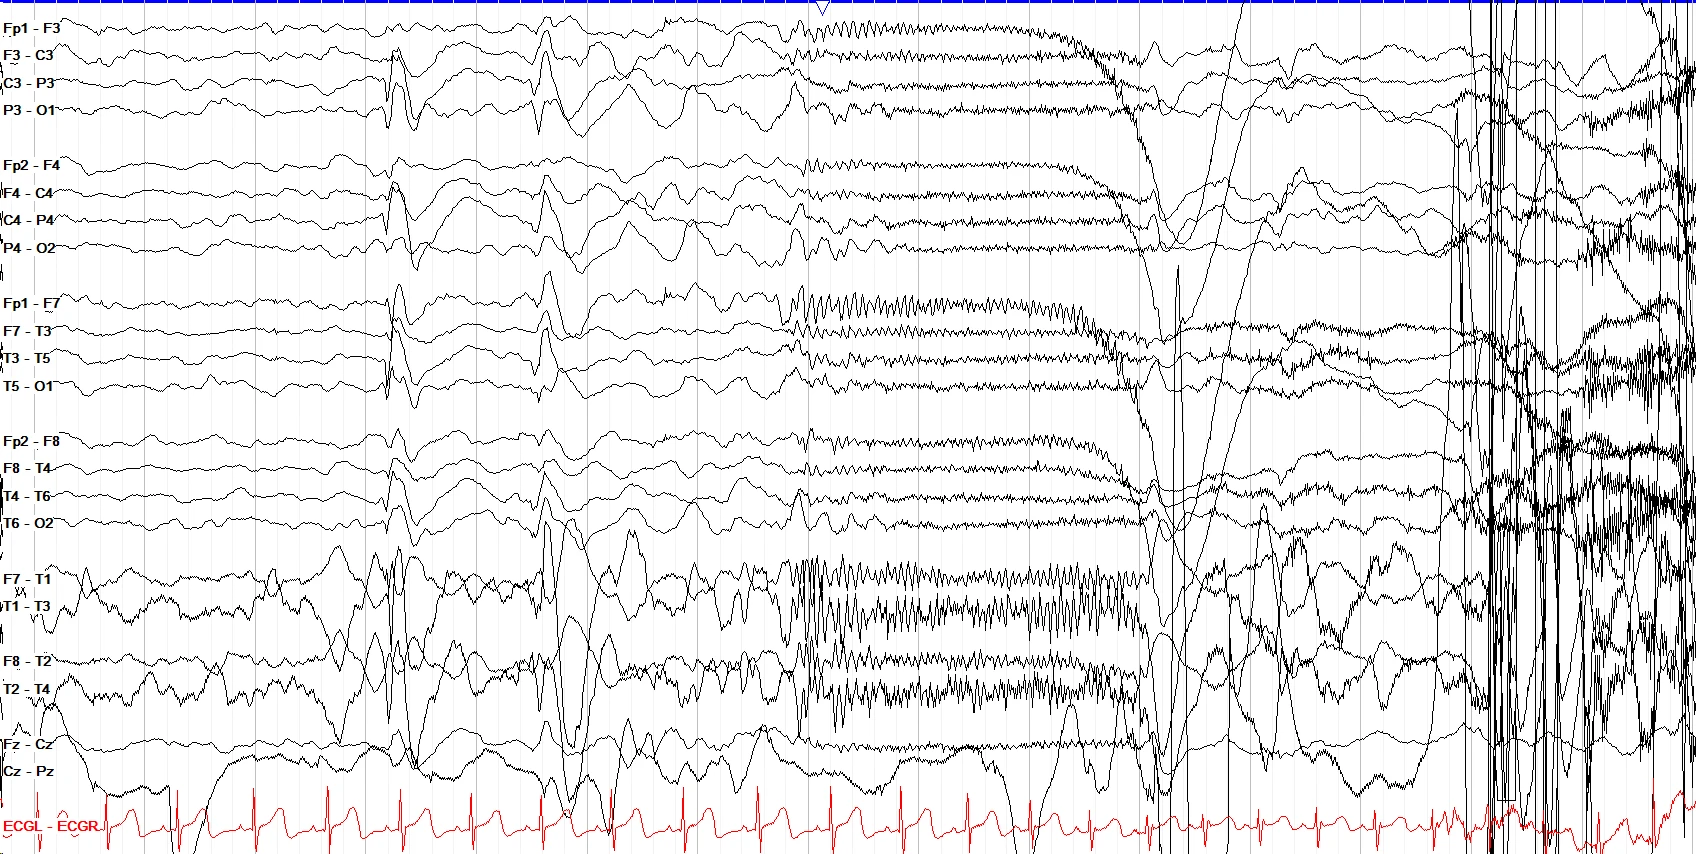
Here we see a tonic seizure with a few preceding generalized discharges; in considering when the seizure begins, it likely begins with those discharges, because there is a change in the background (diffuse slowing) from the first discharge until onset of the tonic phase.
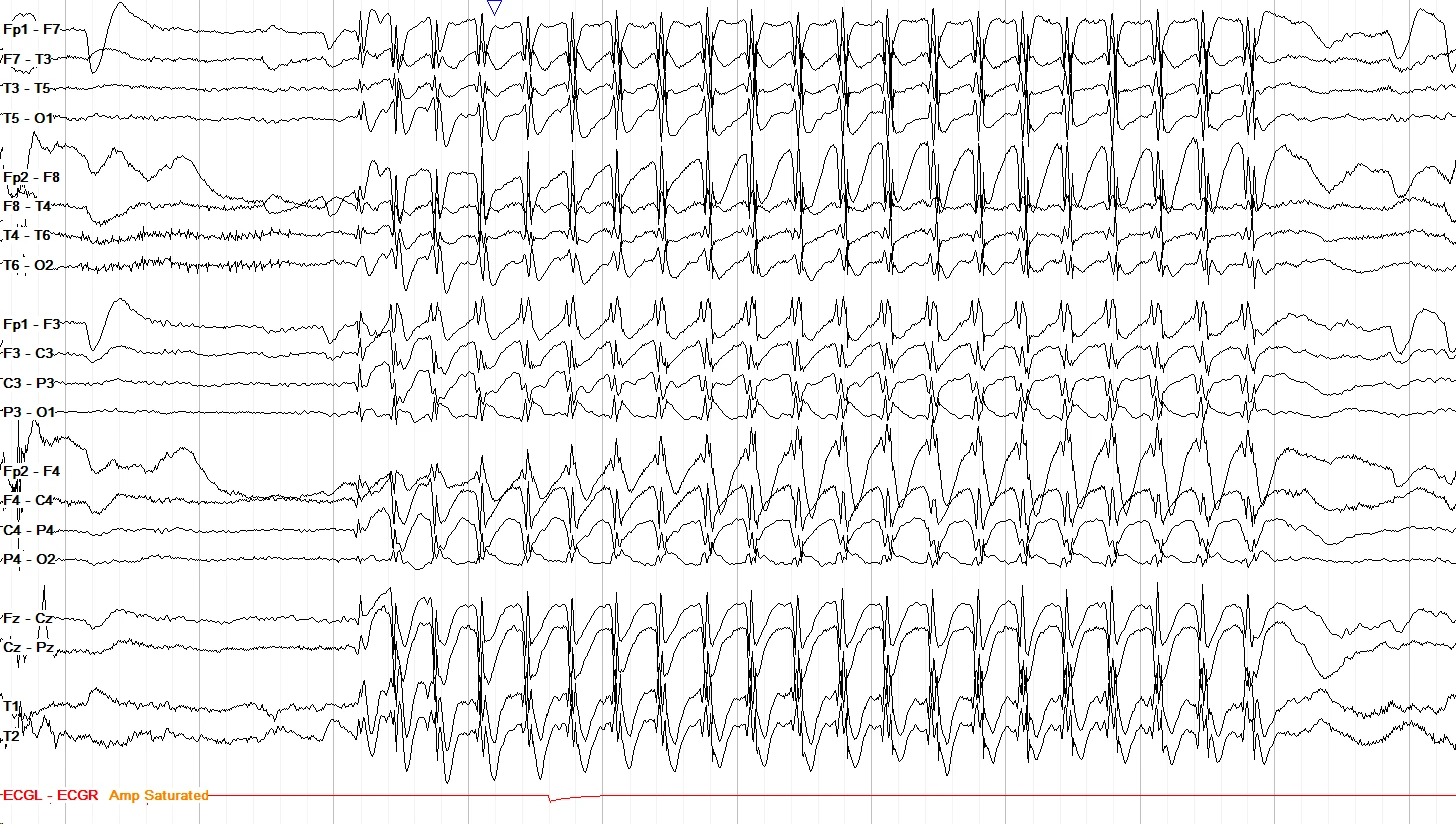
Typical absence seizures are classically seen with absence epilepsy, and are marked by 3 Hz generalized spike waves or polyspike waves, with abrupt onset / offset and no postictal state. Absence seizures can be a part of many idiopathic generalized epilepsies, and don't have to have the classic 3 Hz spike wave description.
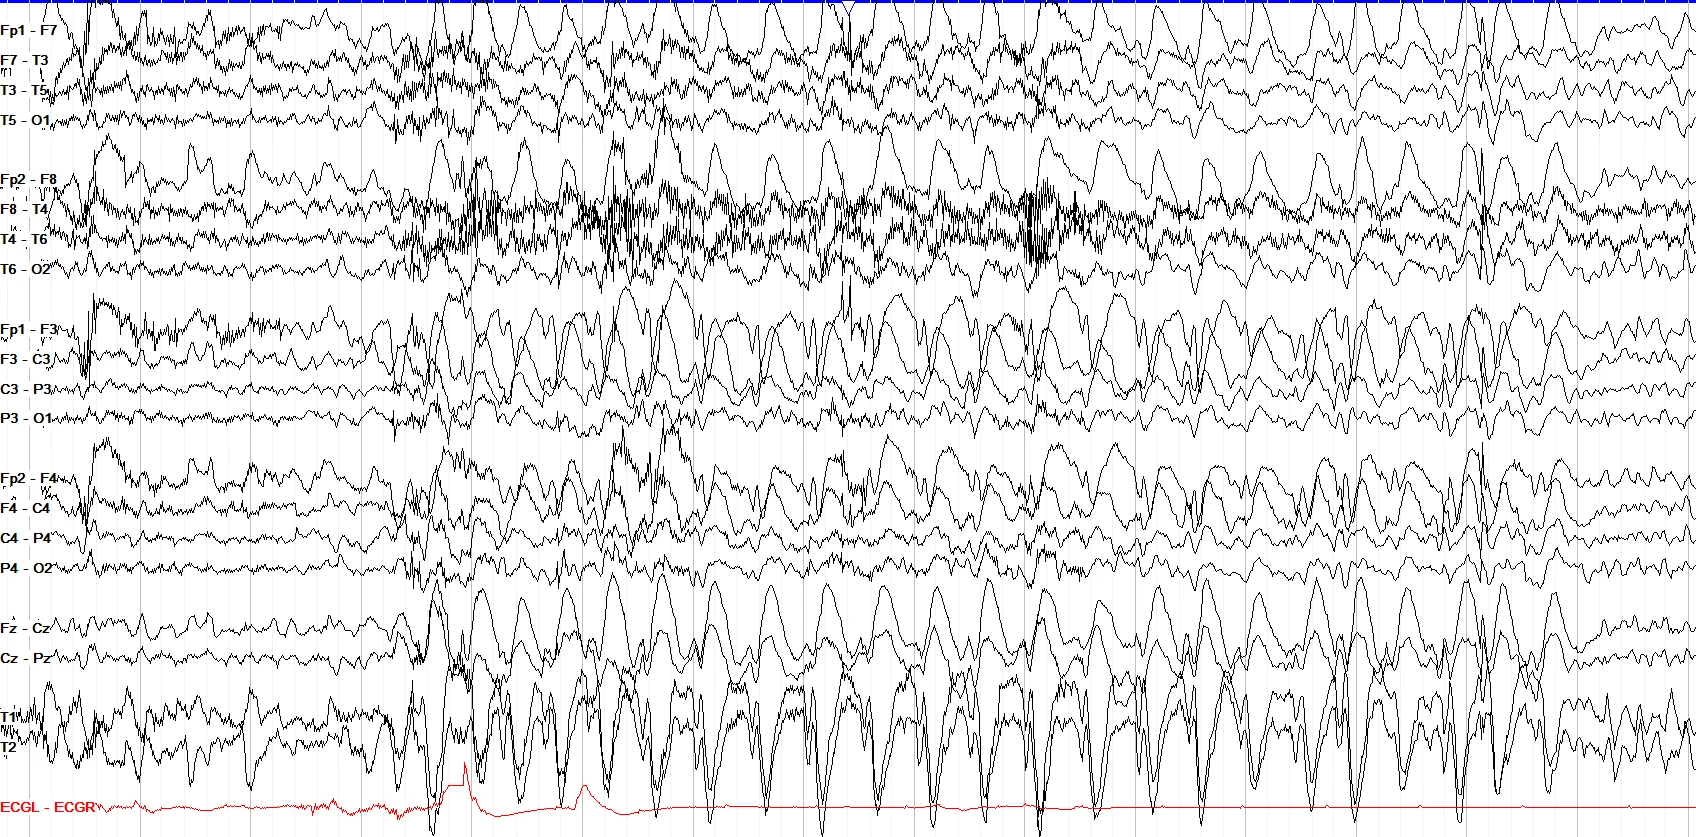
This seizure is marked by very sudden onset, generalized 3 Hz spike and wave discharges with a strong frontal predominance; within a second or so, these discharges become more well formed and slow to 2Hz, and remain as such for the remainder of the seizure, which has a very abrupt offset without clear postictal changes (at least not in the second or so we can see on this page).
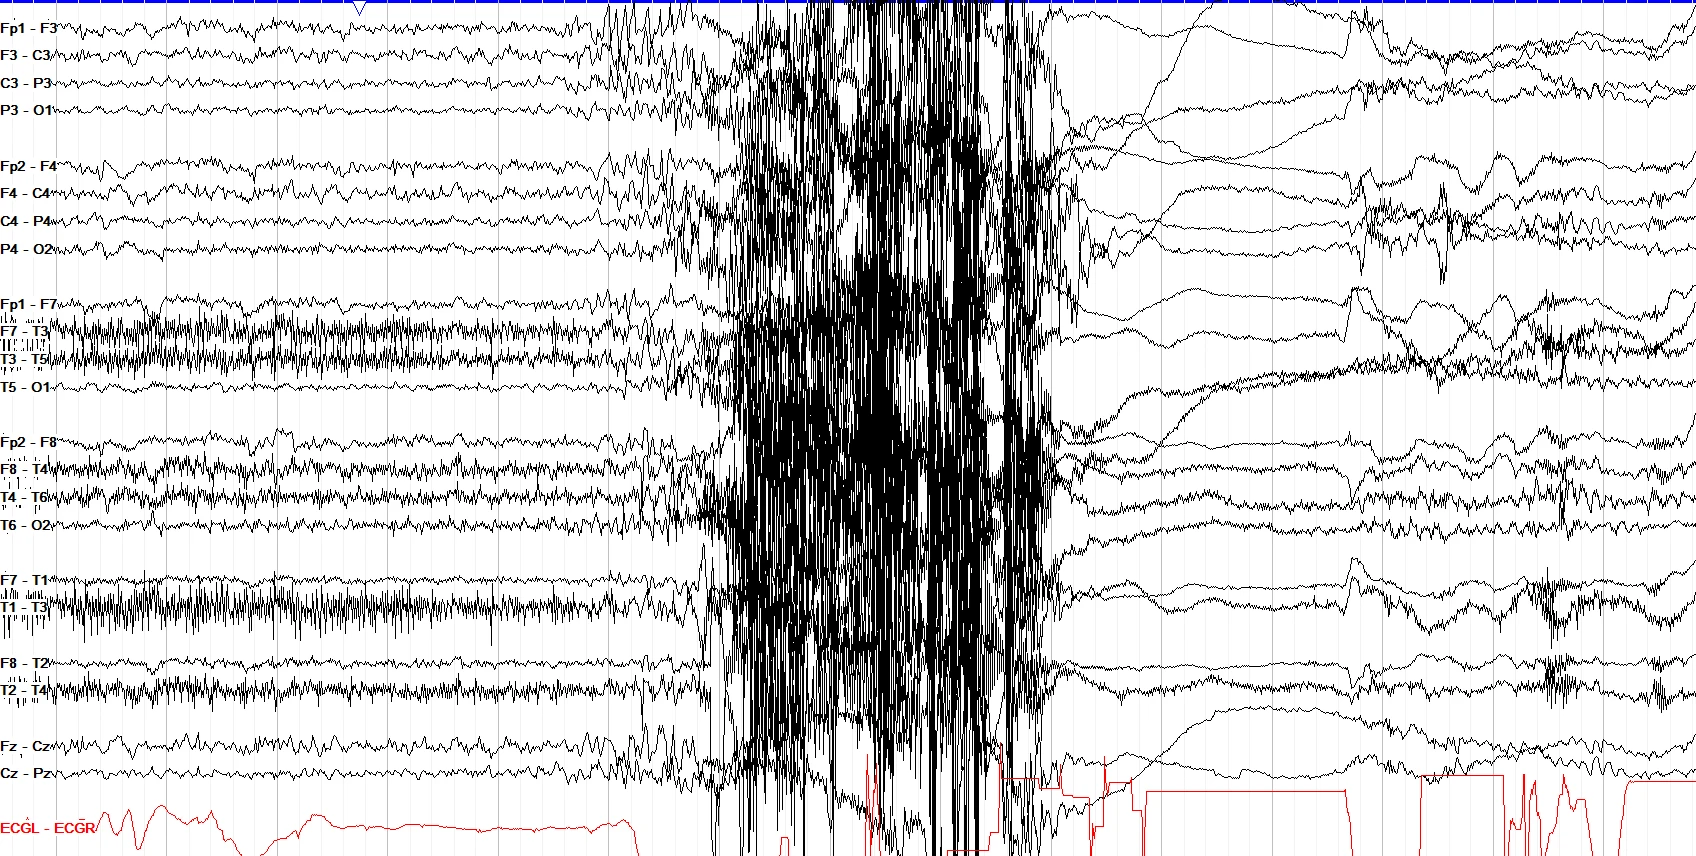
Myoclonic seizures consist of a series of myoclonic jerks. They can be brief, as this one is, and are most commonly seen in the setting of Juvenile Myoclonic Epilepsy (JME), Lennox Gastaut Syndrome (LGS), progressive myoclonic epilepsy, or anoxic brain injury. They're commonly generalized in onset, but can be lateralized; this one, for example, has a slight left lead in but is generally bisynchronous in onset.
focal to bilateral
2 patterns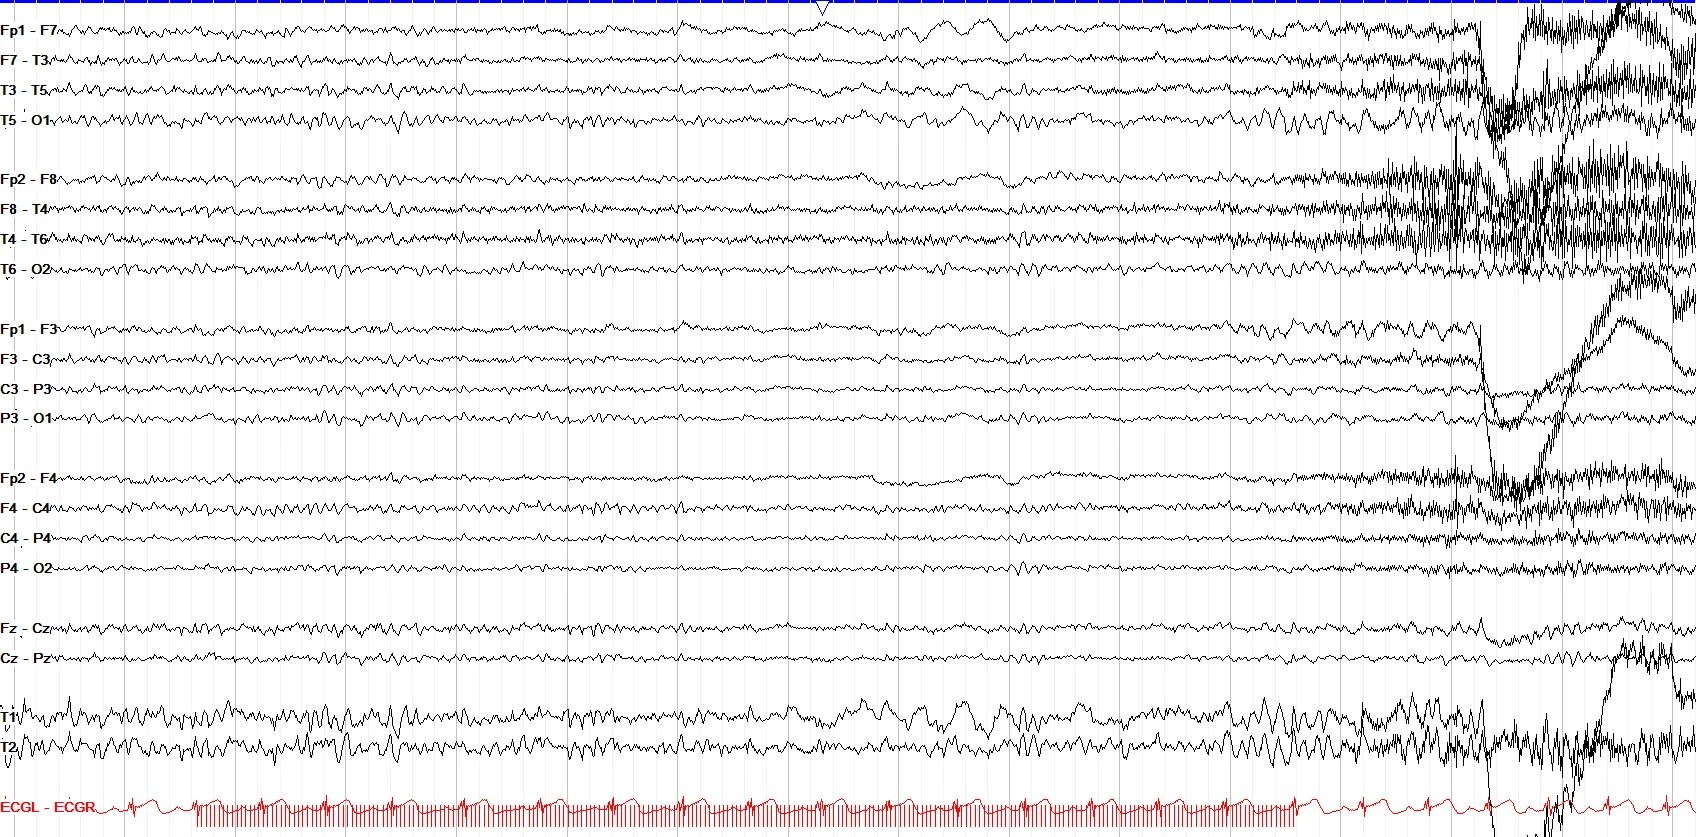
Here we see high frequency photic stimulation (the red lines on the bottom of the screen) that sets off a rhythmic delta activity in the left temporal lobe, leading into rhythmic spikes in the left temporal lobe that eventually spread and generalize into tonic clonic activity.
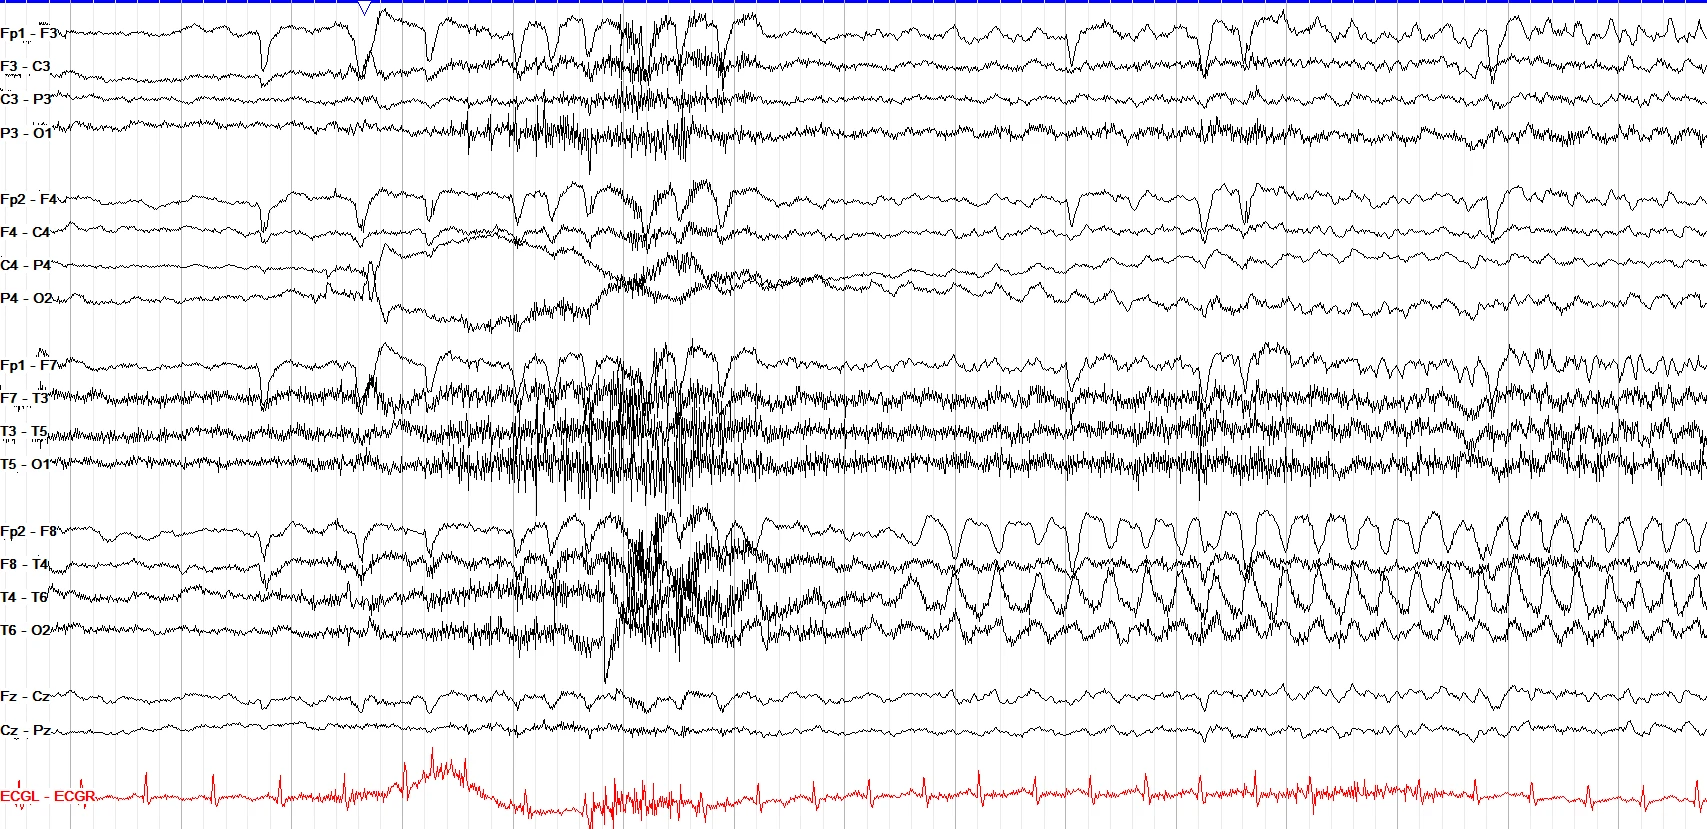
From sleep there's arousal artifact, then emergence of right anterior to mid-temporal 2-3Hz spike and slow wave activity, which increases in frequency to 7 Hz with spread throughout the right parasagittal, then the left temporal and parasagittal chains, with continued increase in amplitude of the spike waves into generalized tonic clonic activity.
infantile spasms
2 patterns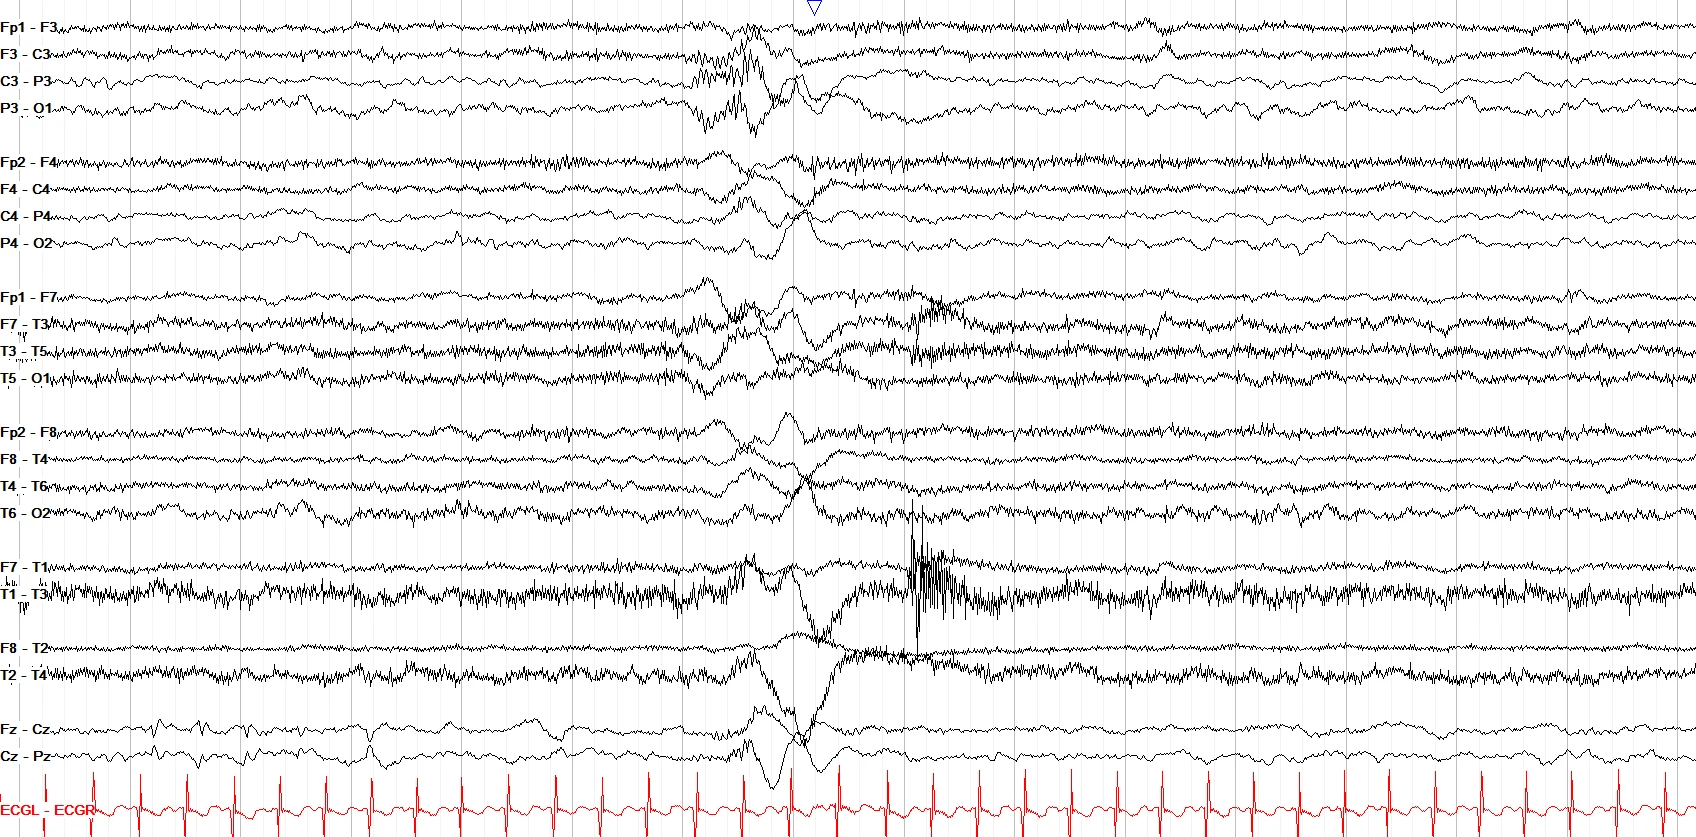
Spasms are a highly concerning seizure type, classically seen in infants amongst a background of hypsarrhythmia (very high voltage, chaotic background with multifocal spikes). Electrographically, they are very brief and diffuse, high amplitude slow waves, often with overriding fast activity. To give a sense of how high amplitude spasms can be, the example above was taken at a rather low sensitivity of 20uV/mm.
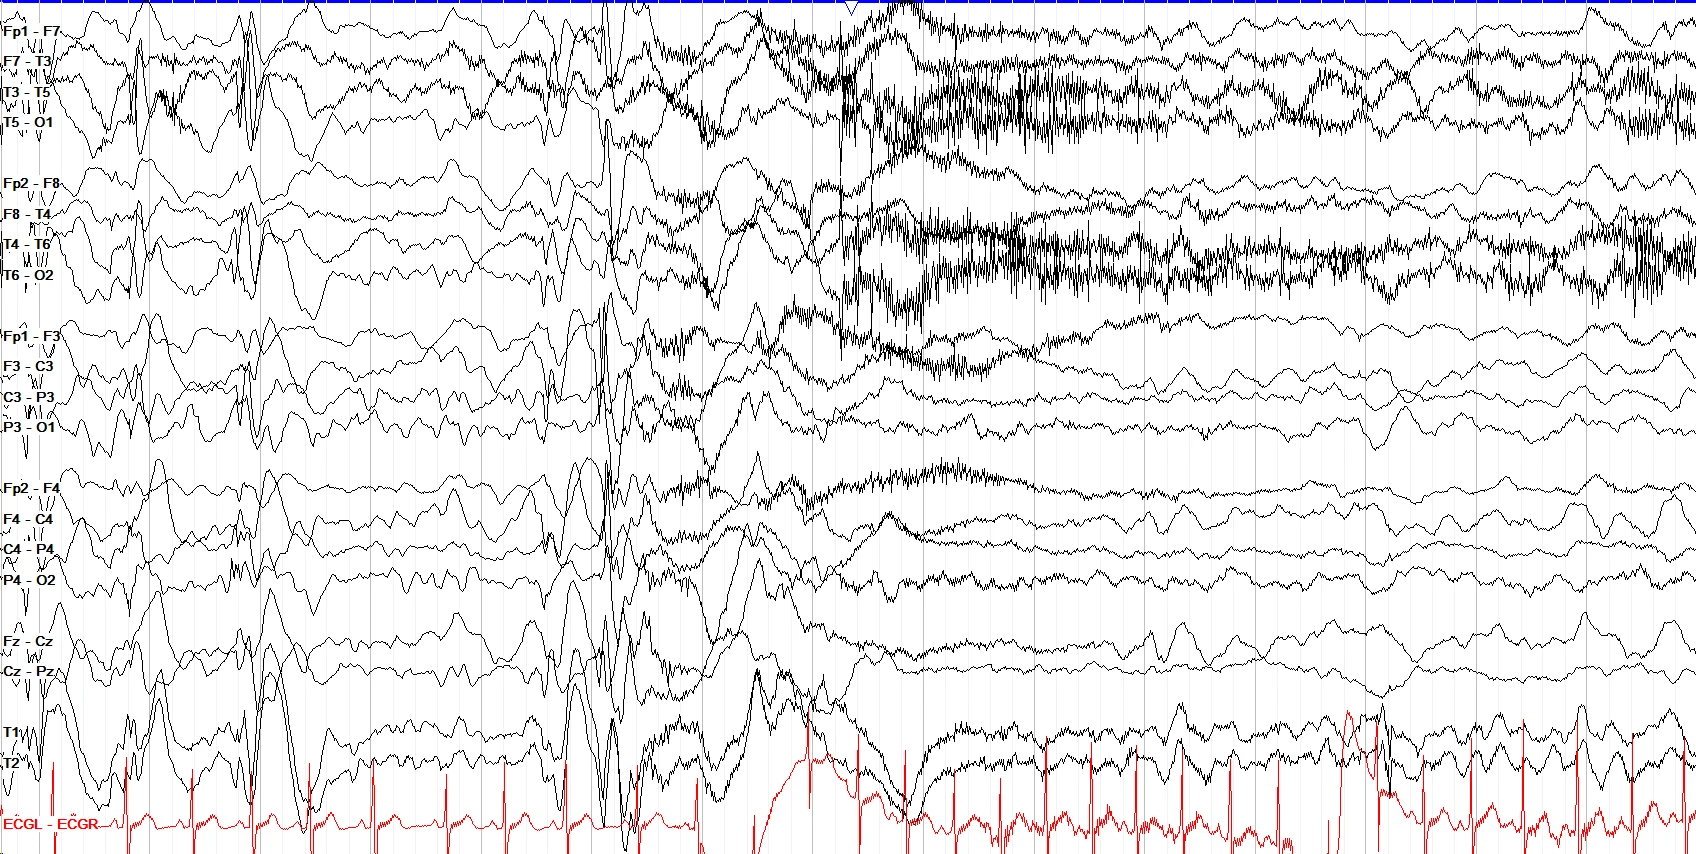
In this tracing, captured at a low sensitivity of 25uV/mm, we see a background more like those expected with infantile spasms (IESS): high amplitude, disorganized background with multifocal spikes. The seizure is brief, and again shows a diffuse slow wave with overriding fast activity. Clinically, spasms are often sudden and brief flexion/extension movements of the arms and/or legs, often with a brief head drop.
common montage types
5 patterns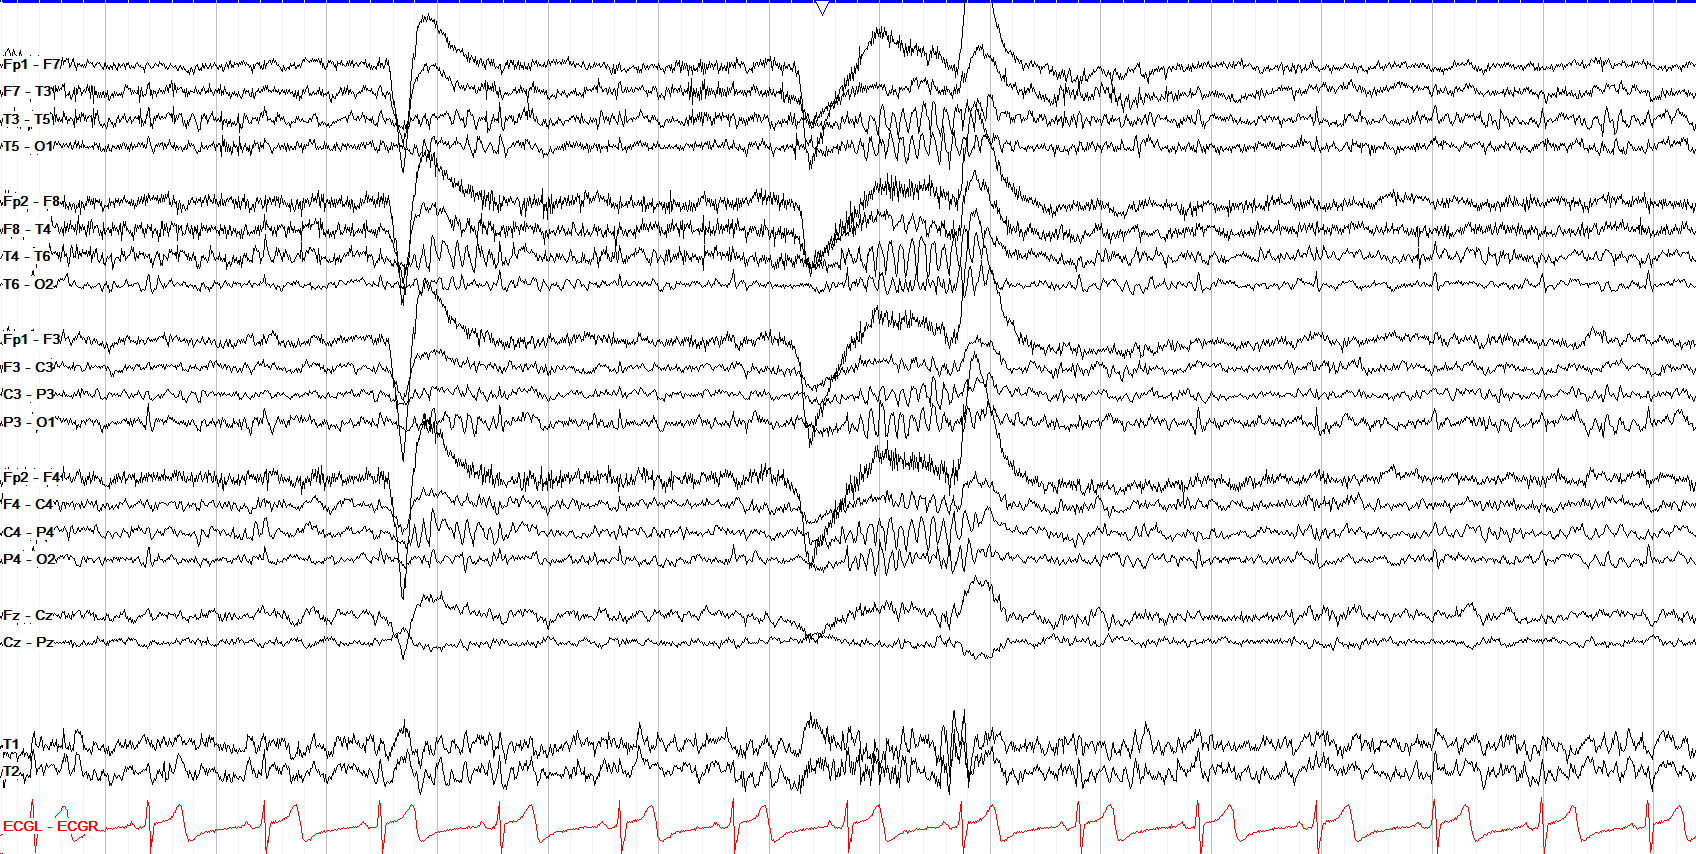
The double banana is the most common form of bipolar montage, with bilateral temporal chains over bilateral parasagittal chains, both running from front to back. There is also a short central chain. Many centers also now add the T1 and T2 electrodes from the 10-10 system.
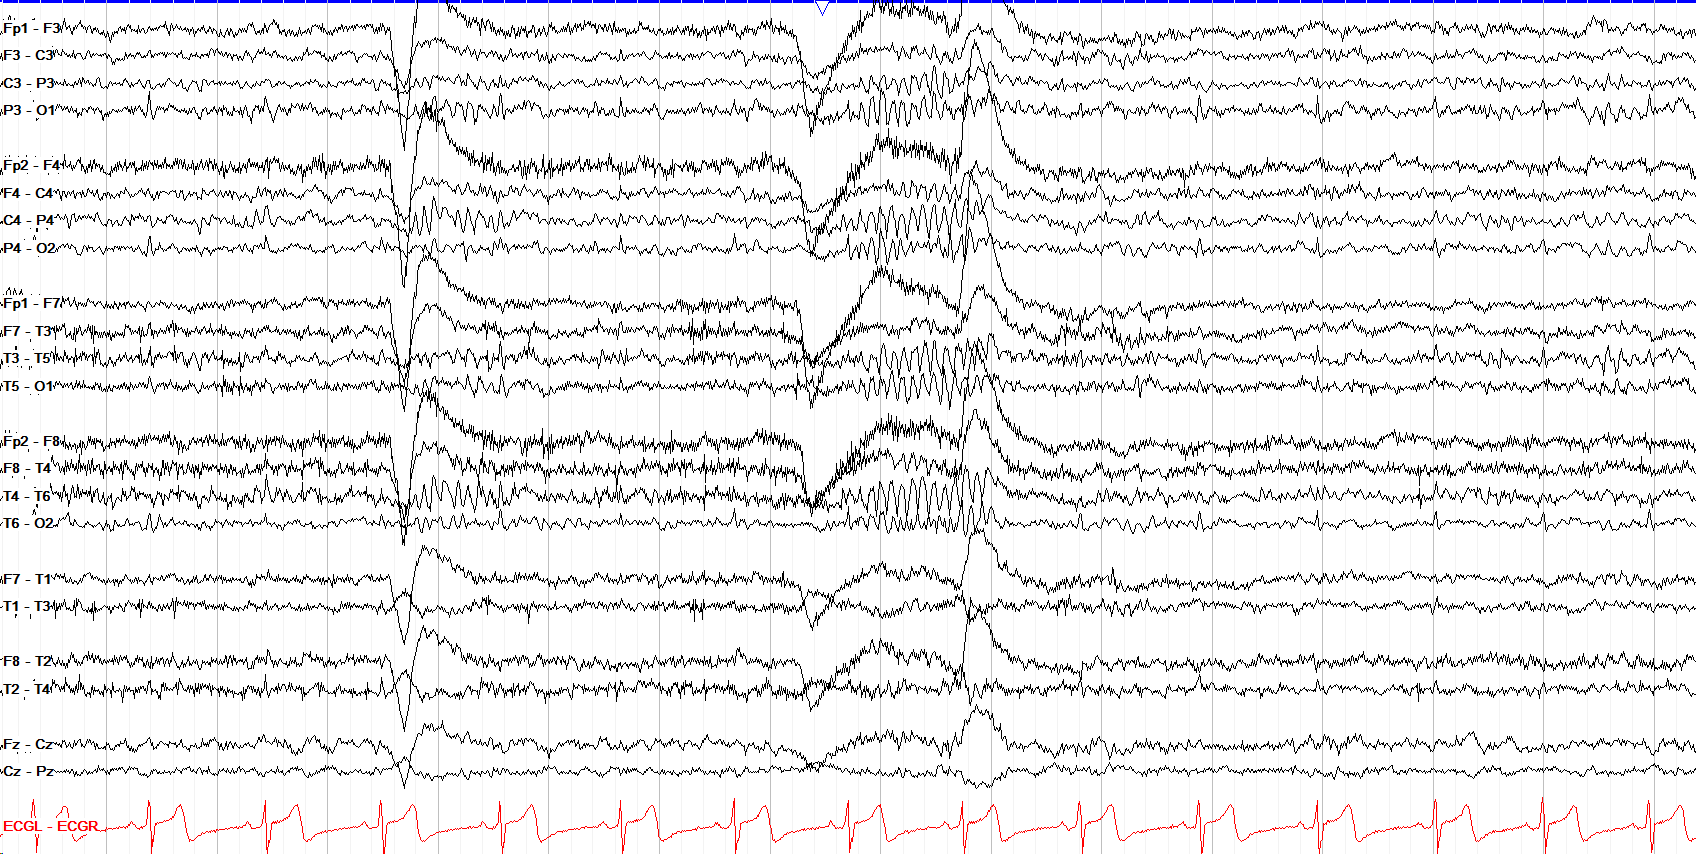
The bipolar T1-T2 montage is nearly identical to the double banana, but gives more emphasis to the subtemporal T1 and T2 electrodes, and puts the temporal chain adjacent to them by placing the parasagittal chains on top.
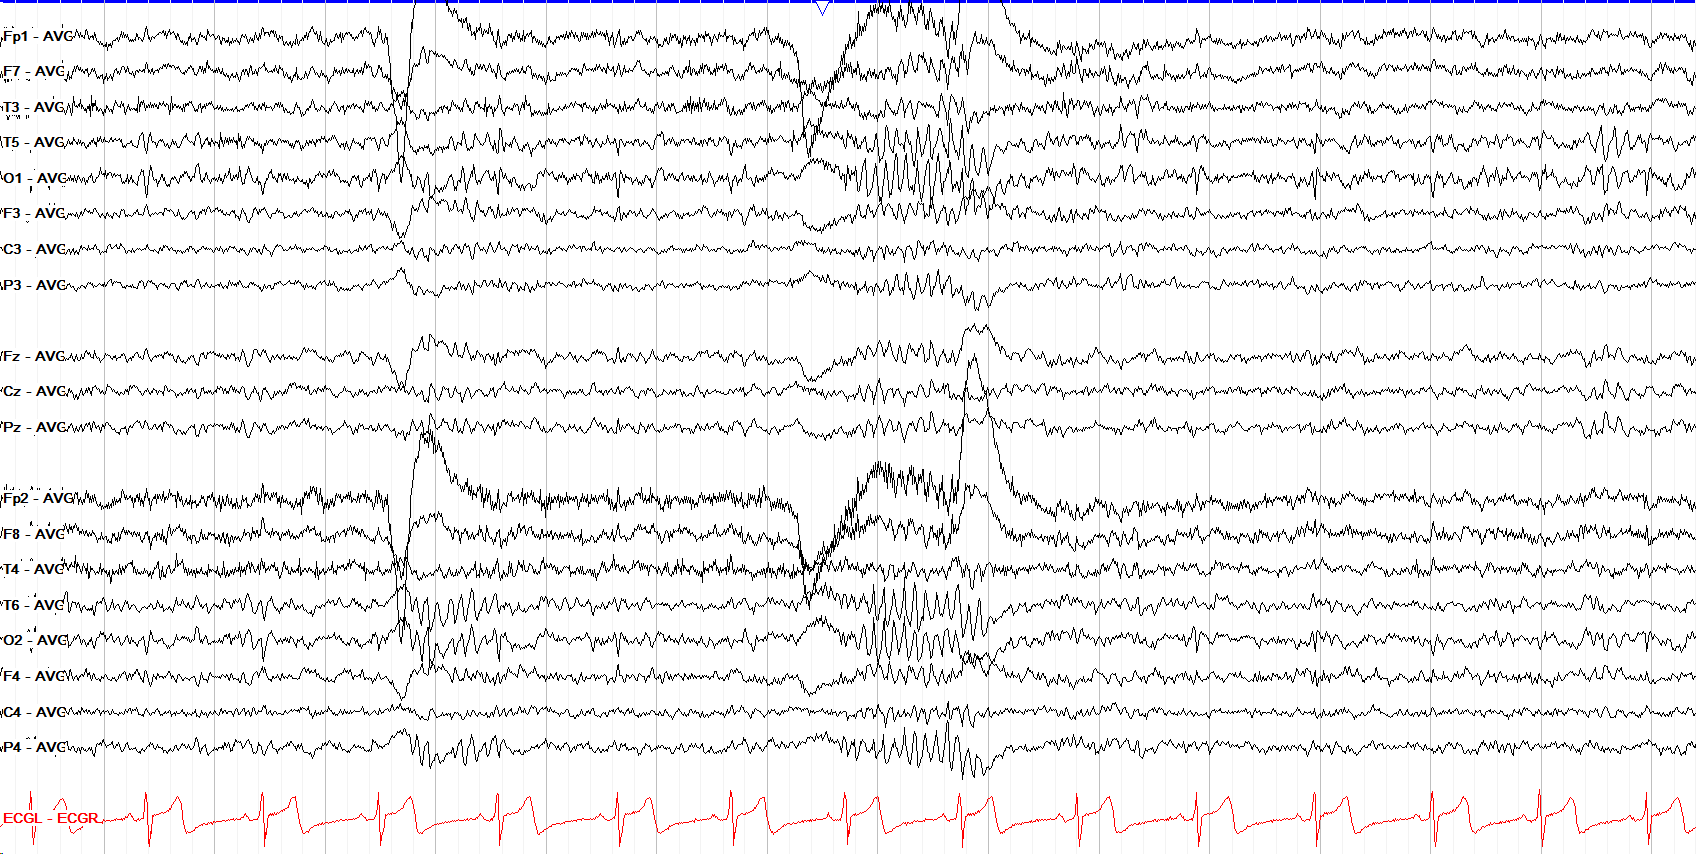
Referential montages can be useful to clarify the electrode of maximal voltage if that is unclear on bipolar montages. In referential, you compare the voltage of all electrodes to a single reference, such as an average value or the electrically much quieter earlobe.
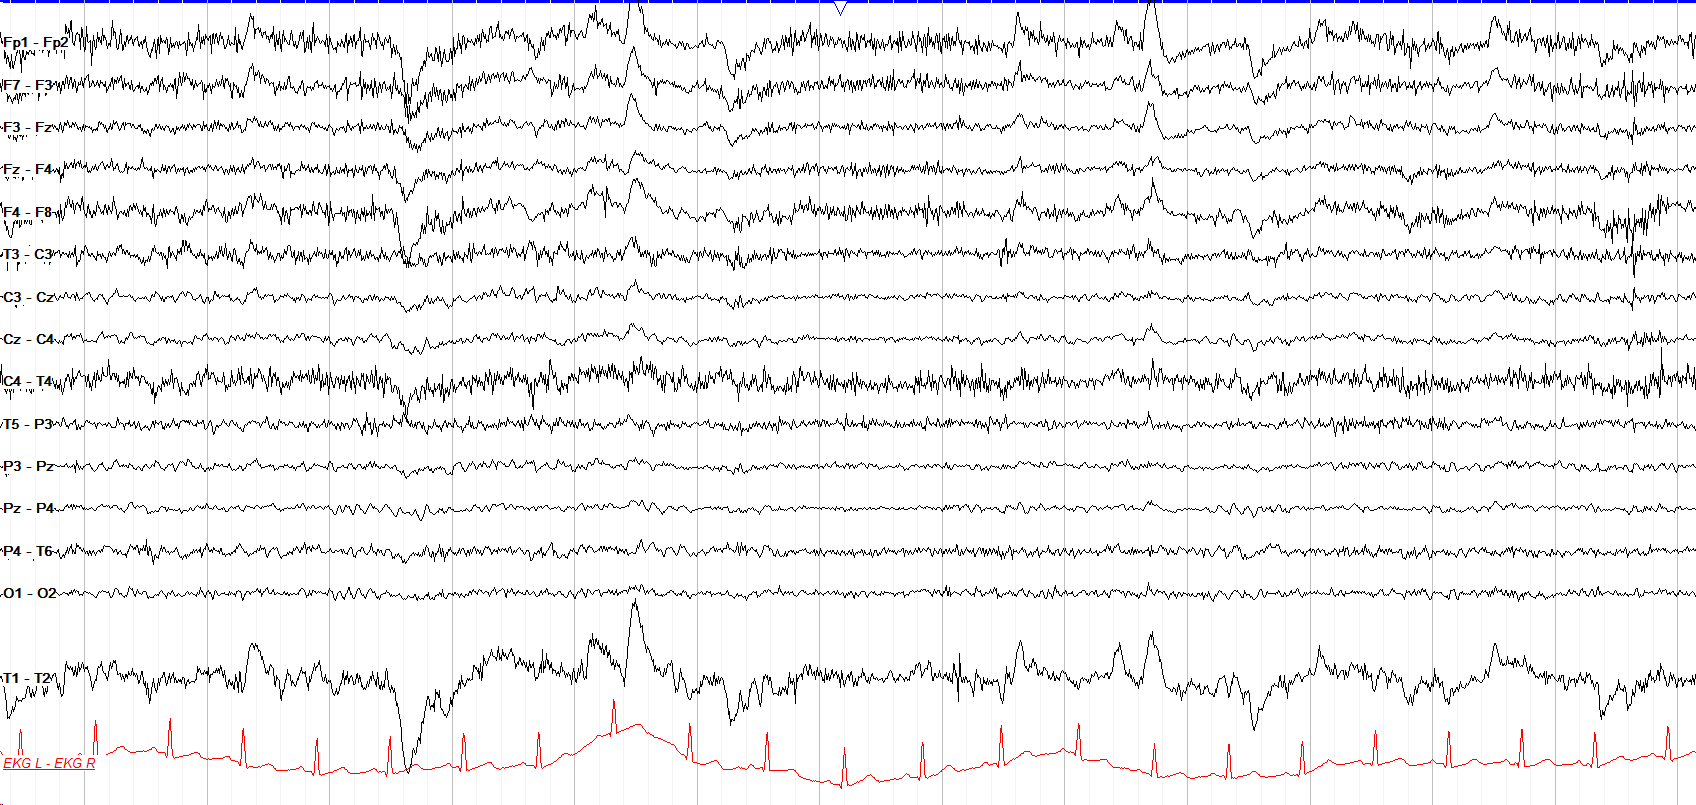
Transverse montages link electrodes in chains across the head instead of from front to back. They can be useful in lateralizing discharges, or finding the side of maximal amplitude, if that is unclear on a more standard montage.
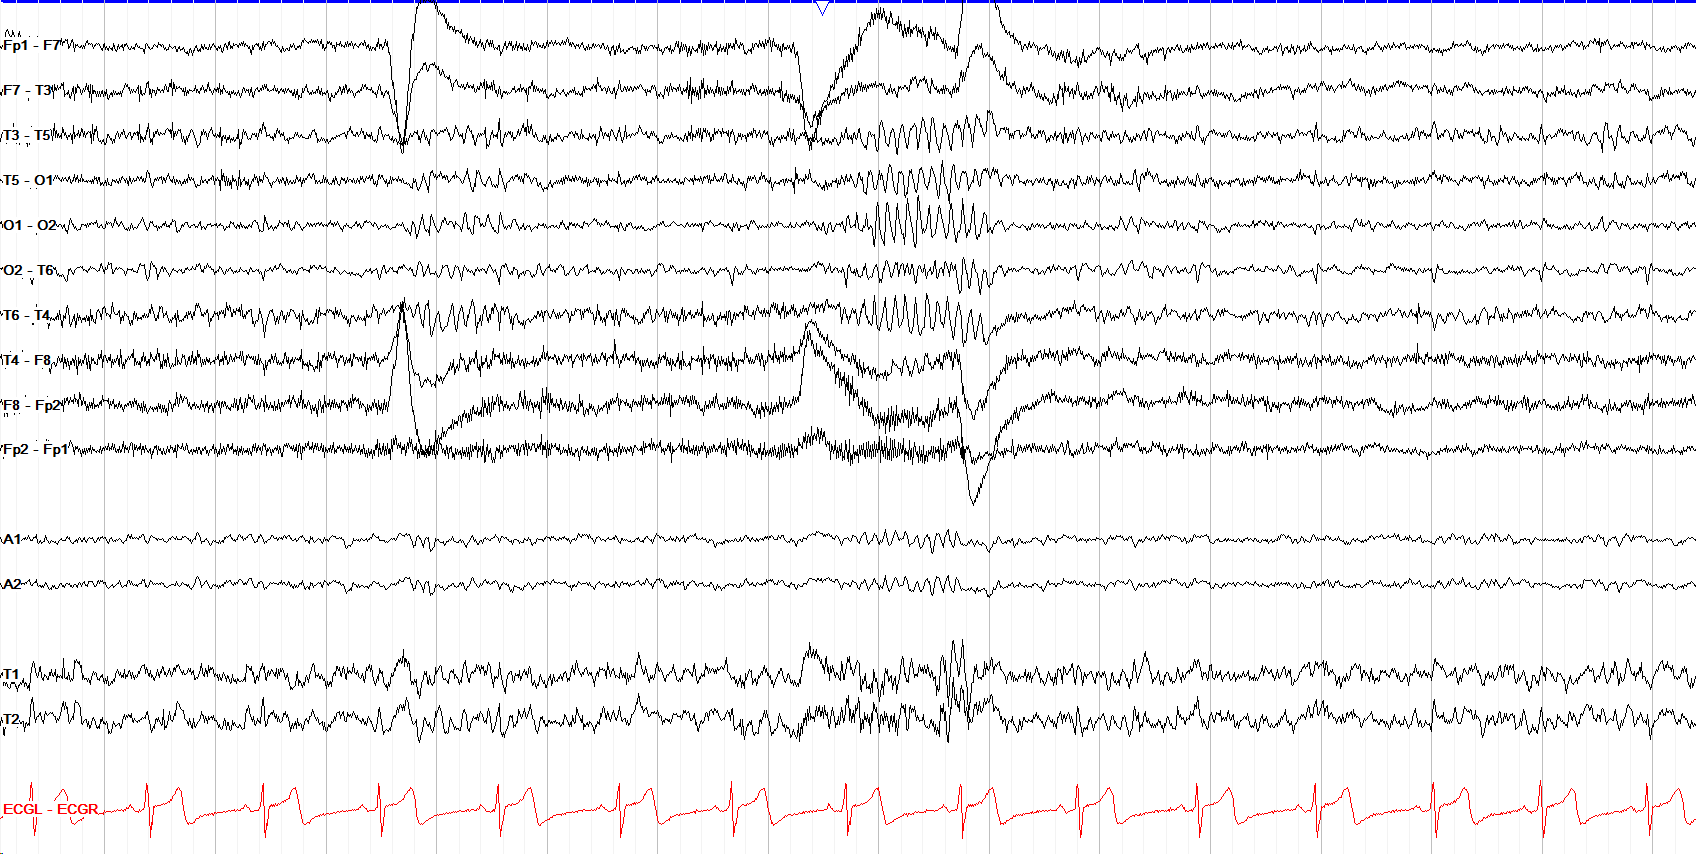
The circumferential montage is ideal for analyzing occipital activity, because it removes the end of chain problem and allows phase reversals to be seen at O1 and O2, helping to lateralize and localize occipital discharges.
technical points
8 patterns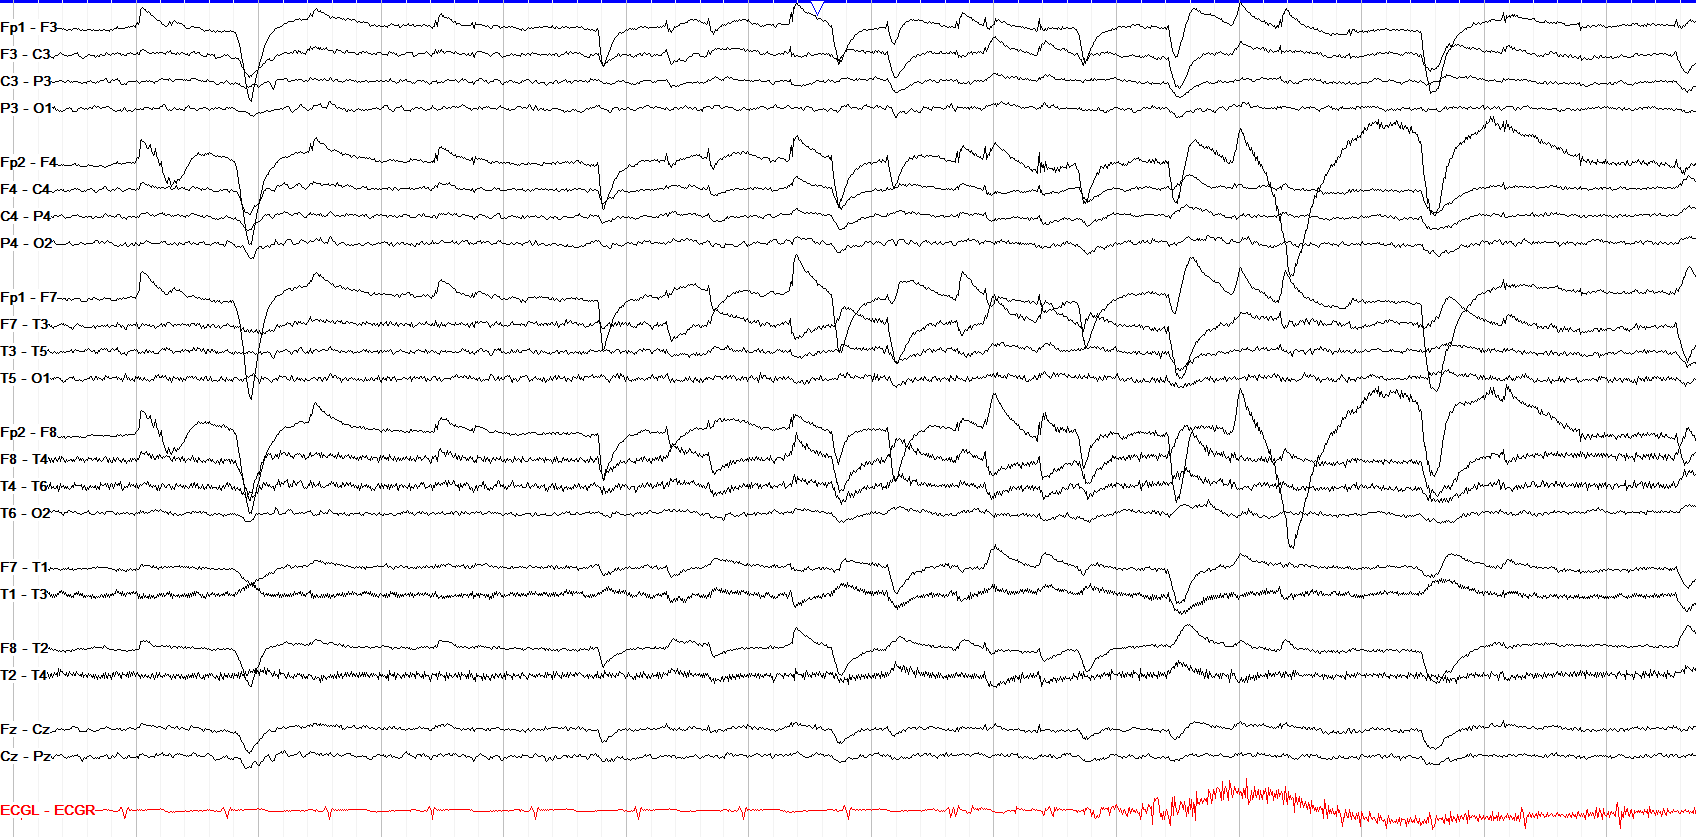
Here are lateral eye movements, discussed in the Artifact section. Briefly, the cornea's positive charge causes the frontal leads to see a positive voltage when you look to a side while the opposite side sees a negative voltage, leading to the opposing frontal phase reversals in this tracing.
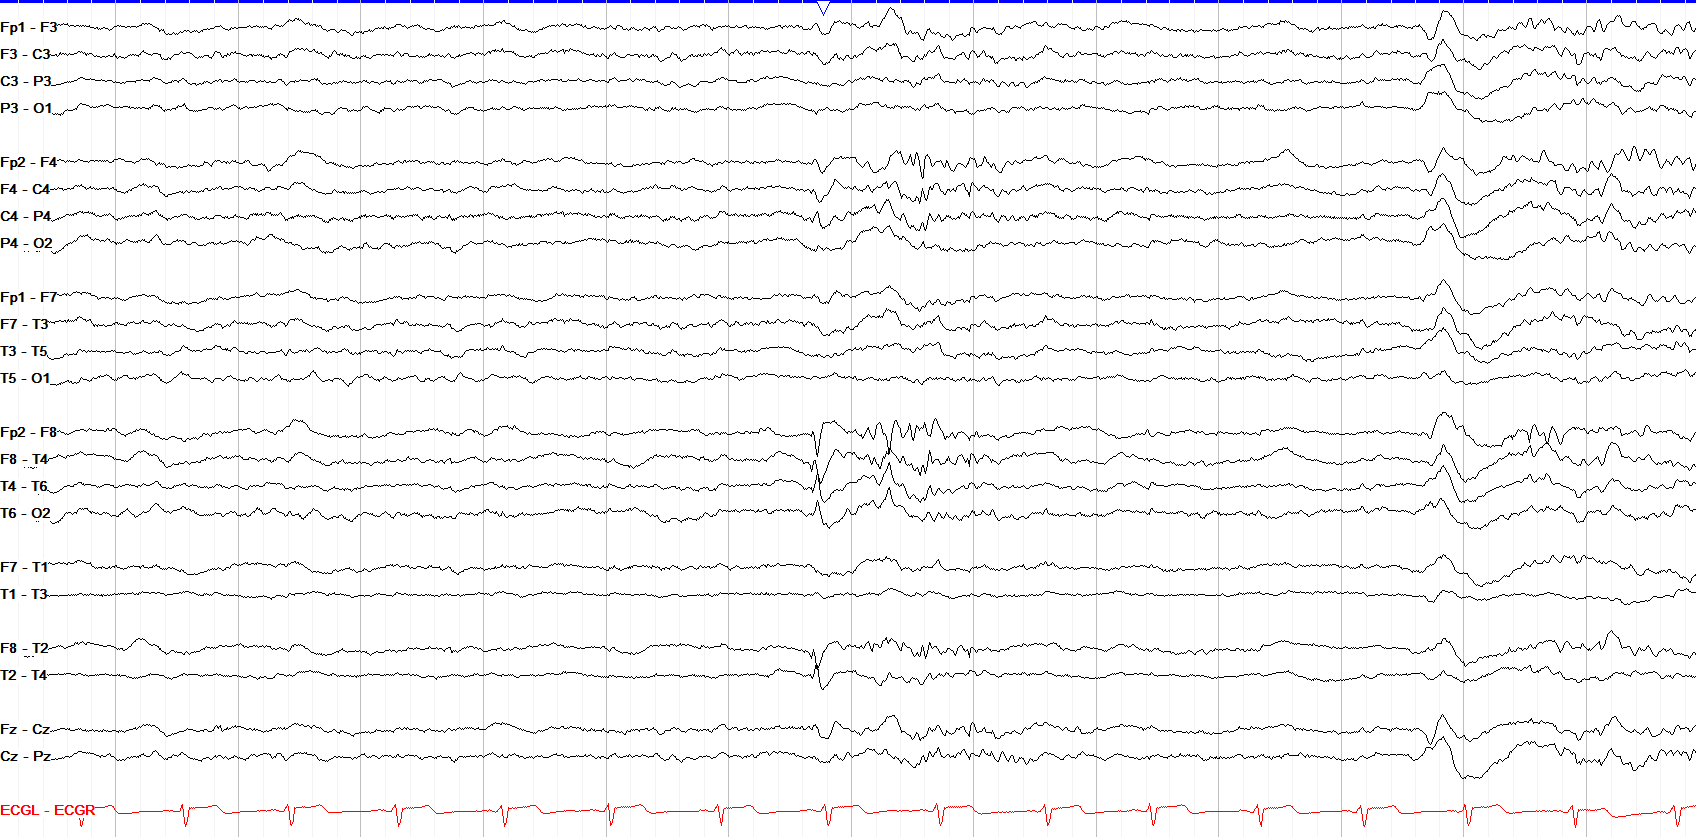
This image shows an epileptiform discharge in the right temporal region. See that there is a negative phase reversal with the leads "pointing toward" each other; the middle of this point is the F8 electrode, making it the maximal point of this discharge.
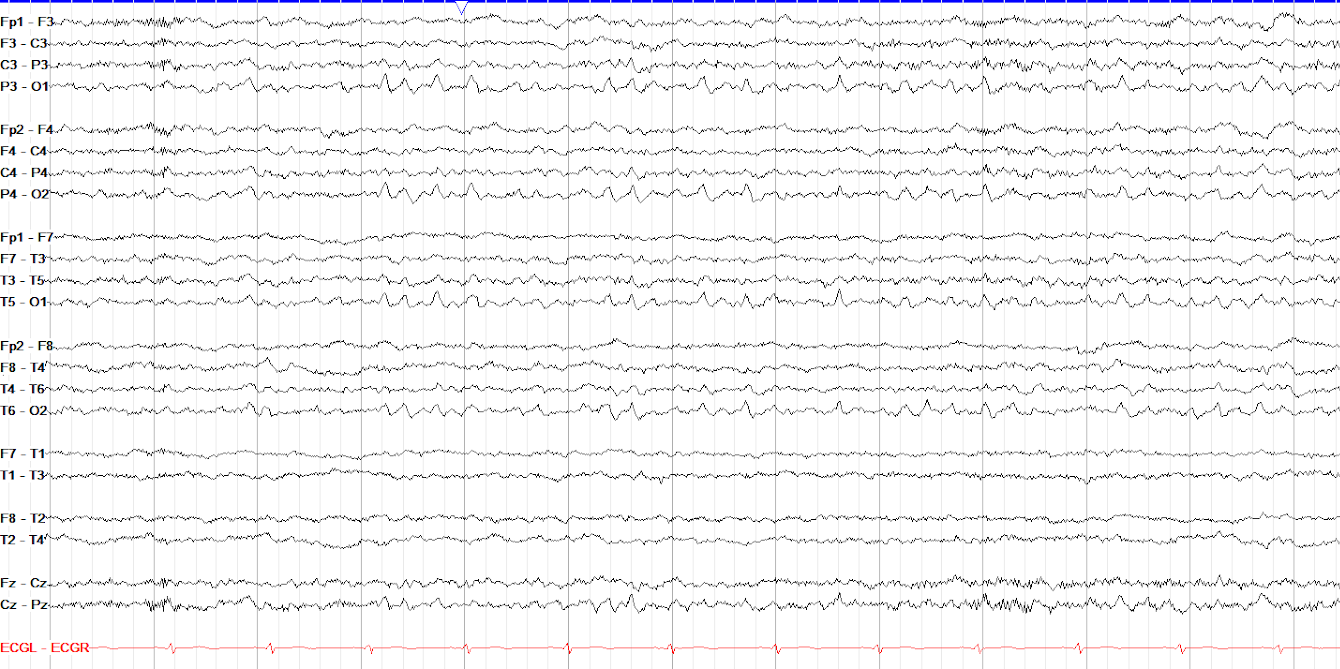
These are positive occipital sharp transients of sleep (POSTS; see the sleep section). You might wonder why they are positive if the waveforms are upgoing; remember bipolar montages have phase reversals and the occipital lead is end of chain, so we only see half of the POSTS phase reversal; the other half would be downgoing, revealing O1 to be positive.
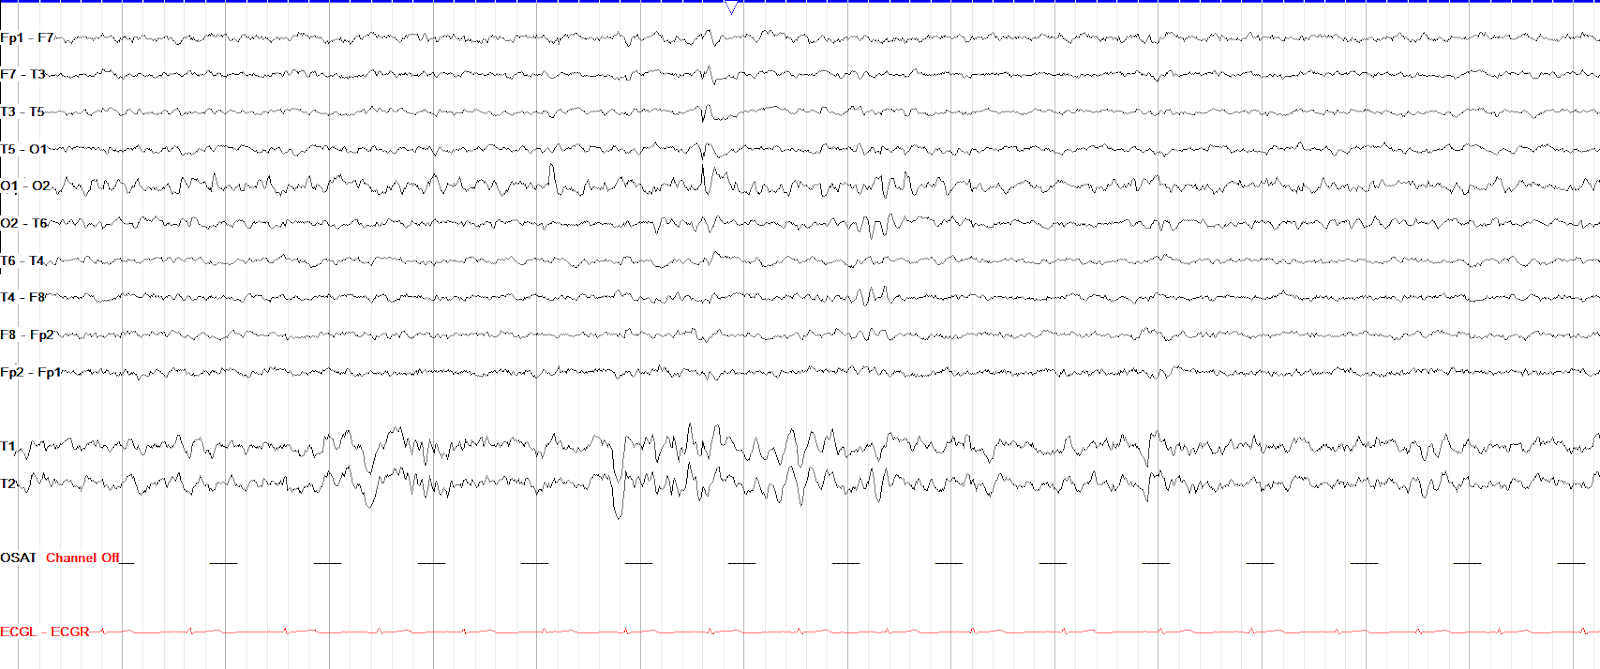
Note how a circumferential montage allows you to better localize a discharge at the end of a chain. Here, we see a negative phase reversal at O1; on the standard double banana montage seen last in the series, there is no phase reversal because there's no electrode behind O1 to which it can be compared.
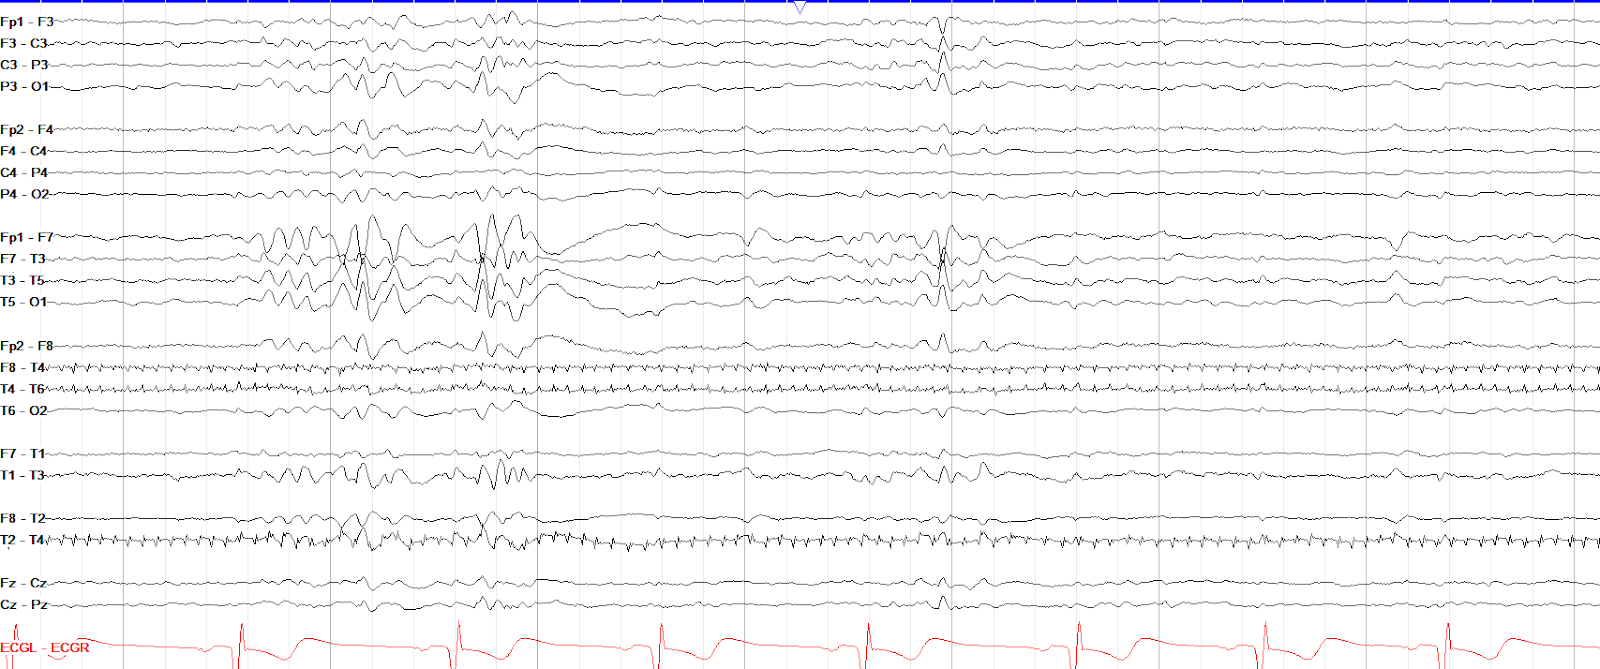
This set of images demonstrates how the same discharges can appear wildly different at different reading speeds. 30mm/sec is the standard speed for adults and children, while 15mm/sec is standard for neonatal studies.
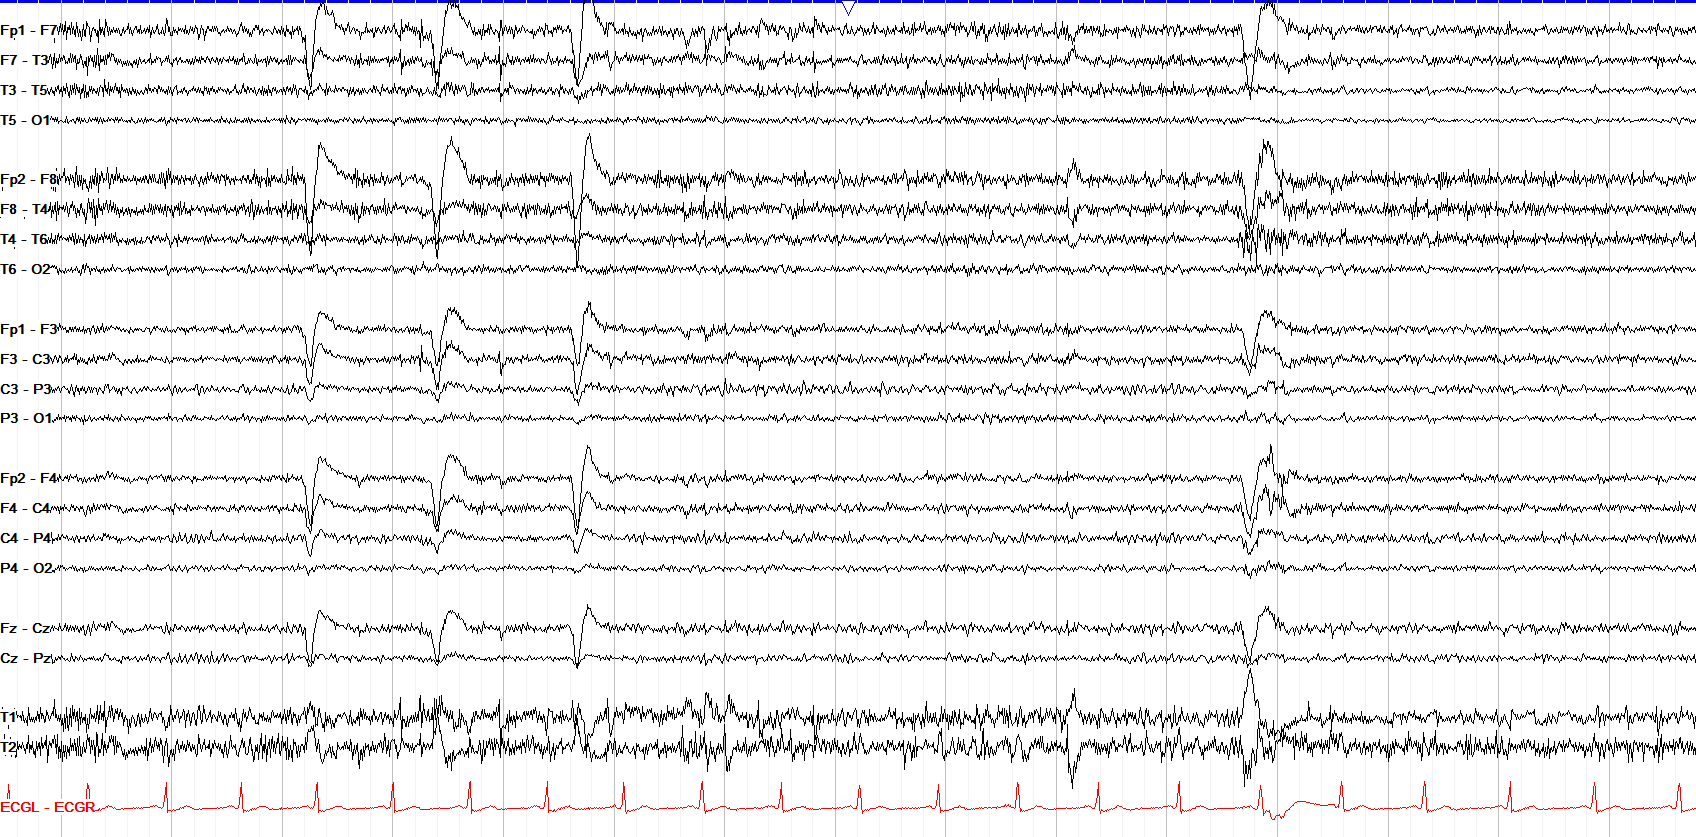
Low frequency (aka high pass) filters remove frequencies below a certain threshold. Setting them too high can remove important delta activity, while setting them too low allows excess sweat and movement artifact through. The standard LFF is 0.5-1 Hz.
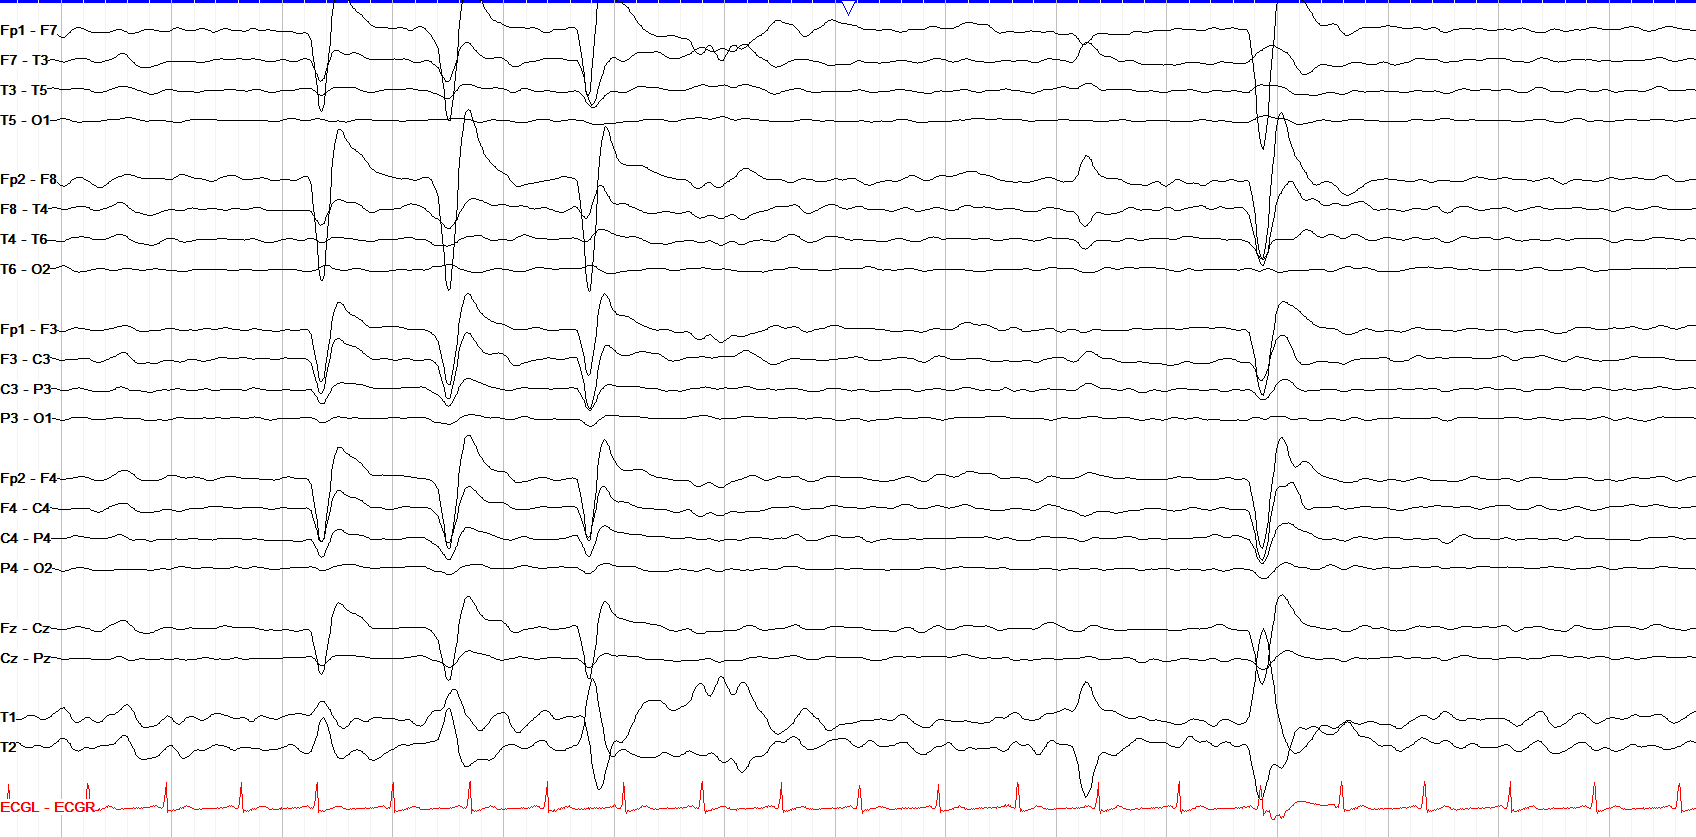
High frequency (aka low pass) filters remove frequencies above a certain threshold. Setting them too low can remove important alpha and beta activity, while setting them too high allows excess myogenic artifact through. The standard HFF is 70 Hz.
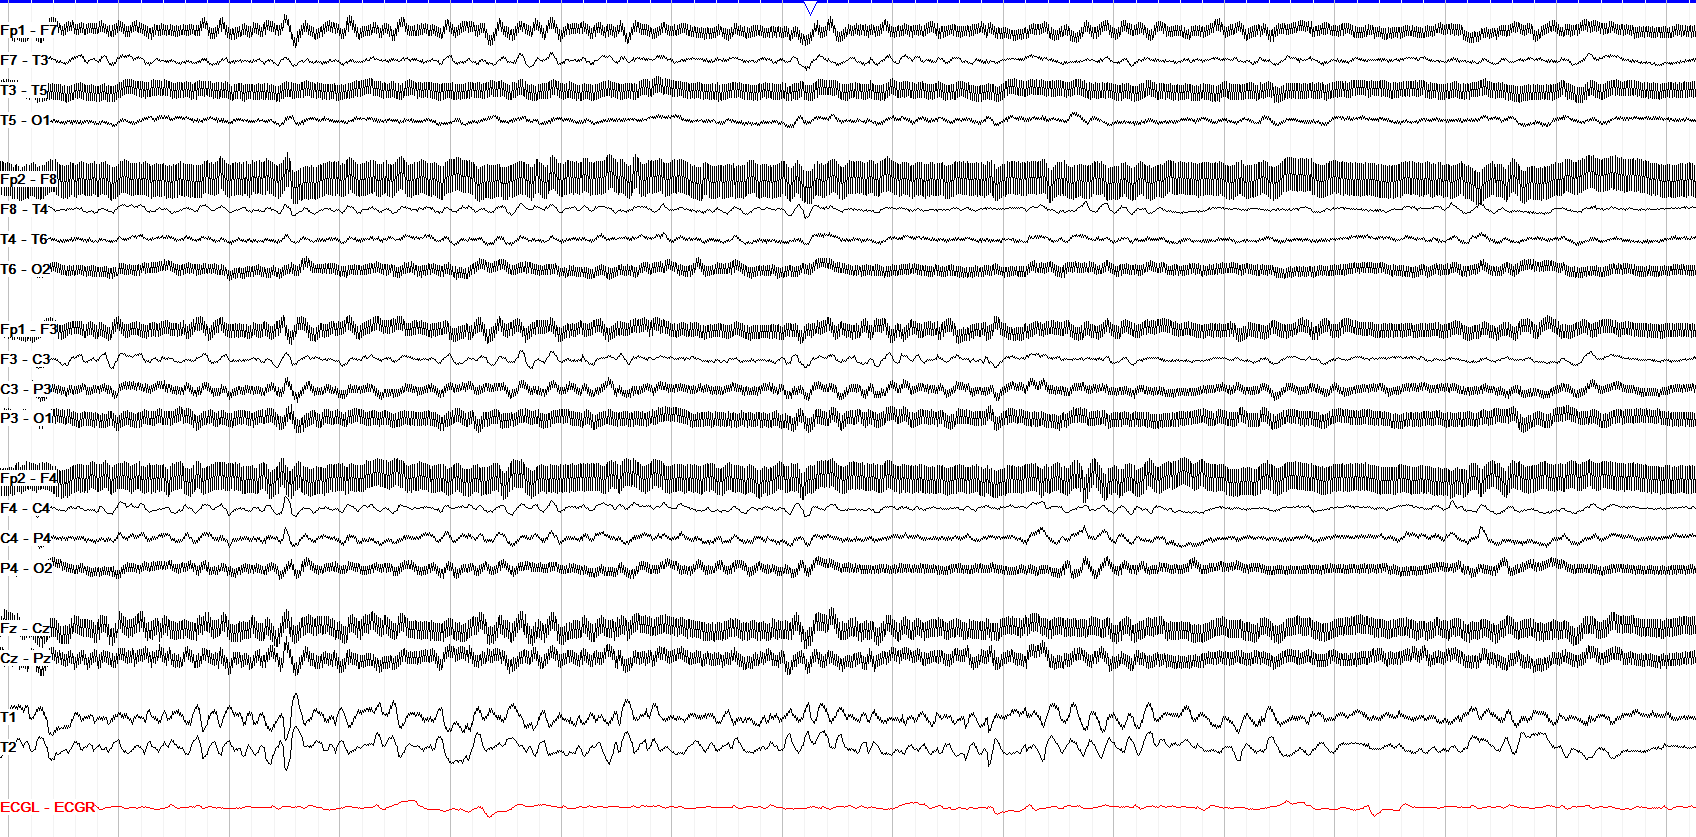
The notch filter is a special filter that selectively removes activity immediately around 60 Hz, filtering out unwanted electrical activity from sockets, chargers, ventilators or other electric machines. Notice here the regular, zipper-like activity over the entire tracing; this is 60 Hz electrical artifact seen with the notch filter turned off.