EEG Measures Summated Activity
Neurons communicate through a combination of chemical neurotransmitters and electrical gradients, and electroencephalography (EEG) detects those electrical gradients to provide insight into the activity of the brain. Any single neuron's electrical activity is far too minuscule to be detected by scalp EEG, so what is seen is rather a summation of many neurons' activity; in fact, we require at least 6 square centimeters of synchronized cortical activity for anything to be detected on scalp EEG. Here we'll review the basics of neural signals and how those are converted to the tracings you'll read on EEG.
Resting & Action Potentials
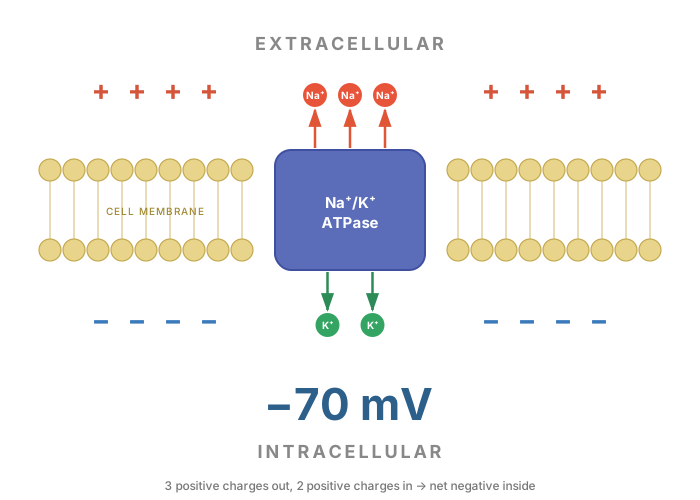
Neuronal membranes have a multitude of ion channels and pumps that maintain order and control signals in and around themselves. Perhaps the most important of these is the sodium-potassium pump, which maintains the basal resting potential of the neuron by pumping three Na+ ions out of the cell for every two K+ ions it pumps into the cell. Because there are relatively more positive ions outside the cell, this creates an electrical gradient with a resting potential inside the cell of -70mV.
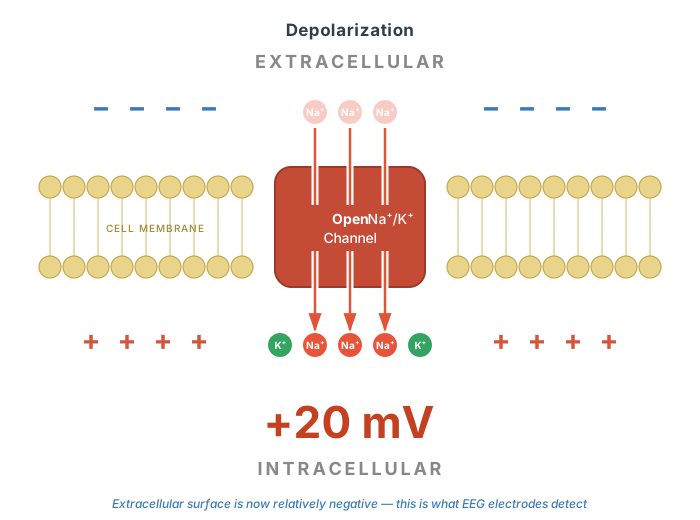
Signals move through a neuron via an action potential, in which a region of the neuron undergoes depolarization via opening of voltage-gated sodium channels leading to a rush of Na+ into the cell, with subsequent loss of the basal resting potential (so the usual -70mV may go, for example, to +20mV). Pertinent for EEG is that this depolarization also leads to a relatively negative voltage outside the cell.
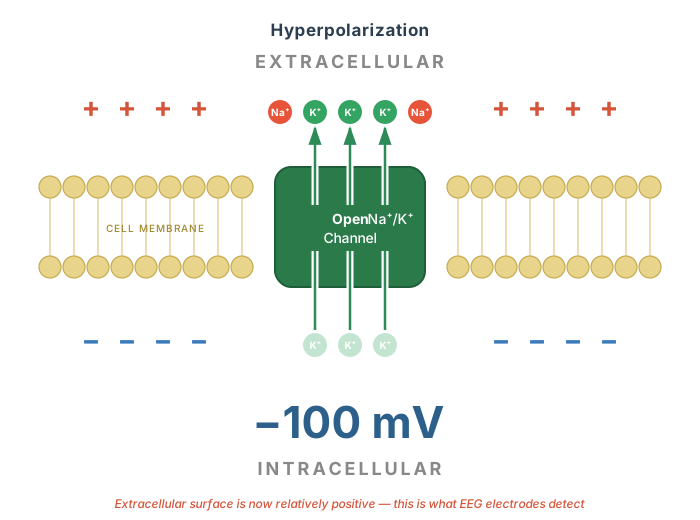
Contrary to depolarization, hyperpolarization occurs when there is exaggerated movement of K+ out of the cell to cause the resting intracellular voltage to become more negative, say from -70mV to -100mV. Pertinent for EEG in this case is that hyperpolarization leads to a relatively positive voltage outside the cell. Most commonly, hyperpolarization occurs briefly and immediately after a depolarization as part of the refractory period in which the usual membrane potential is restored; however, neurotransmitters also play a role in causing these dual mechanisms.
While action potentials transmit signals through a single neuron, neurons communicate with each other at their synapses via neurotransmitters. Excitatory neurotransmitters such as glutamate bind to postsynaptic receptors and cause an excitatory postsynaptic potential (EPSP) to promote subsequent depolarization and propagation of a signal through a network of neurons. Inhibitory neurotransmitters, such as GABA, cause an inhibitory postsynaptic potential (IPSP) to promote hyperpolarization and cessation of further signal propagation through a network.
The resting membrane potential of neurons is -70mV, and depolarization leads to propagation of a signal through a neuron while hyperpolarization leads to inhibition of signal propagation. Any positive shift in the neuron's intracellular voltage (ex from -70 to -10mV) pushes it closer to depolarization and firing, while any negative shift in the neuron's intracellular voltage (ex from -70 to -90mV) pushes it away from depolarization and towards a continued resting state.
The Creation of EEG Signal
Recall that depolarization leads to an extracellular negative voltage, while hyperpolarization leads to an extracellular positive voltage. Either way, this extracellular voltage is picked up by EEG electrodes, which see not a single depolarization but rather a summation of the voltages from many EPSPs and IPSPs over a broad area of cortex arising from pyramidal neurons.
However, EPSPs and IPSPs with their respective voltage changes are not the full picture. This is to say, not every EPSP will be seen as a negative signal on EEG despite the coinciding extracellular negative potential. Remember that the brain is more than just a bunch of neurons—it is a very organized bunch of neurons, and that organization affects what portion of a neuron's activity is seen by the EEG electrode.
Specifically, cortical neurons are arranged in columns perpendicular to the cortex surface, and depolarizations at the surface levels cause different signals than those in the deep levels. With surface level depolarizations, the extracellular space closest to the EEG electrode is negatively charged, and that is simply what the EEG sees.
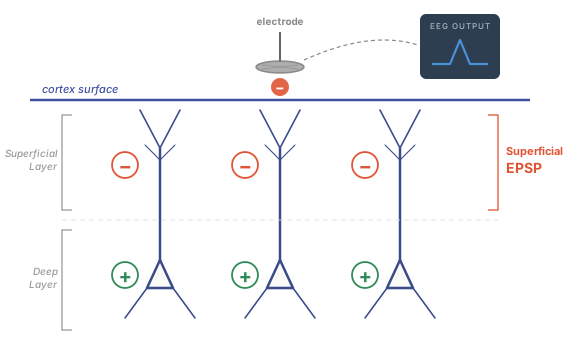
However, with deeper depolarizations, the extracellular area immediately around the area of depolarization is negative as expected, but that causes the extracellular space closer to the surface to become relatively positively charged, and that positive charge is what the EEG electrode sees.
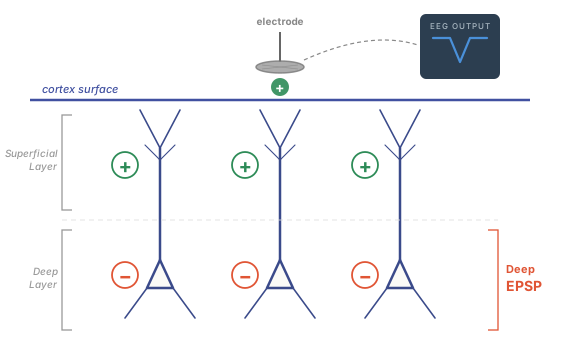
So, superficial depolarizations lead to negative EEG signals while deep depolarizations lead to positive EEG signals. The opposite is true for hyperpolarizations, which behave the same but with inverted polarity: deep hyperpolarizations cause a negative scalp EEG signal, and surface hyperpolarizations cause a positive scalp EEG signal. In other words, for EEG signal surface EPSPs and deep IPSPs look the same, and deep EPSPs and surface IPSPs look the same.
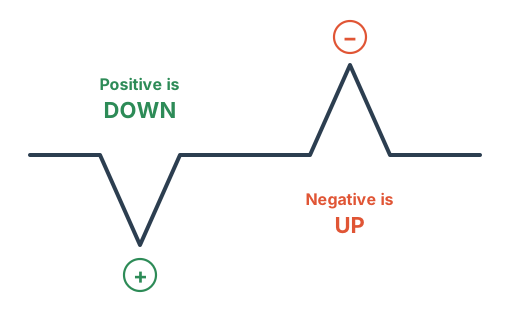
Once a potential is seen by an EEG electrode, it's converted into the waveforms you see on the EEG itself. The exact appearance of the waves on the tracing depends on the chosen montage, but there is one universal albeit initially counterintuitive rule: negative potentials are upgoing waves, and positive potentials are downgoing waves.
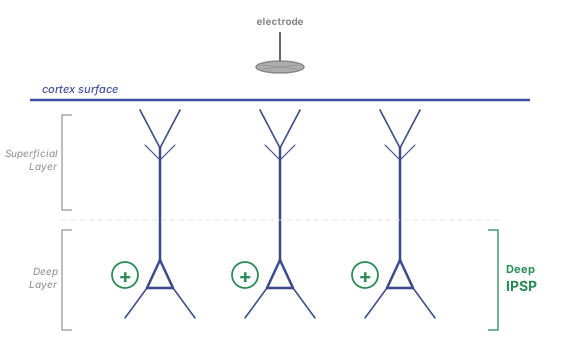
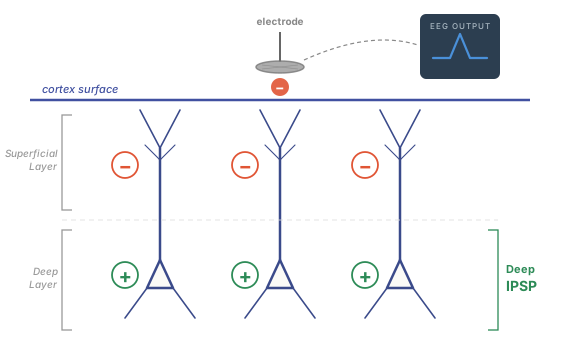
Recall that IPSPs promote hyperpolarization, in which K+ moves out of the cell and causes the interior of the cell to become more negative than usual. Thus, the extracellular space becomes relatively positive. In this case, the IPSP targets the deeper portions of the neuron column, so the deep extracellular area becomes positive while the adjacent superficial area becomes relatively negative. It is this superficial negative charge that the scalp EEG electrode is able to see, and thus you'd see an upward deflection for this electrode on the tracing.
Electric Dipoles
Above, we discussed how superficial and deep EPSPs / IPSPs have different surface recordings; the underlying cause for this is the resulting dipole. Electric dipoles are simply a separation of charges; by creating a negative extracellular charge in one area, you create a relatively positive charge in an adjacent area, and a dipole is formed.
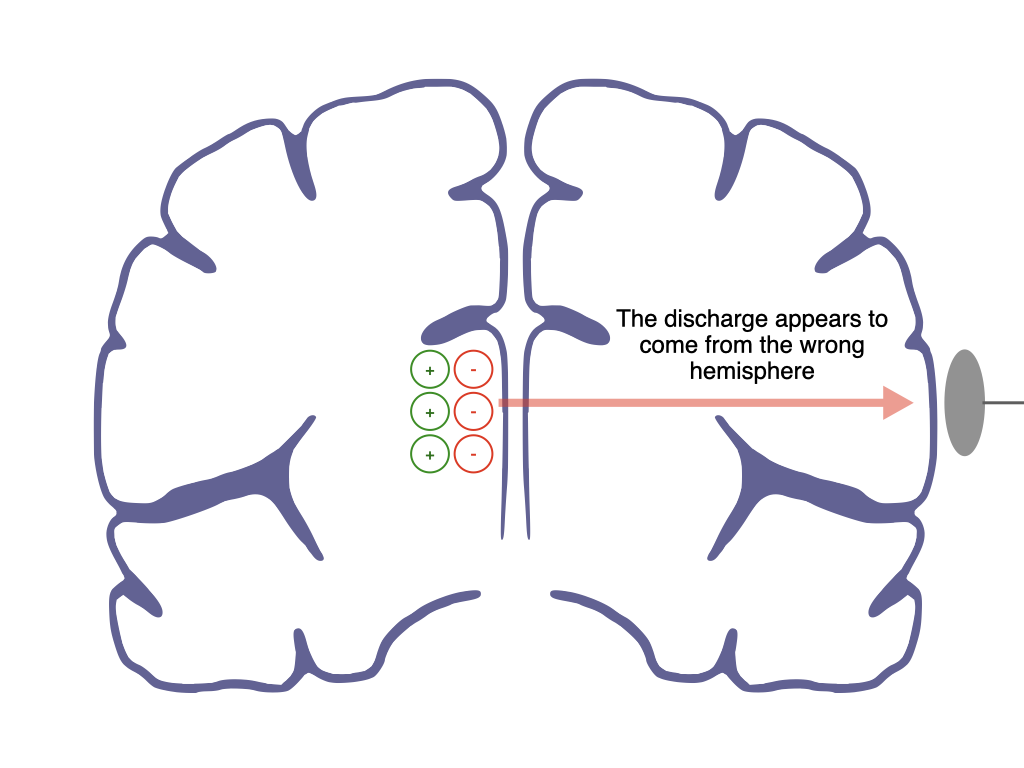
Dipoles are important to understand for interpreting EEGs because the EEG signal varies according to the direction of the measured dipoles. In short, dipoles perpendicular to the cortex are well seen on EEG, but those parallel or tangential to the scalp, or those with complex metrics and multiple angles, are poorly seen or missed completely by scalp EEG. Furthermore, depending on the direction of a dipole, the resultant EEG may be falsely localizing and show a discharge in the wrong location; this is further discussed in the epileptiform activity section.
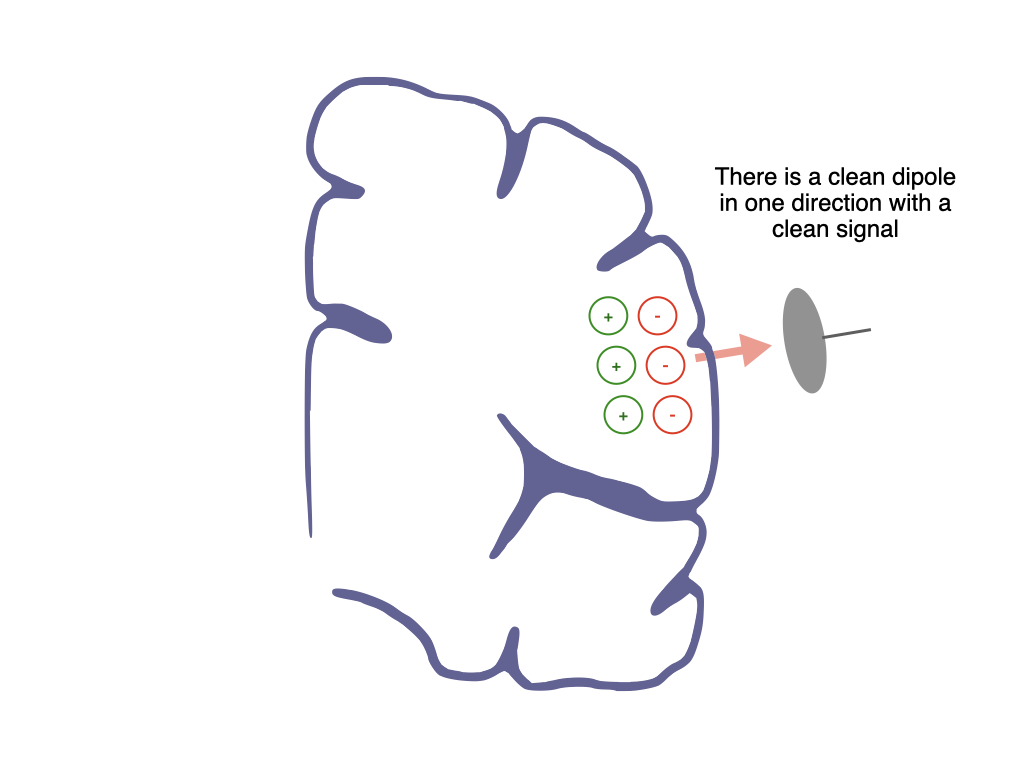
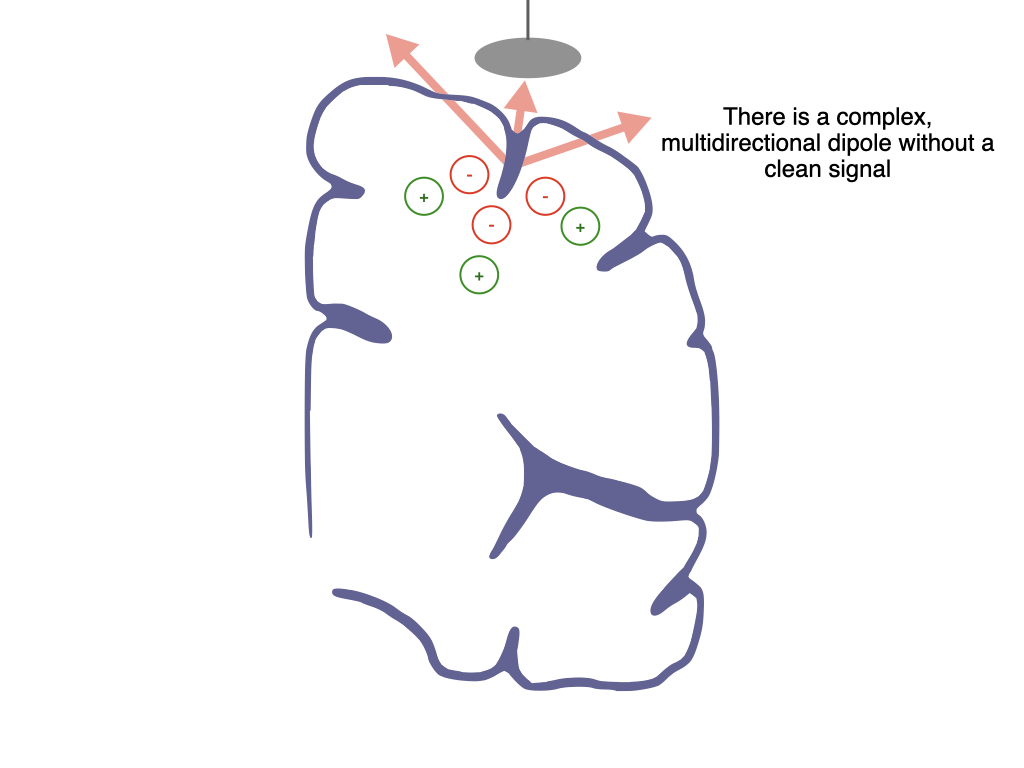
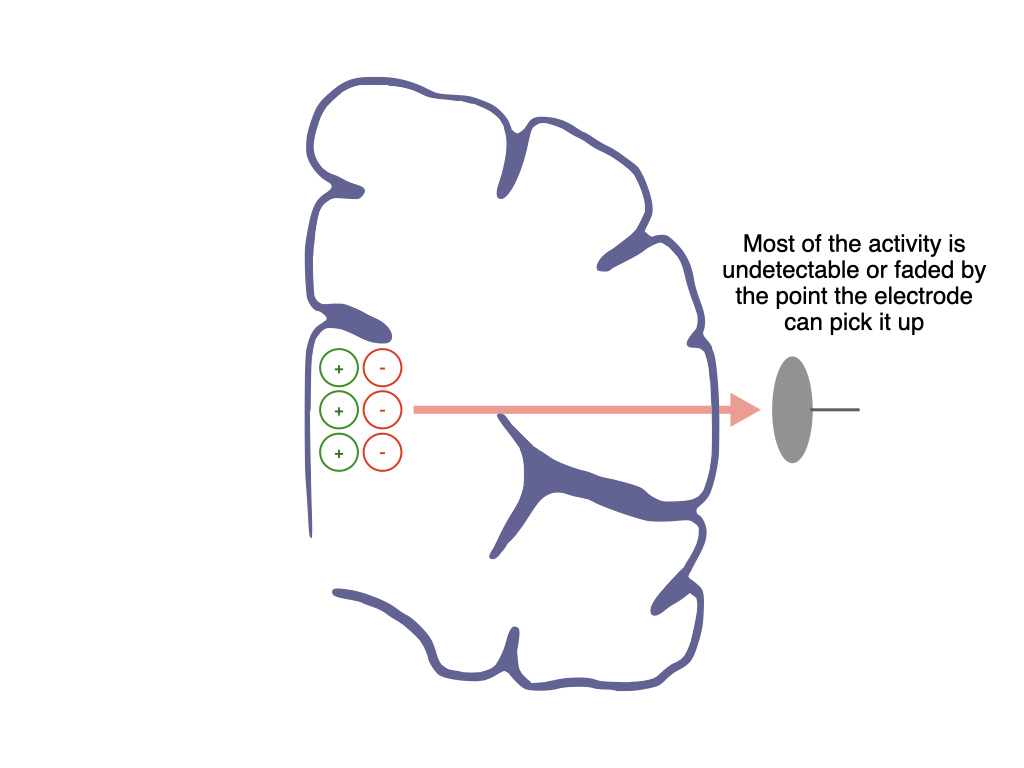
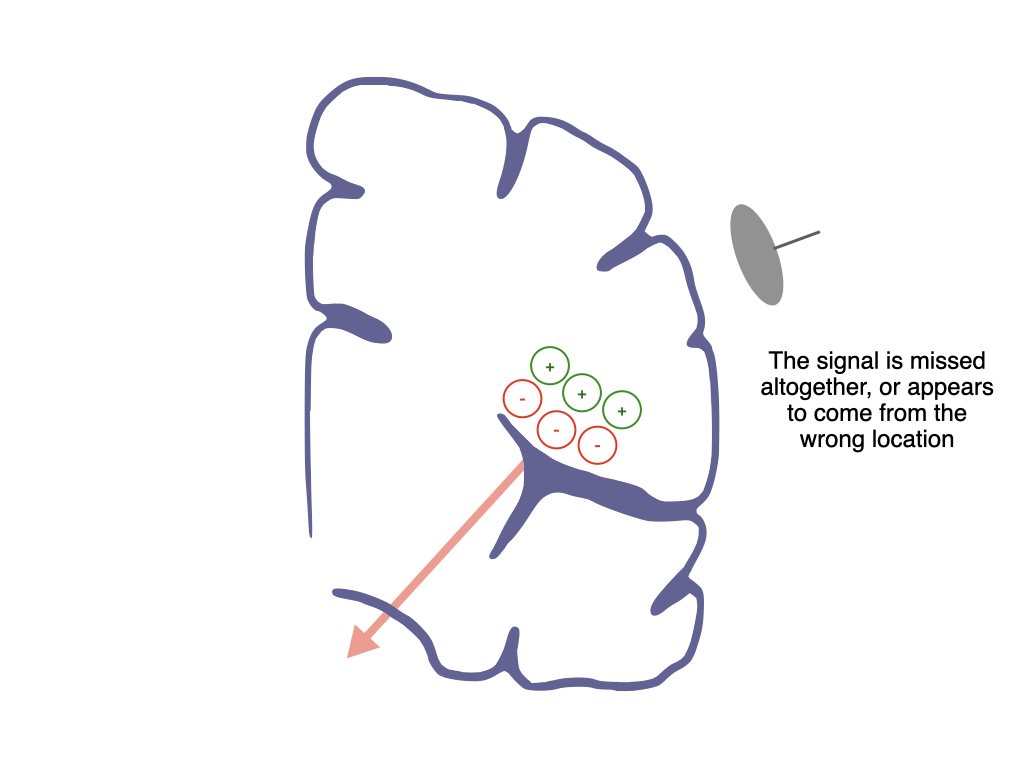
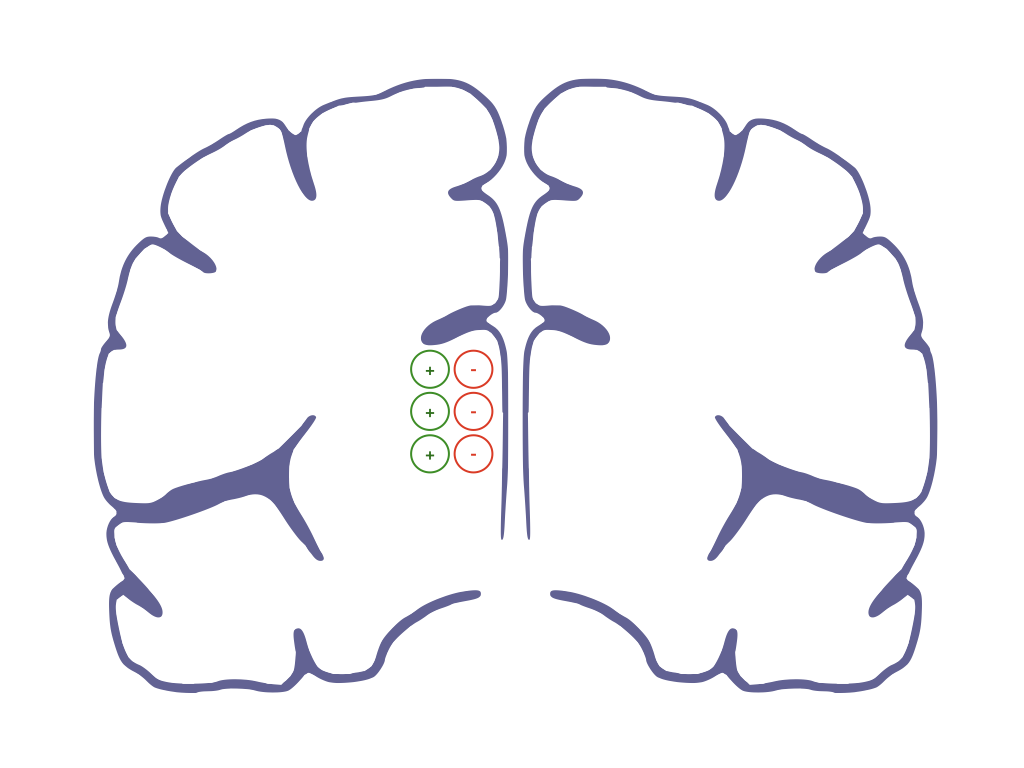
Remember that the direction of a dipole determines both how and where it shows up on the EEG. Transverse superficial dipoles are most easily seen and most accurate on EEG, but tangential dipoles can be more tricky. However, in the interhemispheric fissure transverse dipoles can still be problematic, because if their negative component faces towards the contralateral hemisphere, the discharge may appear to come from that contralateral side. This could be a huge problem if, for example, you're planning a resective epilepsy surgery or implantation of a responsive nerve stimulator (RNS) device for focal refractory epilepsy.
EEG Is a Language of Its Own
Now that you know how EEG signal is created, let’s turn to how you interpret and communicate the tracings to which that basic biology gives rise. The first step is learning to differentiate the many different individual and groups of waveforms you’ll come across, and the nomenclature used to describe them.
Frequency
Recognizing the frequency of the waveforms is fundamental to interpreting EEG. Frequency describes how many waves there are per second, and is measured in hertz (Hz). There are four main frequencies of the human brain seen on scalp EEG, in increasing order: delta, theta, alpha and beta.




Delta is the slowest at 0-4 Hz, and generally speaking should not be present in a normal awake brain. It is the de facto finding of slow wave sleep, where it’s seen diffusely, but is also commonly found overlying structural abnormalities such as tumors, or over the bifrontal regions in some patients with encephalopathy.
Theta ranges from 4-8 Hz, and tends to be more prominent in childhood than adulthood. However, theta re-emerges often in drowsy periods, and is the hallmark of some normal findings including rhythmic temporal theta of drowsiness (RMTD).
Alpha is 8-13 Hz, and is perhaps the frequency you’ll come to know and love best. It is the hallmark frequency of the normal awake adult brain, to the point that the posterior dominant rhythm (PDR), a key finding of the normal background, used to be called the alpha rhythm.
Beta is 13-30 Hz, and is often seen more in the frontal regions during wakefulness. More diffuse beta activity can be found most often with benzodiazepine use. Of note, there is technically an even faster frequency, gamma (30 Hz and above) but this is not reliably seen from physiologic activity on scalp EEG.
Realistically, frequencies on EEG will almost never be as clean as the above examples. Instead, you’ll see a mixture of frequencies overlying one another; for example, you can have beta activity on top of slower delta activity, which could be termed delta with overriding beta, or delta with admixed beta.
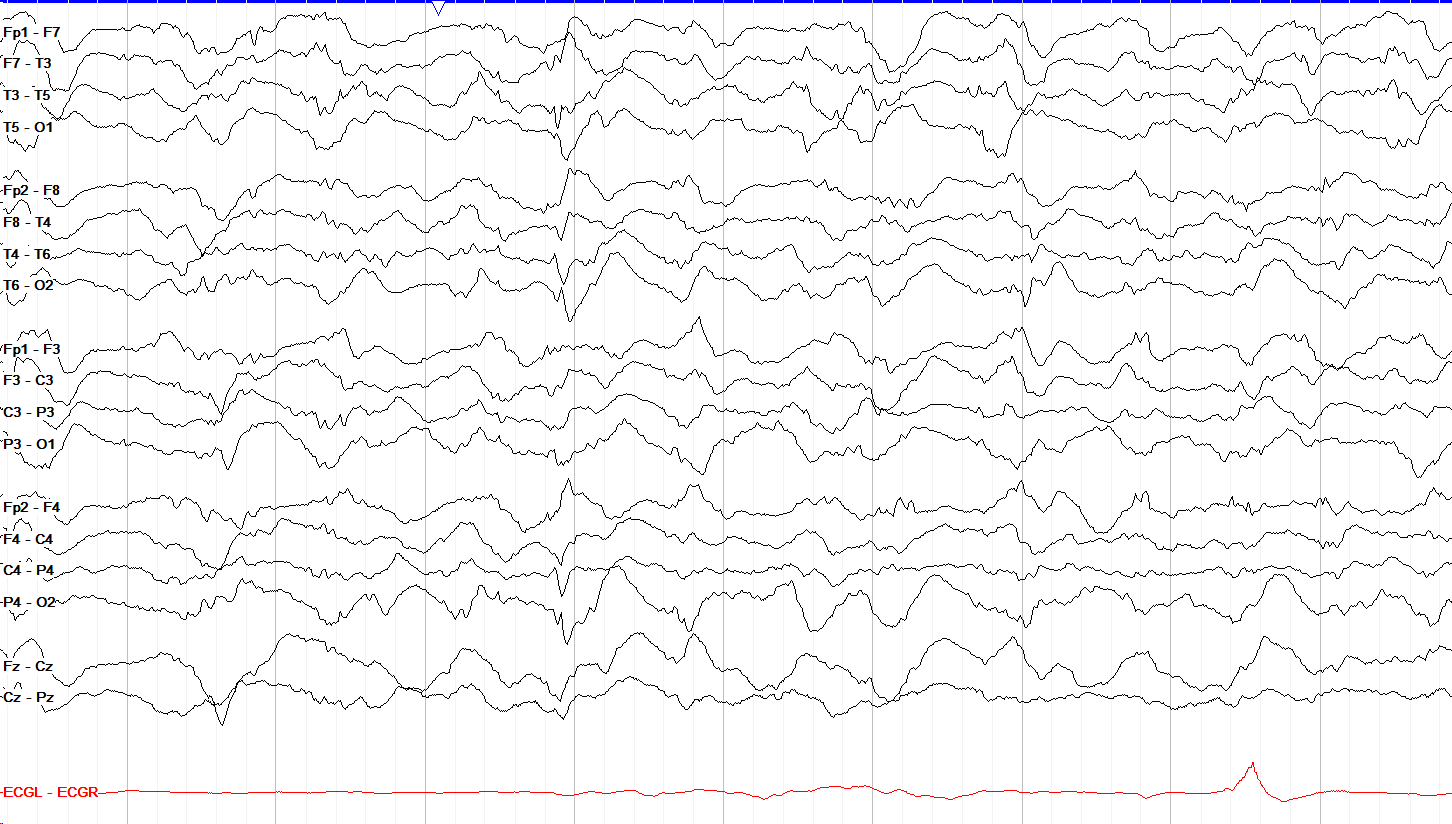
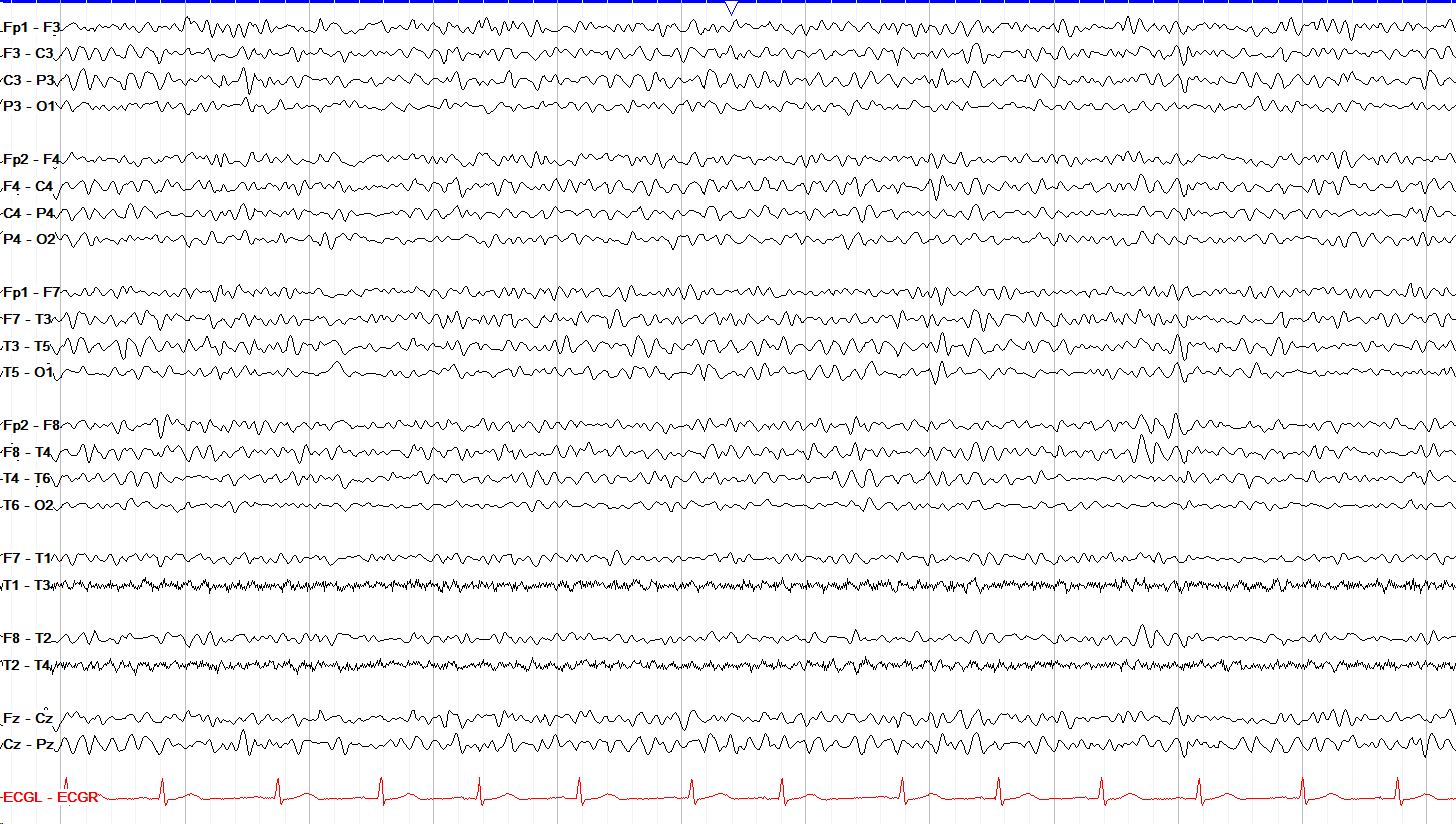
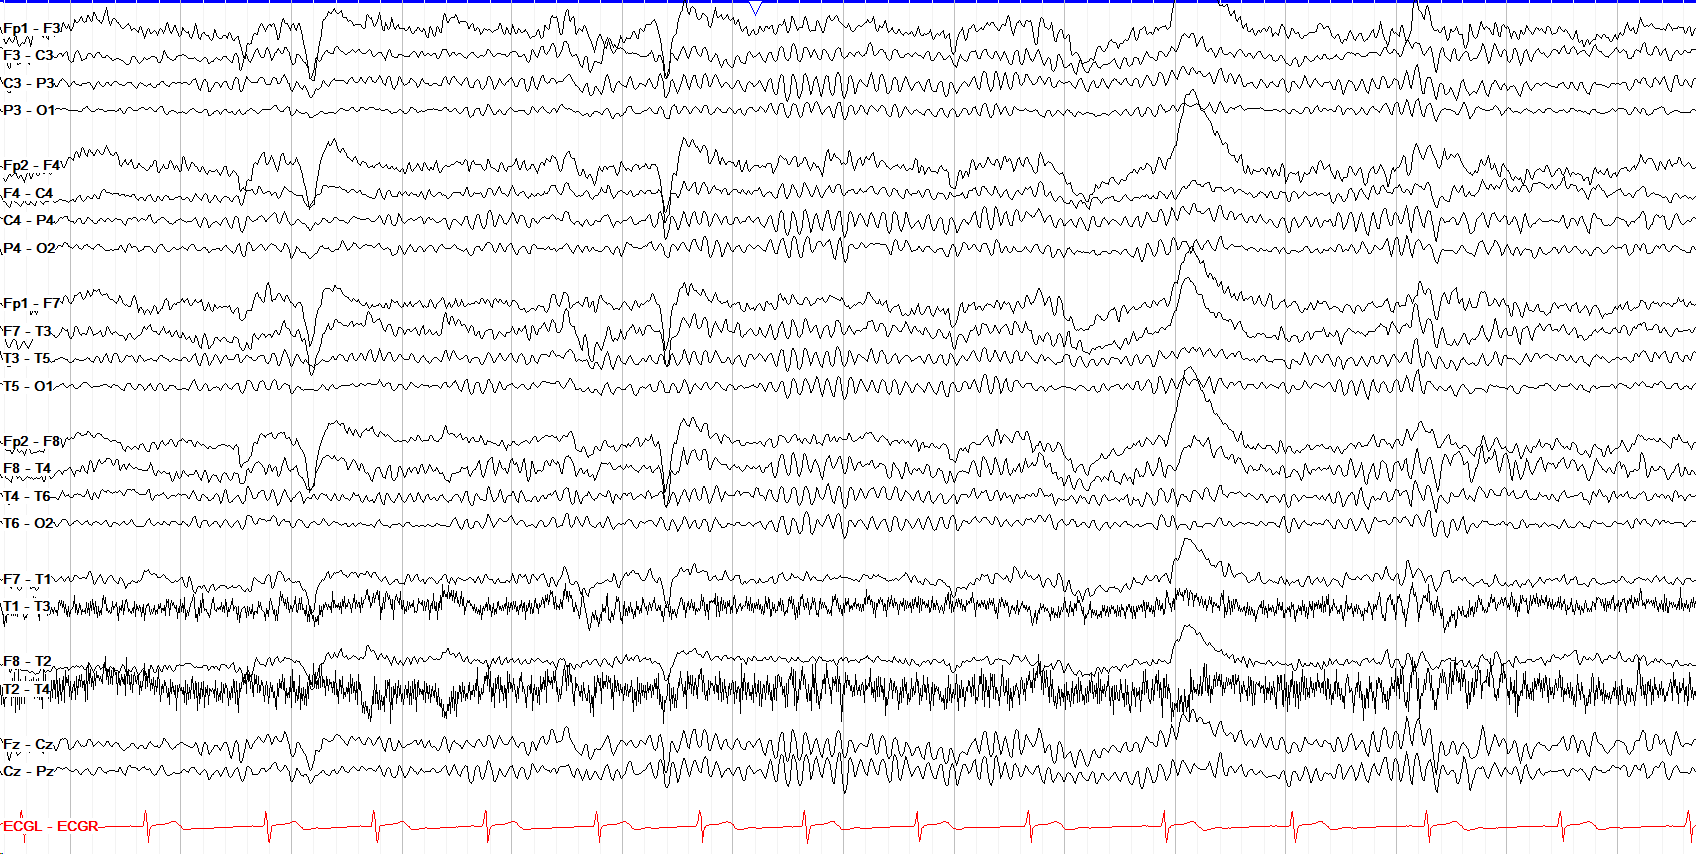
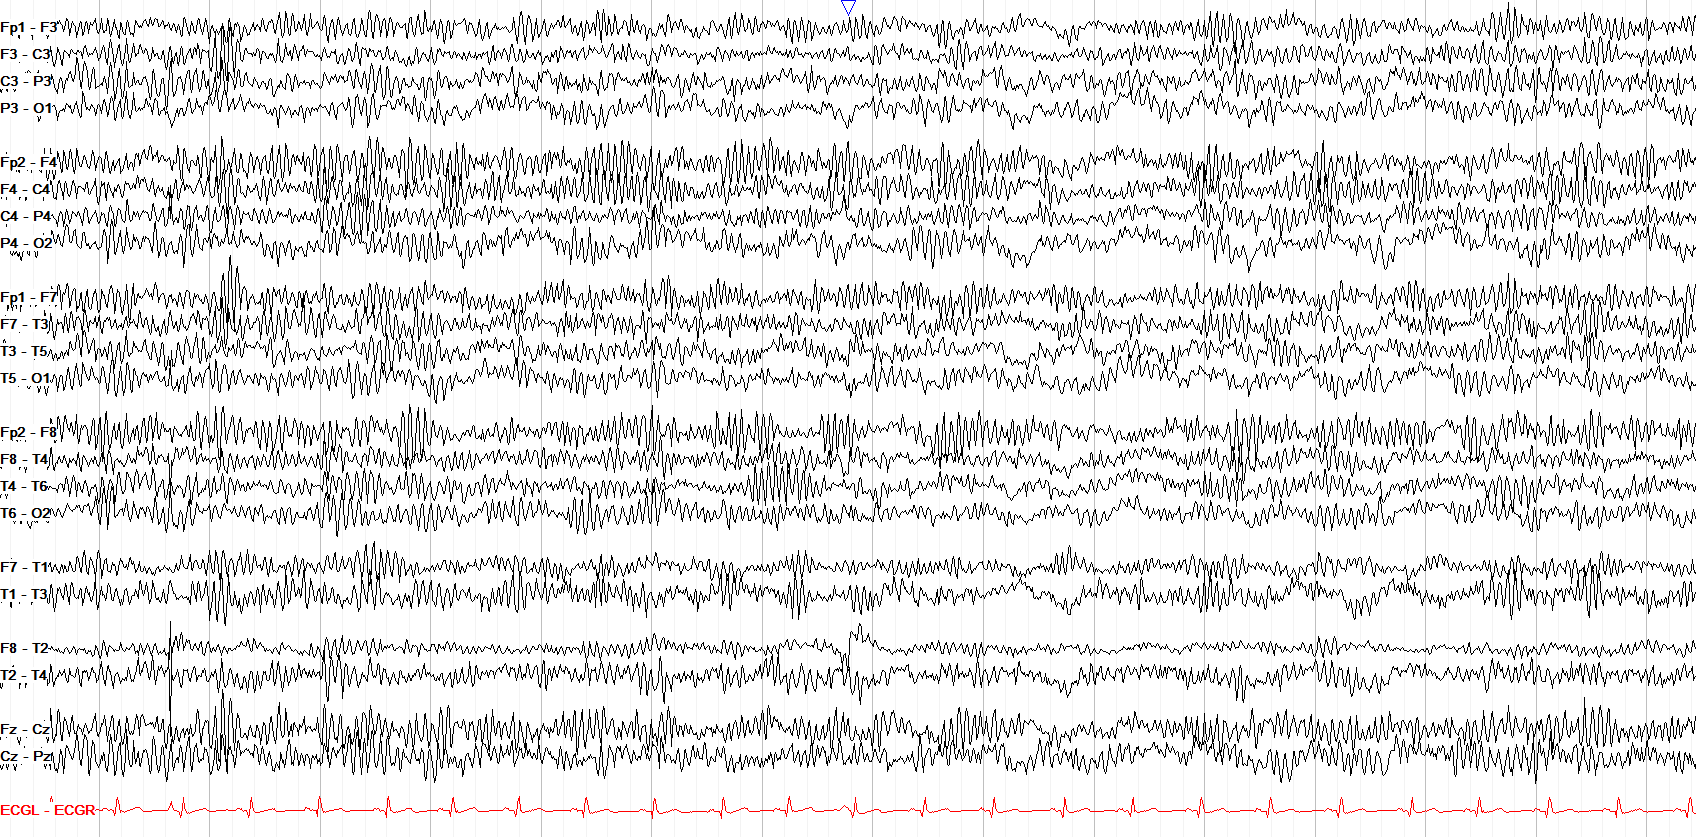
While this isn’t a rule, for physiologic waveforms frequency tends to be inversely related to amplitude, such that lower frequency waves (delta, theta) are often higher amplitude while higher frequency waves (alpha, beta) are lower amplitude.
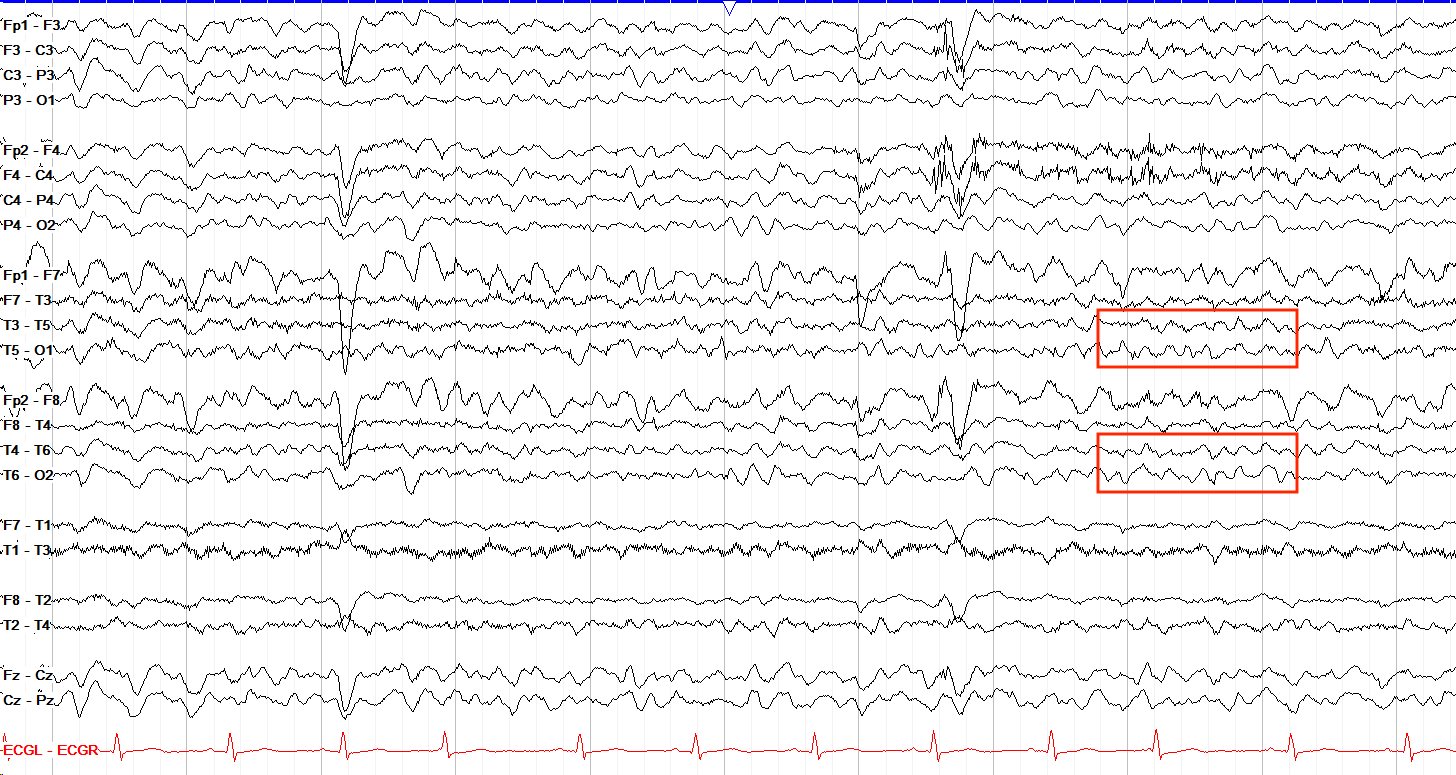
The selected area shows approximately 6 waveforms per second, making it theta as it falls within the theta range of 4-8 Hz. Recall that delta goes from 0-4 Hz, alpha from 8-13 Hz, and beta is above 13 Hz. The dominant frequency of the awake adult brain should be alpha, while theta tends to emerge more in children and in periods of drowsiness.
Amplitude
Amplitude is the height of a waveform, essentially a proxy for the voltage, and on the scalp is measured in microvolts. The normal adult brain has amplitudes from 10 to 100 microvolts on the scalp, mostly in the 10-50 microvolts range. As mentioned above, there is generally an inverse relationship between amplitude and frequency. For epileptiform discharges and other activity, clarifying the amplitude of a discharge or pattern (low, moderate, or high) is an important part of the descriptor.
Don’t confuse amplitude and sensitivity—amplitude is an intrinsic variable of the waveform itself, while sensitivity is a technical choice that affects how the amplitude is perceived.
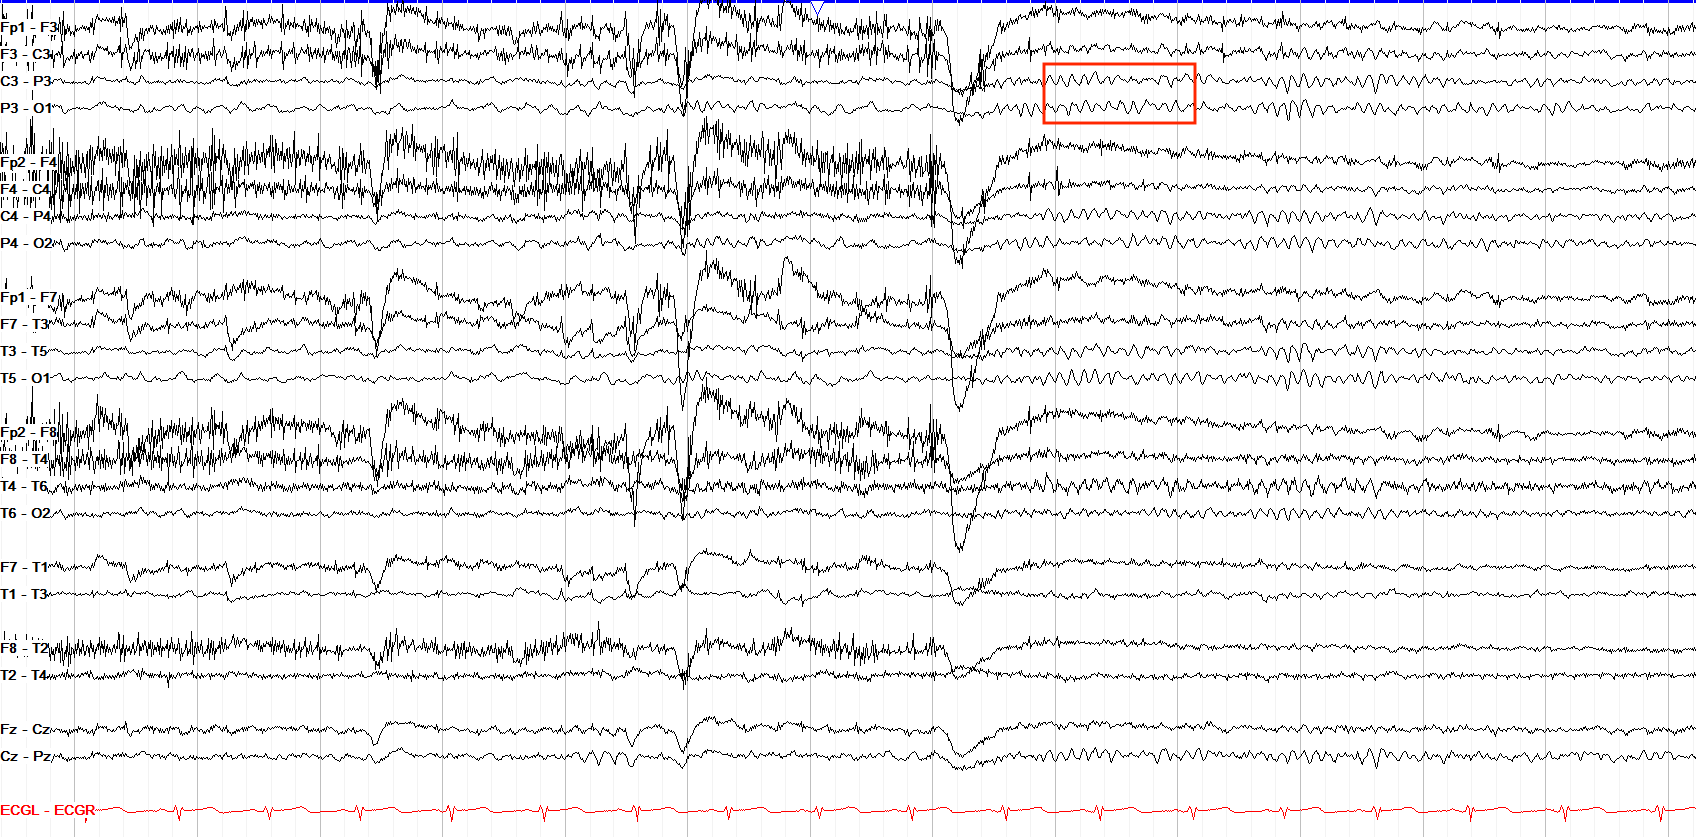
In counting the number of waves in this one second increment, there are 10, making this an example of an alpha frequency. This is actually an example of what is called the posterior dominant rhythm, which is discussed in the normal awake section and is a defining hallmark of the normal awake EEG.
Morphology
The morphology of a waveform describes its overall shape, and is important for both interpreting a tracing and communicating your findings. For an individual waveform, each part of a wave is considered a phase. It’s easiest to think of phases by picturing an imaginary horizontal line; a monophasic wave has one point and area under that point, on one side of the line; a biphasic wave has a point on both sides of the line. Spikes and sharps, both types of epileptiform discharges, are classically either monophasic or biphasic waves.
Triphasic waves have two points on one side and one point on the other side; the classic epileptiform spike and slow wave discharge is an example of a triphasic morphology (though, somewhat confusingly, the specific term "triphasic morphology" largely means something else nowadays, as discussed in the Rhythmicity, Periodicity & IIC section). Polyphasic waves cross the line multiple times, with multiple areas under their curve on both sides of the line.
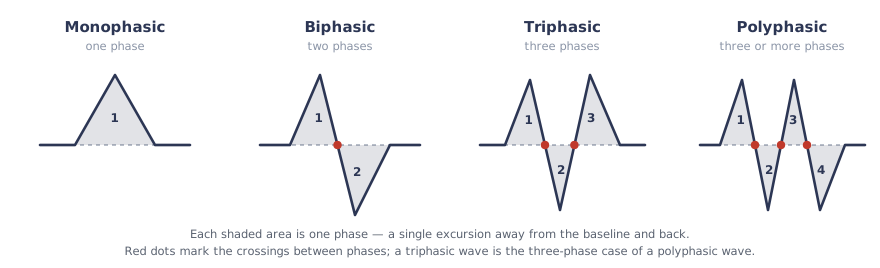
Beyond individual waves, you also have to understand the relationship of a waveform to its surrounding ones; namely, whether they are together polymorphic or monomorphic (periodic or rhythmic). As with so much of EEG, these patterns can be normal or abnormal depending on their context.
Polymorphic Patterns
Polymorphic waves vary in frequency and amplitude, so each wave is slightly different from those around it. A classic example of normal polymorphic activity is seen with slow wave sleep in which high amplitude, diffuse polymorphic delta waves predominate; an abnormal example is focal polymorphic delta slowing caused by tumors, strokes, or other structural irregularities.
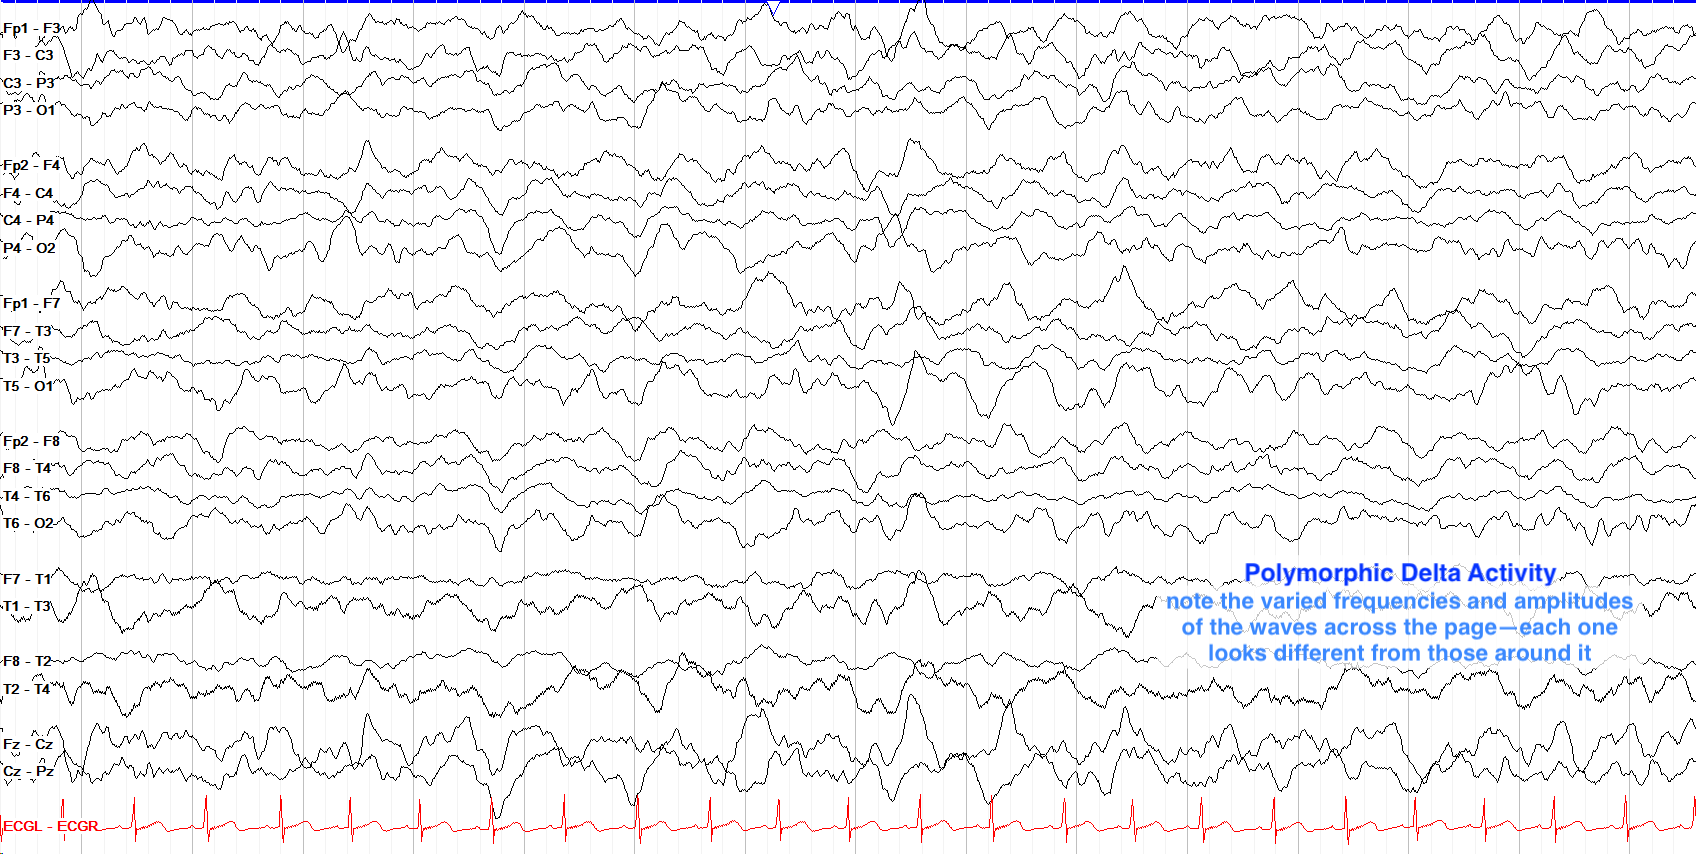
Rhythmicity & Periodicity
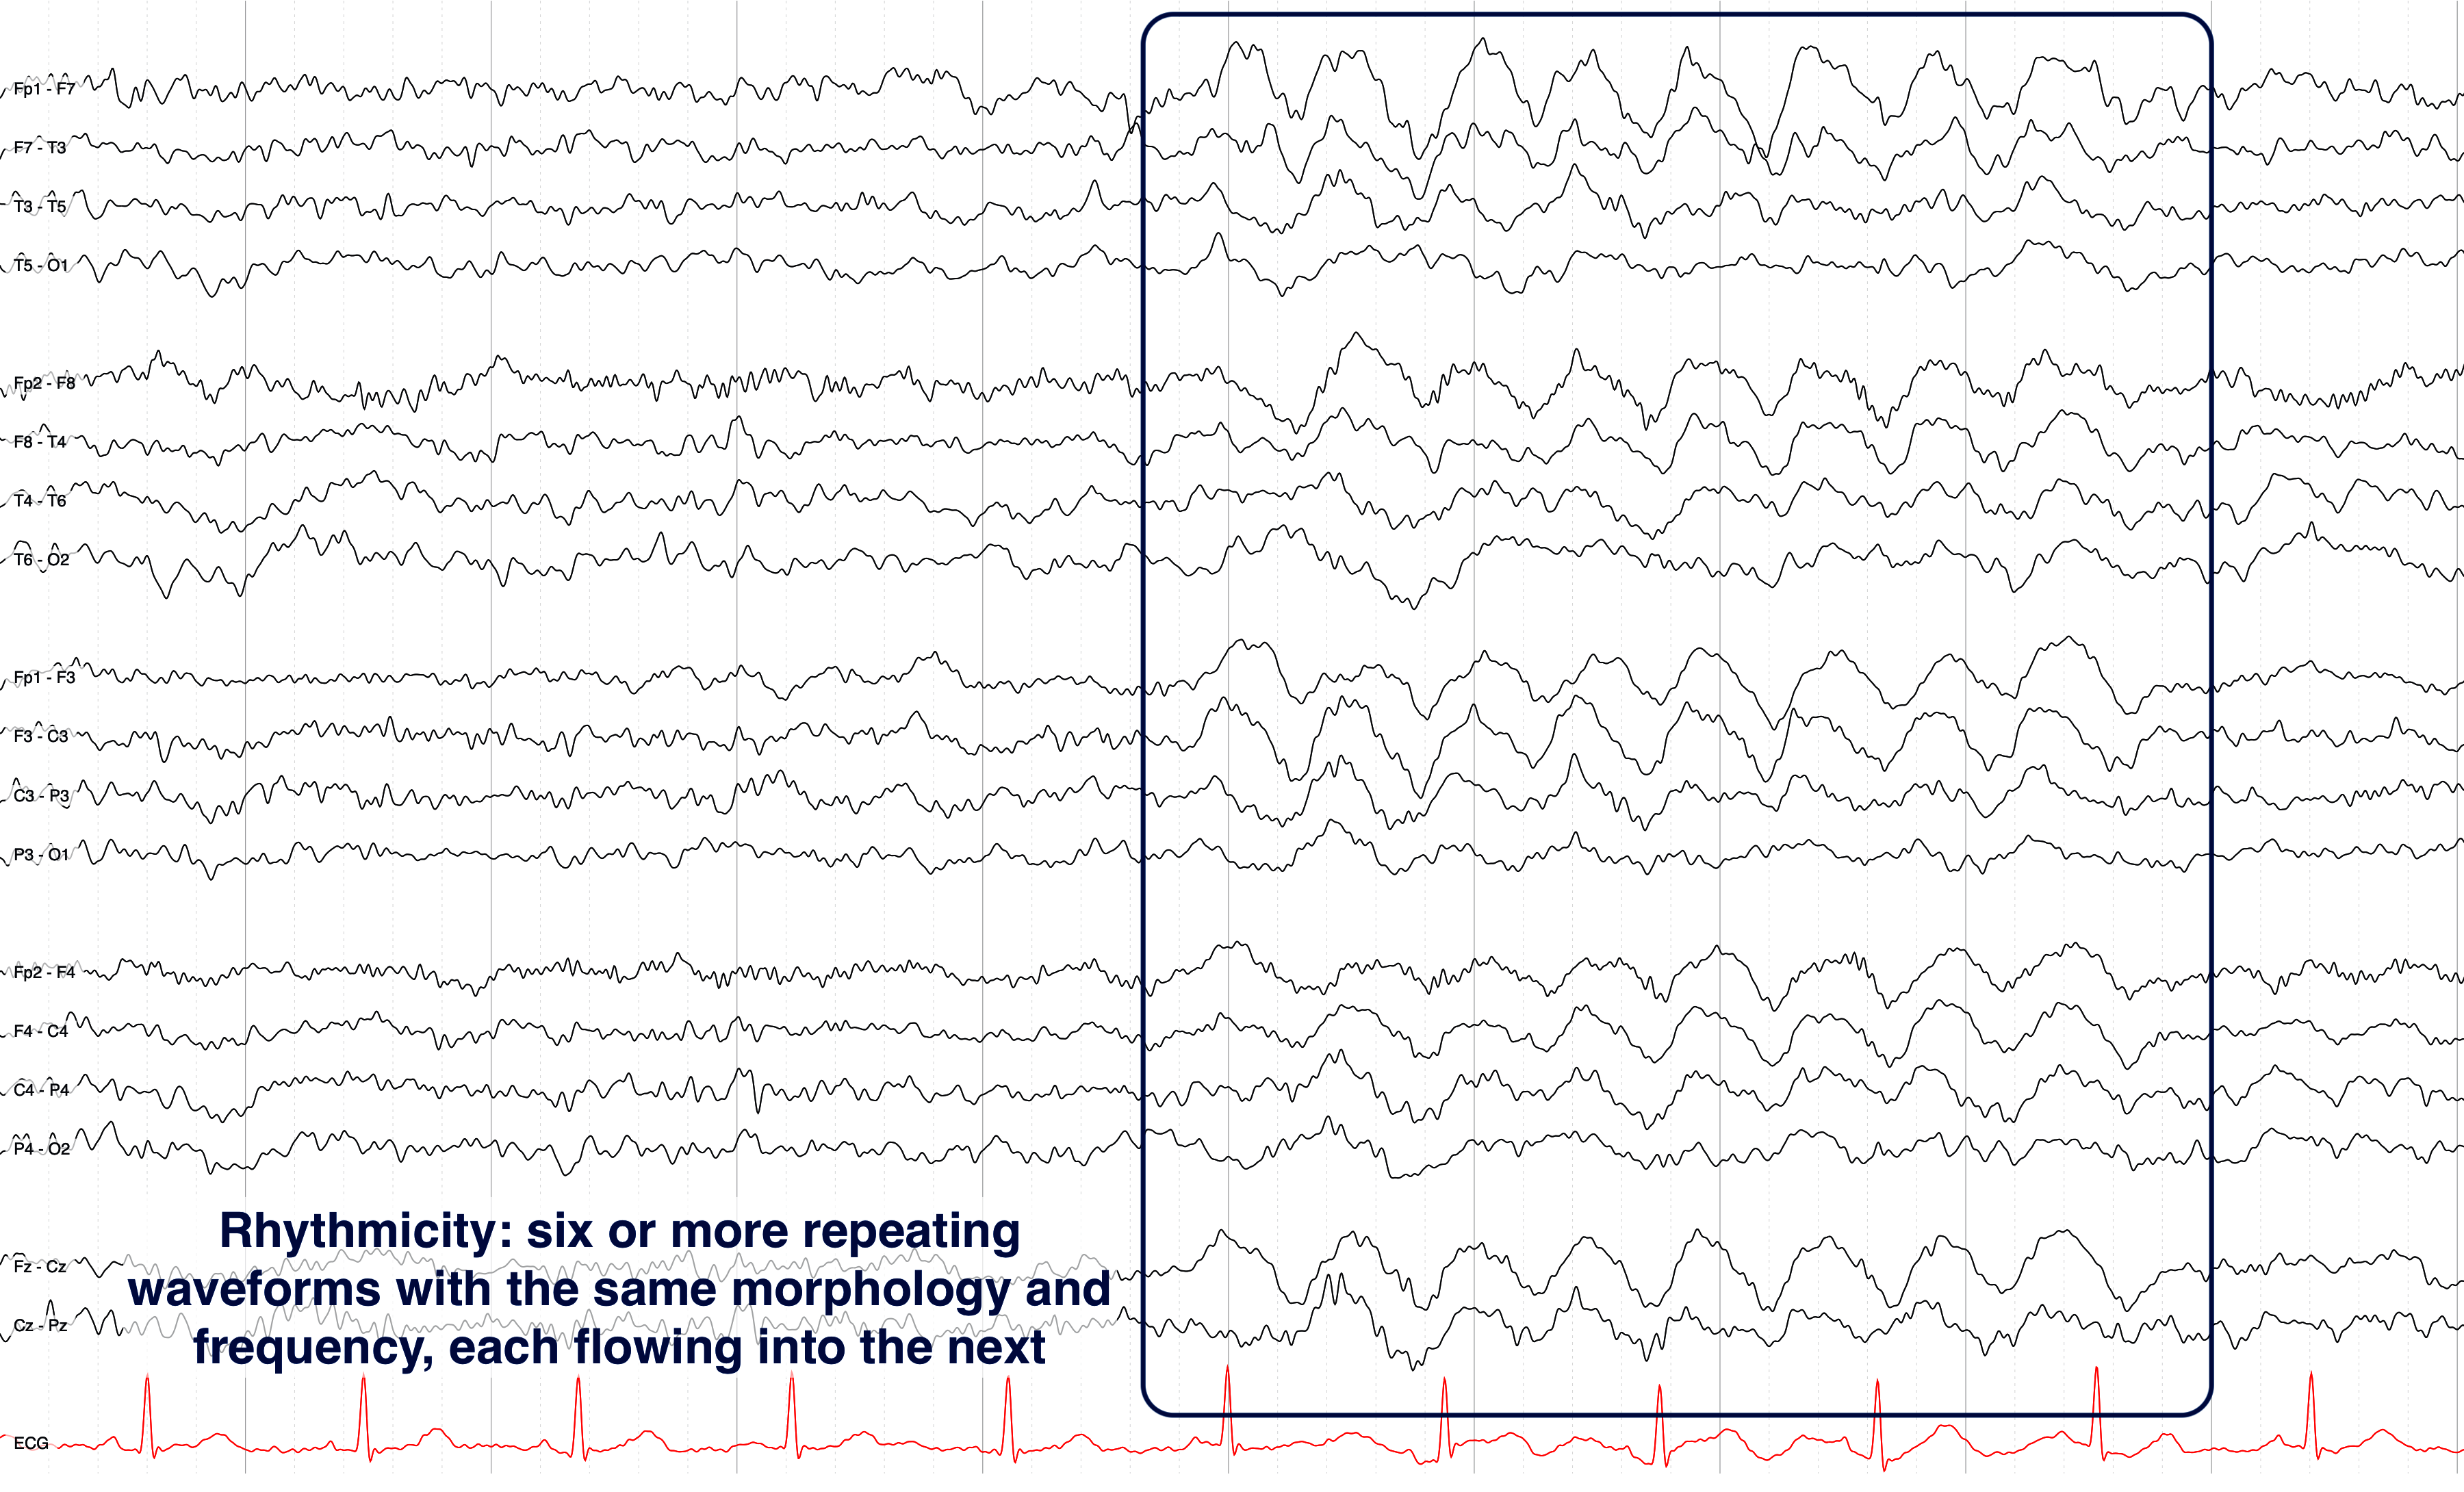
Monomorphic patterns have a common shape and frequency from one wave to the next, and if that repetition persists for at least six cycles (in other words, repeats continuously at least six times) they may be considered formally periodic or rhythmic. Periodic waveforms are discrete, with gaps between the end of one wave and the beginning of the next, while rhythmic ones flow directly from one into the next.
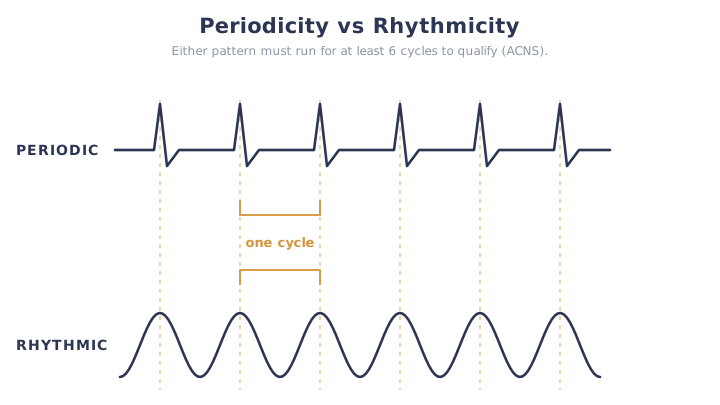
Notice in the pair of tracings below how both show activity at around 1.5 Hz with more than six cycles, but the first is periodic and the second is rhythmic.
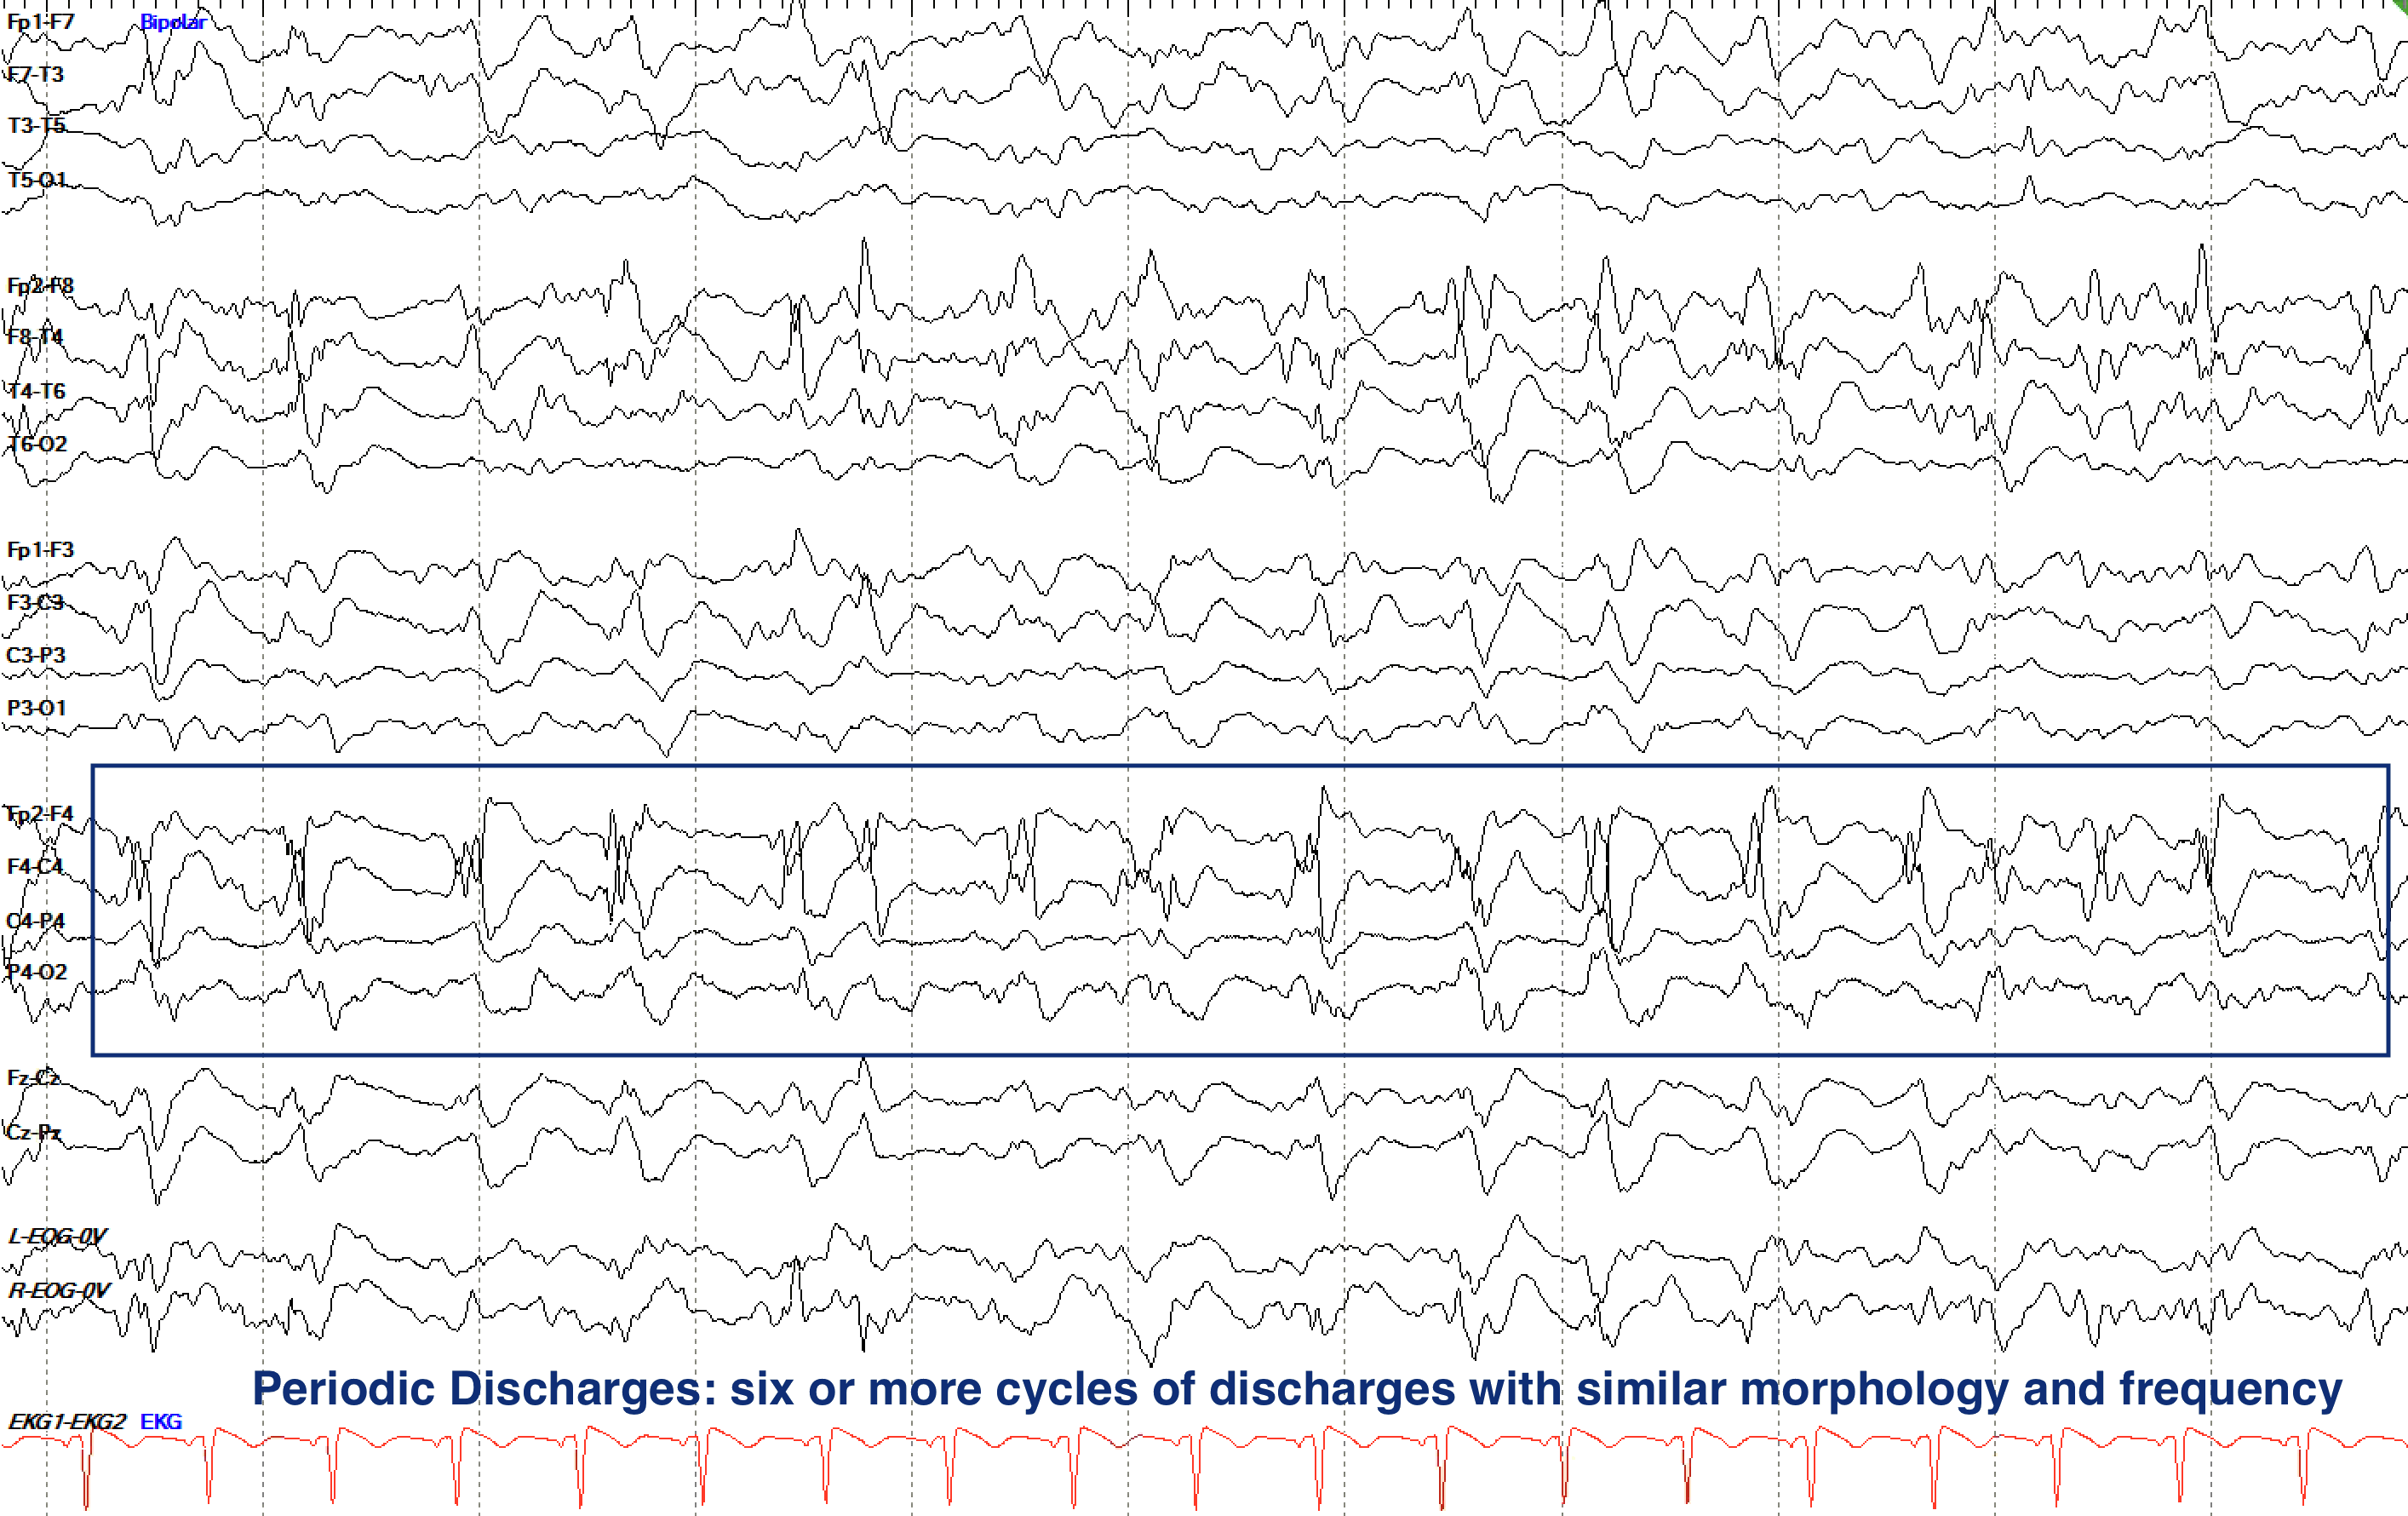
If the interval between each discharge in a periodic or rhythmic set of discharges varies by 25-50%, it is termed quasi-periodic or quasi-rhythmic. If the variance between each one is more than 50%, it isn’t actually periodic or rhythmic at all.
While rhythmicity can be a normal part of the background in particular cases, such as with the PDR and Mu rhythm, periodic or rhythmic runs that prominently stand out from the background tend to be suspicious for abnormal activity (discussed further in the epileptiform and non-epileptiform abnormalities sections). Seizures commonly show rhythmic or periodic patterns, including spike and wave activity.
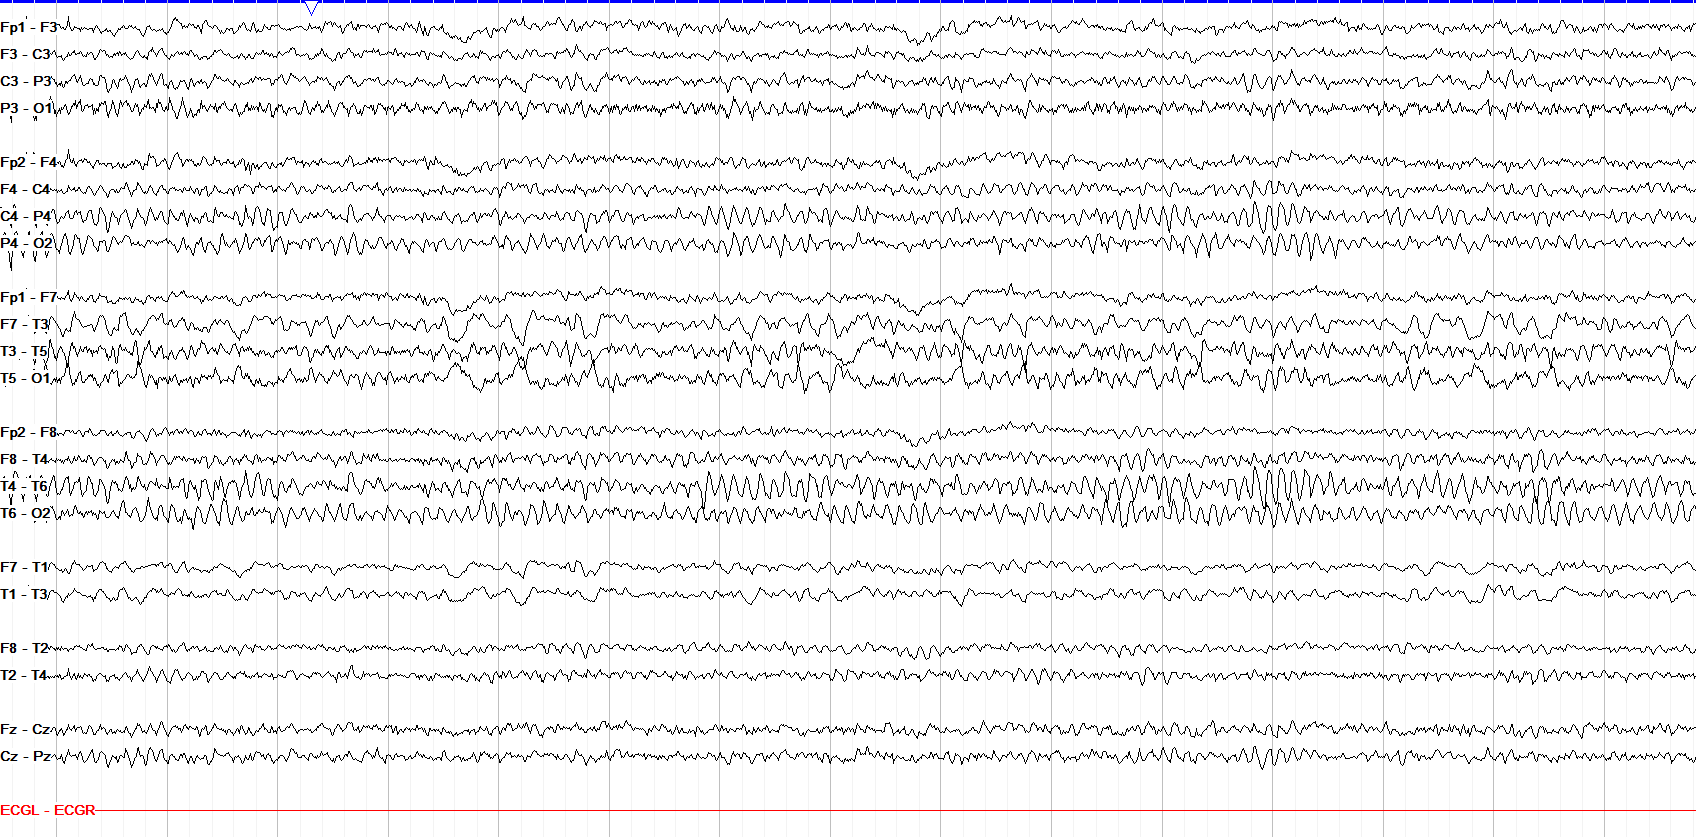
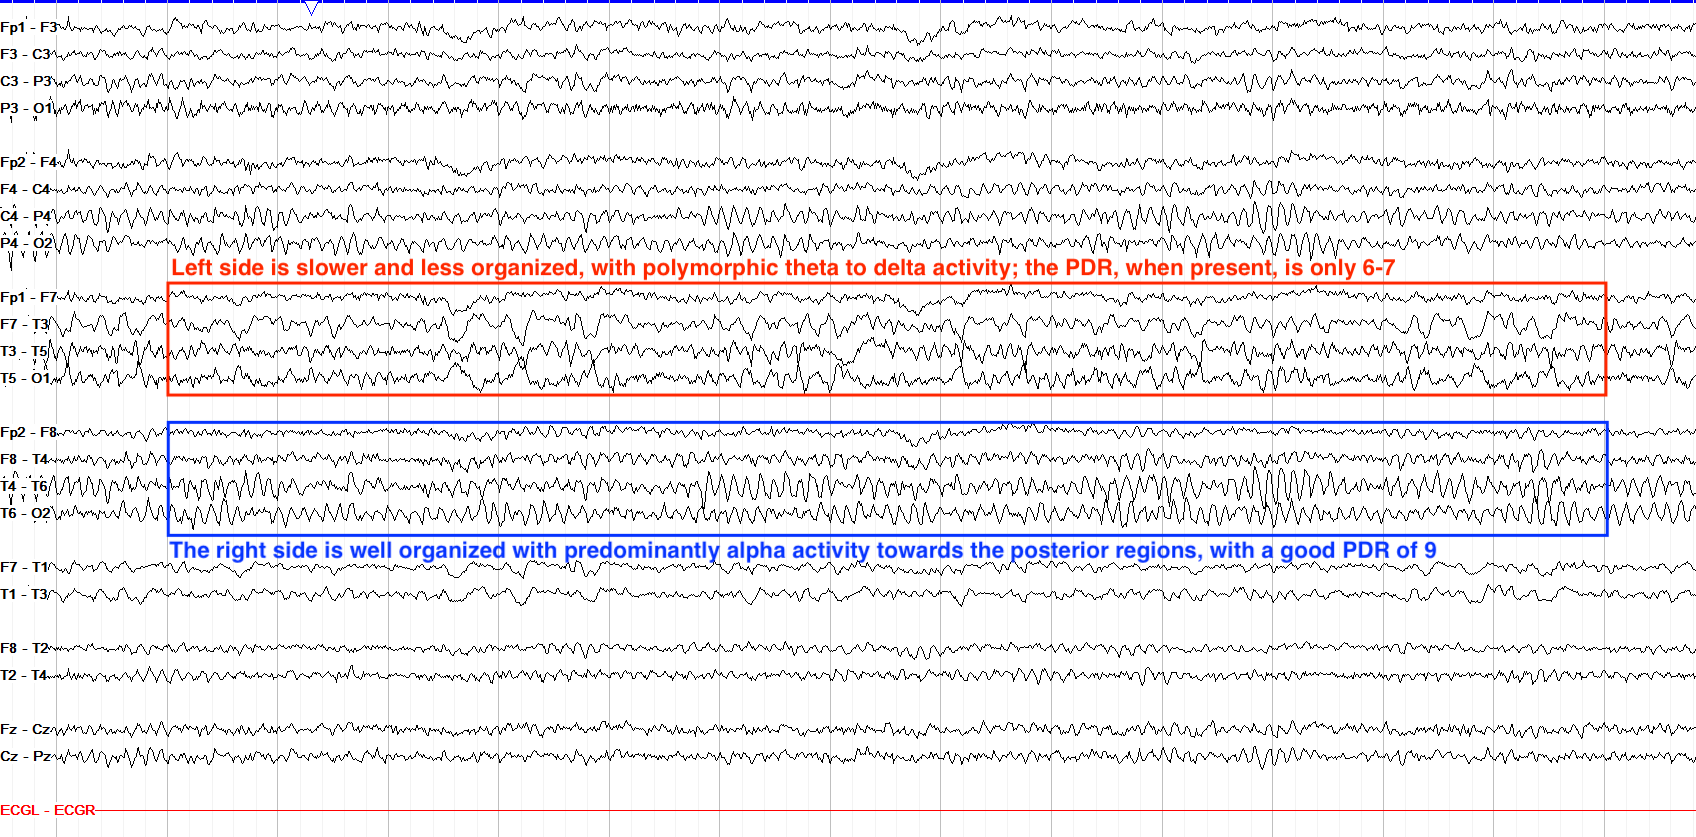
This tracing shows a persistent slowing over the left hemisphere. Note how the right side has predominantly alpha activity in the posterior regions—this is the posterior dominant rhythm, discussed in the Normal Awake section. On the left side, however, this alpha activity is absent, replaced by a “messier” and slower theta to delta activity that varies in appearance (including both frequency and amplitude), making it polymorphic.
- The resting membrane potential of neurons is -70mV.
- Action potentials arise through depolarization of neurons, which is promoted by EPSPs.
- EEG electrodes see the summation of many EPSPs or IPSPs over at least a 6cm square region of cortex.
- Superficial EPSPs in the cortex cause negative deflections; superficial IPSPs cause positive ones.
- On EEG, negative potentials cause upgoing waves and positive potentials cause downgoing waves.
- The dipole of a discharge affects how well perceived and accurate its location is on EEG.
- The four main frequencies of the human brain seen on scalp EEG, in increasing order, are delta, theta, alpha and beta, measured in Hertz (Hz).
- Amplitude is the height of a waveform, measured in microvolts (µV); the normal adult brain ranges from 10-100 µV.
- There is generally an inverse relationship between frequency and amplitude—slower waves tend to be higher amplitude.
- Individual waveform phases can be monophasic, biphasic, or polyphasic depending on how many times they cross the baseline.
- A series of waves is considered polymorphic when they vary in frequency and morphology, and monomorphic when they share the same frequency and morphology.
- Rhythmic and periodic patterns are both sets of at least six continuous cycles of monomorphic waveforms, but rhythmic discharges flow smoothly from one to the next while periodic discharges have gaps between one and the next.