EEG Signal Is Seen Via Montage
From the individual discharges detected by electrodes, EEGs give rise to a rich set of data across the entire span of the scalp. This is done via connecting all the electrodes in what is termed a montage, and there are two broad categories: bipolar and referential. Here we'll review the placement of each individual electrode, how to connect them into various montages, and how to get started reading EEG from a technical standpoint.
The 10-20 System
Now that you have a grasp of the pertinent neurophysiology underlying EEG signals, let's finally dive into the EEG itself. The first step in any EEG study is the placement of electrodes, and this is most commonly done via the international 10-20 System. This system is aptly named, as it uses distances between bony skull landmarks to define electrode positions at relative intervals of 10% or 20%. This proportional approach allows for consistent electrode placement across varying head shapes and sizes, making studies comparable person to person.
In the 10-20 system, each electrode is identified with a letter and a number. The letter corresponds to its region of the brain: F for frontal region, T for temporal, P for parietal, and O for occipital. The only exception to this is that F7 and F8, while seemingly frontal, are actually over the anterior temporal / frontotemporal region. The number corresponds to the hemisphere of the brain—odds on the left, evens on the right—and the particular area of each region. For the midline/central electrodes, their numbers are replaced with a 'z'.
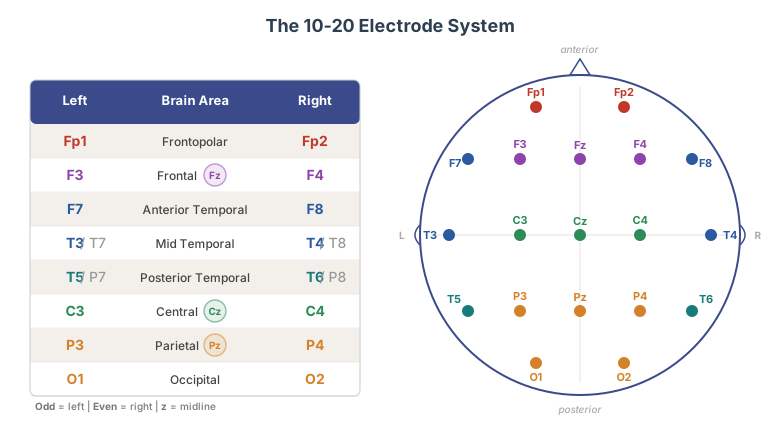
The first step in the 10-20 system setup is finding the nasion (the top of the nose bridge, between the eyes) and the inion (the small bump in the middle of the back of the head). From there, you divide the head into consecutive increments of 10% and 20% to find the placement of the electrodes.
Along with these standard electrodes, there are a few other ones you should know. First, the subtemporal electrodes T1 and T2 help to provide more information about the anterolateral temporal region. Second, you may see A1 and A2 electrodes; these are placed on the auricle of the ear for referential montages, which will be discussed below.
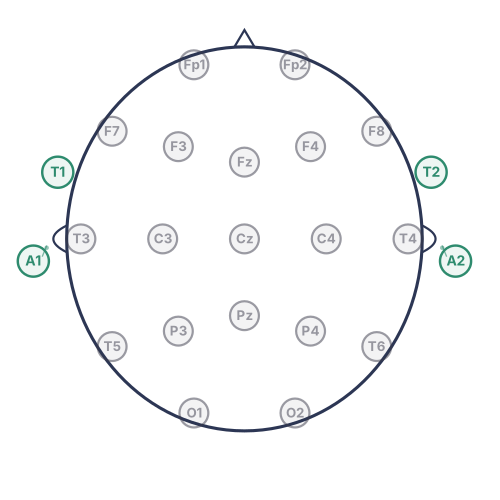
There is a newer system, the 10-10 system, that has far more electrodes because it uses distance intervals of only 10%, but most clinical centers still use the 10-20 system. All tracings on this site are collected via the 10-20 system, many with the T1 and T2 electrodes added on.
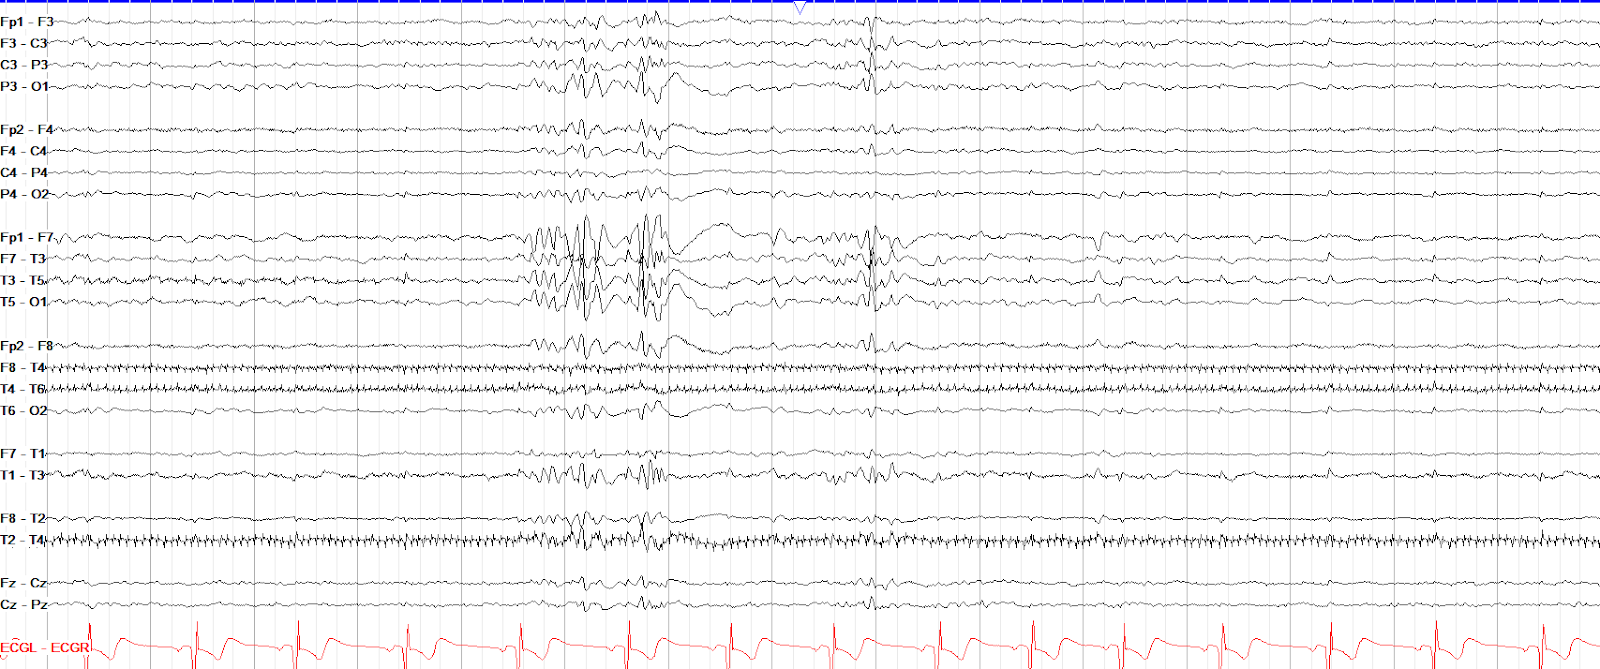
Recall that despite being 'F' electrodes, F7 and F8 actually overlie the left and right anterior temporal regions, respectively, though some data suggests they are slightly more broadly frontotemporal. T1 and T2 are left and right subtemporal, T3 and T4 are over the left and right mid-temporal regions, and T5 and T6 are over the left and right posterior temporal regions. Thus, the discharges in question most likely come from the left temporal lobe.
In documenting and interpreting scalp EEGs, some prefer to say "region" rather than "lobe," because to detect cerebral activity scalp EEG requires a relatively broad area--at least 6 square centimeters--of cortex to be involved. With such a broad area, you can't say for certain that the entirety of the discharges in question were from the temporal lobe itself and not, say, from an adjacent sulcus of the frontal or parietal lobes.
Bipolar Montages I: Setup
In a bipolar montage, each electrode's voltage is linked and compared to an adjacent one to form a chain of electrodes. There are multiple types, but the most common bipolar montage is the double banana, in which each electrode is linked and compared to the one behind it; so Fp2 is compared to F8, F8 is compared to T4, and so on all the way back. There are two chains per side in the double banana (from which it derives its name): an outside temporal chain involving Fp2 → F8 → T4 → T6 → O2, and then an inside parasagittal chain involving Fp2 → F4 → C4 → P4 → O2. The 'z' electrodes Fz → Cz → Pz form a small central chain.
In each chain, an electrode's voltage is compared to that of the electrode behind it, so each tracing line is a pair of electrodes in which the voltage of the second electrode is subtracted from the voltage of the first. Because of this, in bipolar if the first electrode in the tracing line is more positive/higher than the second, you get a positive, downward deflection; if the second electrode is more positive/higher, you get a negative, upward deflection. For example, if Fp2 has a voltage of -50 and F8 has a voltage of -20, the Fp2-F8 tracing would show -50 - (-20) = -30µV.
To better understand how bipolar montages lead to EEG tracings, let's take a look at the example below. There is a discharge of -50µV, but depending on its dipole and location, not every electrode will see a full -50µV. T4 is the closest and sees the majority of the voltage, and as you get farther away from the discharge the voltages seen by the electrodes diminish. Note this is similar but not identical to ripples in a pond, because the distribution of voltages is not as symmetric as ripples. To get the EEG tracings for this discharge all we have to do is link the electrodes in the double banana chain (the electrodes here are the temporal chain; for simplicity the parasagittal and central chains are not shown). Then we just subtract each electrode's voltage from the one in front of it to get the voltage for that tracing pair. Remember that in EEG, positive values cause downward waves and negative values cause upward waves.
This same technique is used to give rise to all the tracings in all the chains. Notice how in this example, T4 saw the greatest voltage of the nearby discharge, and the other electrode tracings seemed to "point toward" the T4 electrode on the tracing. That morphology is called a phase reversal, and is a key reason that bipolar montages are so popular.
With phase reversals, the middle electrode of the pair that makes the reversal is the electrode of maximal voltage (ex. T3-T5 and T5-O1 phase reversal means T5 has the greatest voltage of them all). Negative discharges cause the surrounding tracings to point toward the electrode of maximal voltage, while positive discharges cause surrounding tracings to point away from the electrode of max voltage (an easy way to remember this: positives can fit a plus sign, and negatives can only fit a negative sign). This isn't absolute, but negative phase reversals are often seen with epileptiform activity, while positive ones are more commonly seen with various artifacts.
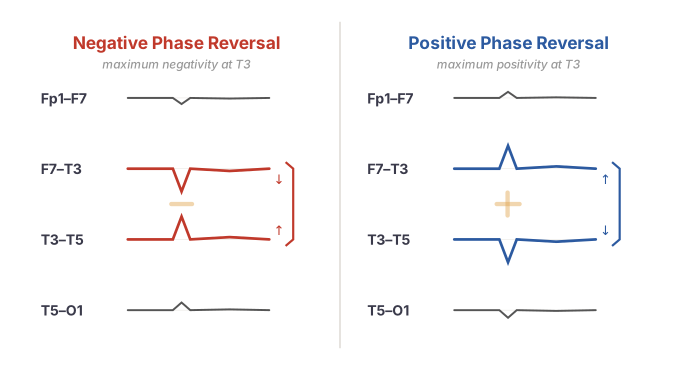
It's important to clarify that the word "positive" means different things for a deflection versus a phase reversal. A single deflection's polarity is straightforward by convention: down is positive, up is negative. A phase reversal's polarity, however, names where the maximal charge sits among channels rather than referring to a single channel in isolation. So the same pair of electrodes, each carrying its own charge, can give rise to different types of phase reversals depending on how they are arranged. A positive phase reversal is made of a negative upward deflection and a positive downward deflection that point away from one another; a negative phase reversal is made of one positive downward deflection and one negative upward deflection that point toward one another. So calling a phase reversal "positive" or "negative" describes the electrode of maximal charge of either polarity, not the deflections that compose it.
This distinction becomes especially important for the first and last electrodes in each chain, due to something called the end of chain phenomenon. Recall that bipolar montages require two electrodes to be compared to one another. However, for the first electrode in each chain (Fp1 and Fp2) there is not an electrode in front to compare it to, and for the last electrodes (O1 and O2) there isn't one behind them to compare to. Because they're at the end of their chains you only see half of any possible phase reversals at these electrodes. In the example below, a negative discharge anterior to Fp1 would usually cause a negative phase reversal at Fp1, but because it's at the end of the chain, there isn't an electrode in front of it to complete the phase reversal.
When you come up against the end of chain phenomenon, remember that the double banana isn't the only bipolar montage available to you. Next we'll discuss some other types of bipolar montages to help you get around this issue.
This is a tricky question; generally speaking, upward waves on EEG are negative and downward waves on EEG are positive, so the marked downward wave is a positive deflection. However, with discharges on bipolar montages a phase reversal is formed, which takes into account both electrodes involved. The occipital electrodes are hindered by the end of chain effect, so we only see half of occipital phase reversals.
Because in bipolar montages each tracing line subtracts the voltage of the second electrode from the first, for P3-O1 and T5-O1 to have a downward (positive) wave then P3 and T5 would need to be more positive than O1, making O1 relatively negative. If we saw the full phase reversal of this discharge, say on a circumferential montage, it would be a negative phase reversal pointing to O1.
Bipolar Montages II: Types
The most commonly used bipolar montage, as discussed above, is the double banana, marked by the bilateral temporal chains over the bilateral parasagittal chains, and a central chain below that. In some modern variations, the subtemporal leads are also included as their own chain. As mentioned, though, the double banana suffers from the end of chain phenomenon.
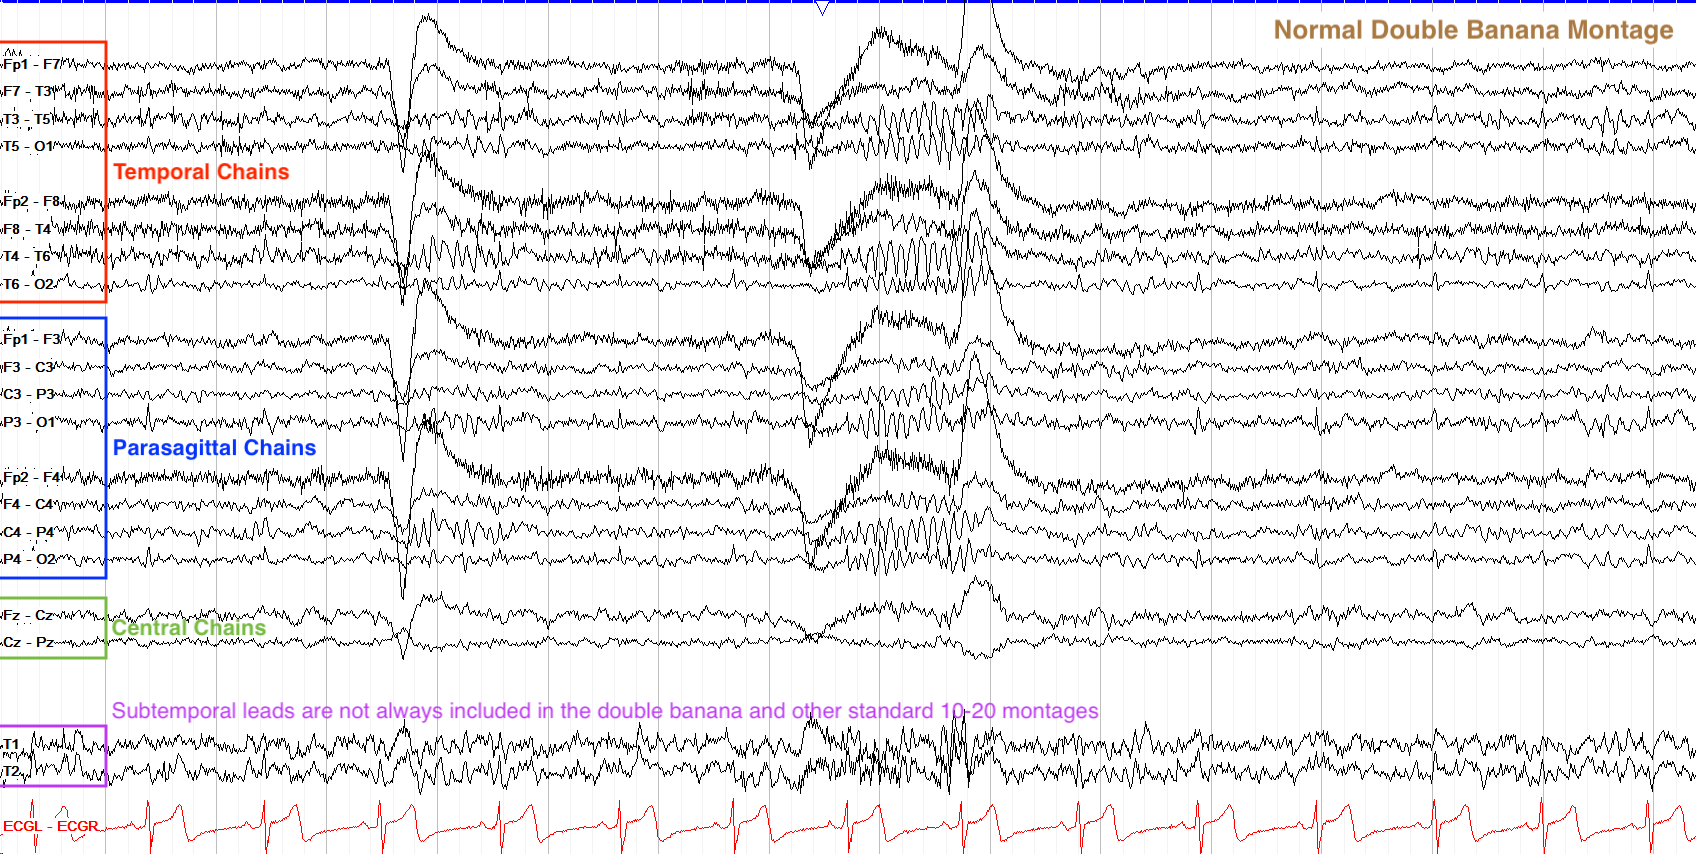
A normal EEG displayed in the double banana montage. Temporal chains sit above the parasagittal chains, with a central chain below.
When you come up against the end of chain phenomenon, remember that the double banana isn't the only bipolar montage available to you. In particular, the end of chain issue can be worked around by using a bipolar circumferential montage, in which the electrodes are linked not in an anterior to posterior chain but in a circle around the head.
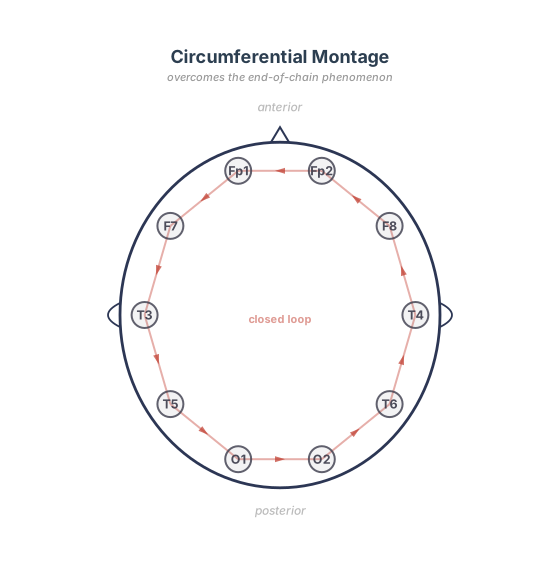
With circumferential montages, all the electrodes in the chain have a point of comparison; the chain itself, however, does not include much of the middle regions / parasagittal electrodes, so circumferential should not be used to screen tracings but only to clarify particular discharges. This tracing clip is the same timespan as the double banana clip above; note how different they appear based on the arrangement of the electrodes' connections.
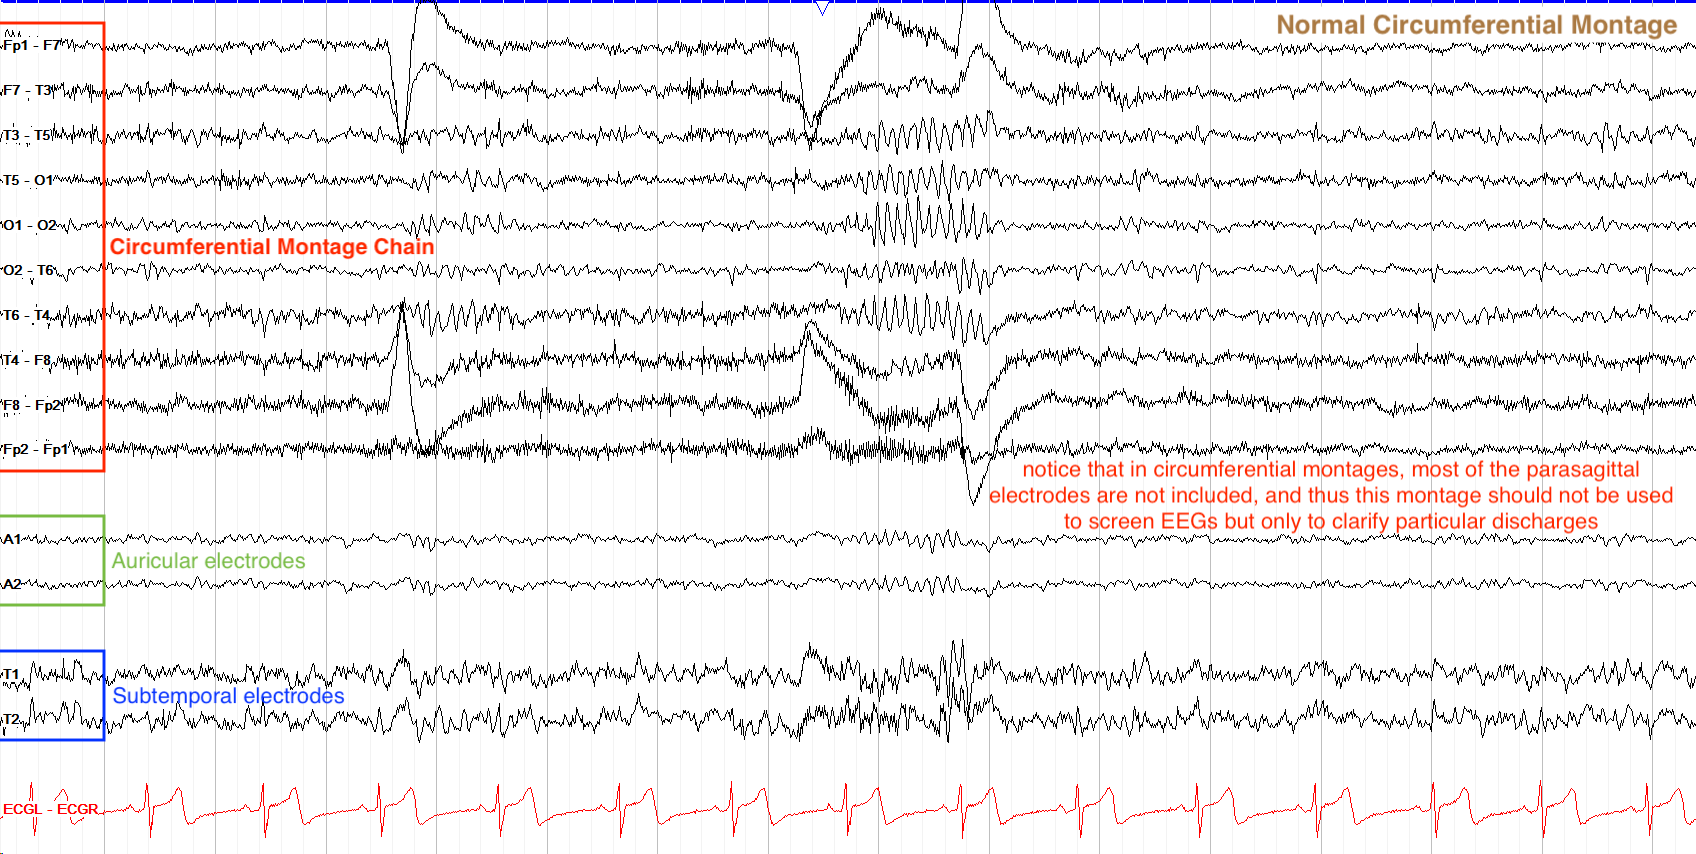
The same normal EEG clip, now displayed in a circumferential montage. Note how the tracing appears different despite being the same underlying data.
Aside from the double banana and circumferential montages, there are multiple other bipolar types. Many of the tracings on this site use the bipolar T1-T2 montage, which is quite similar to the double banana but places the parasagittal chains on top, and includes the subtemporal T1 and T2 electrodes. It, too, suffers from an end of chain issue.
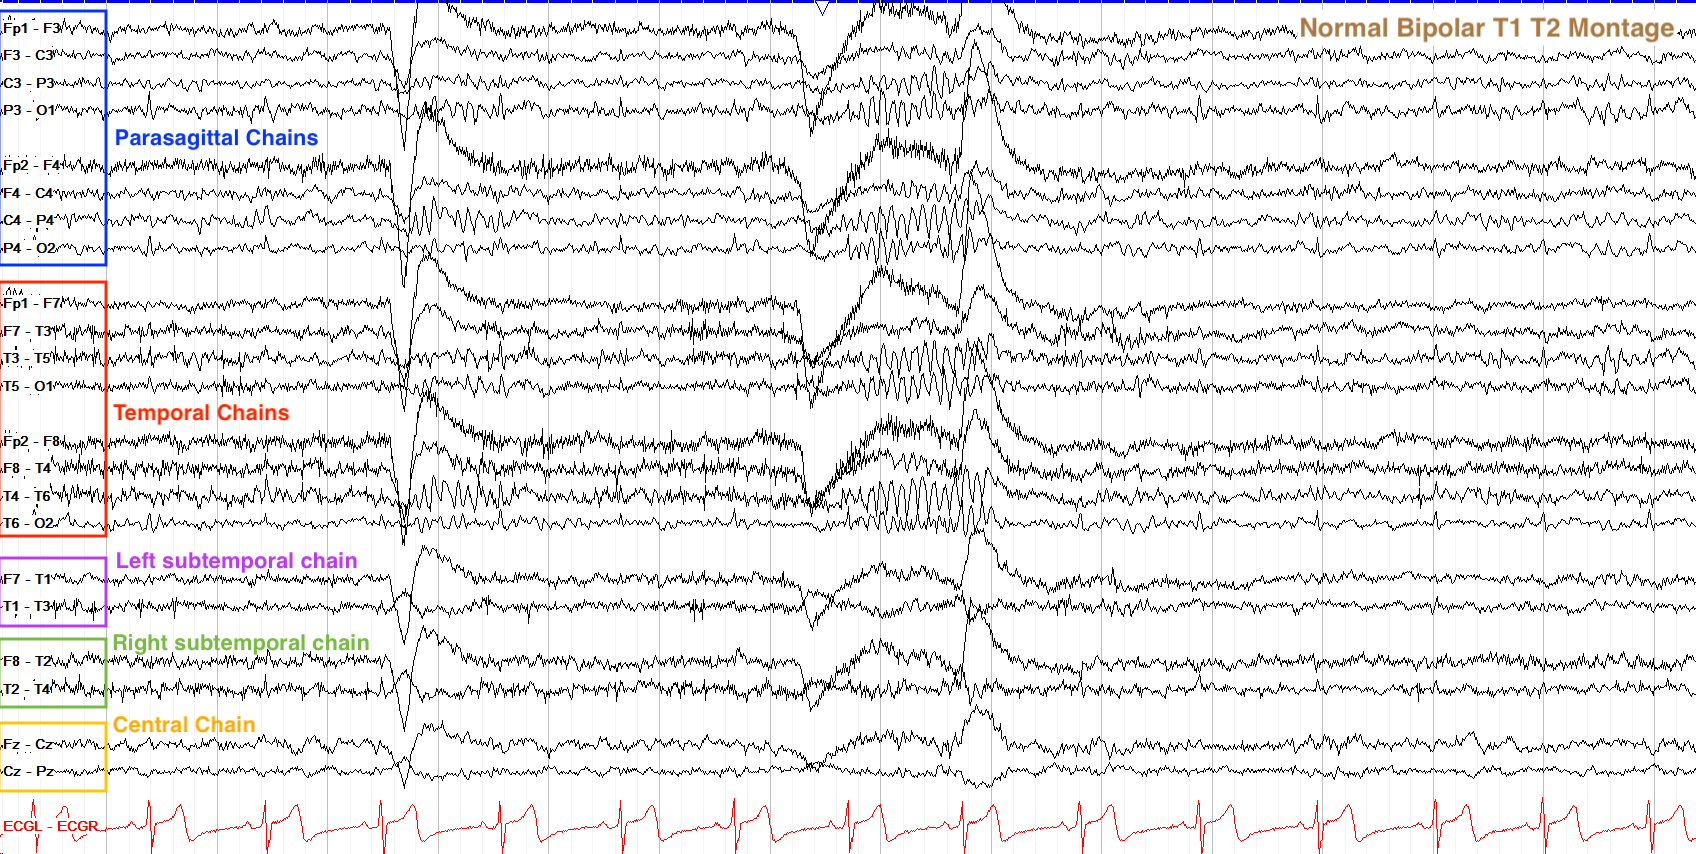
The T1-T2 bipolar montage. Similar to the double banana, but with parasagittal chains on top and the addition of subtemporal T1 and T2 electrodes.
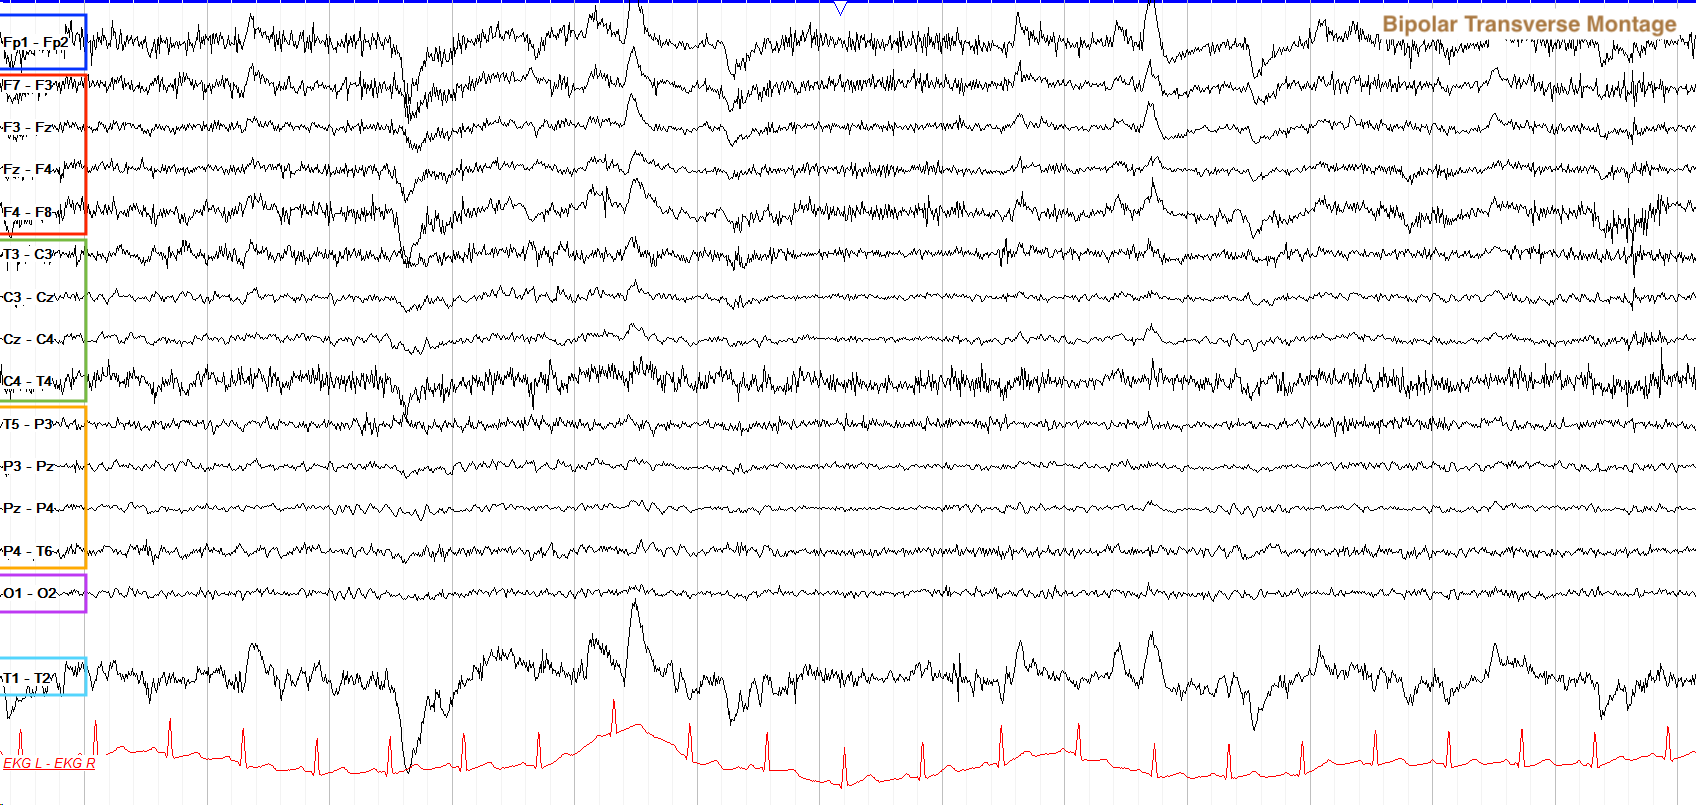
You can also use a transverse montage, which makes chains not front to back but rather side to side, and can help to lateralize activity if the dominant hemisphere for a discharge is unclear on double banana.
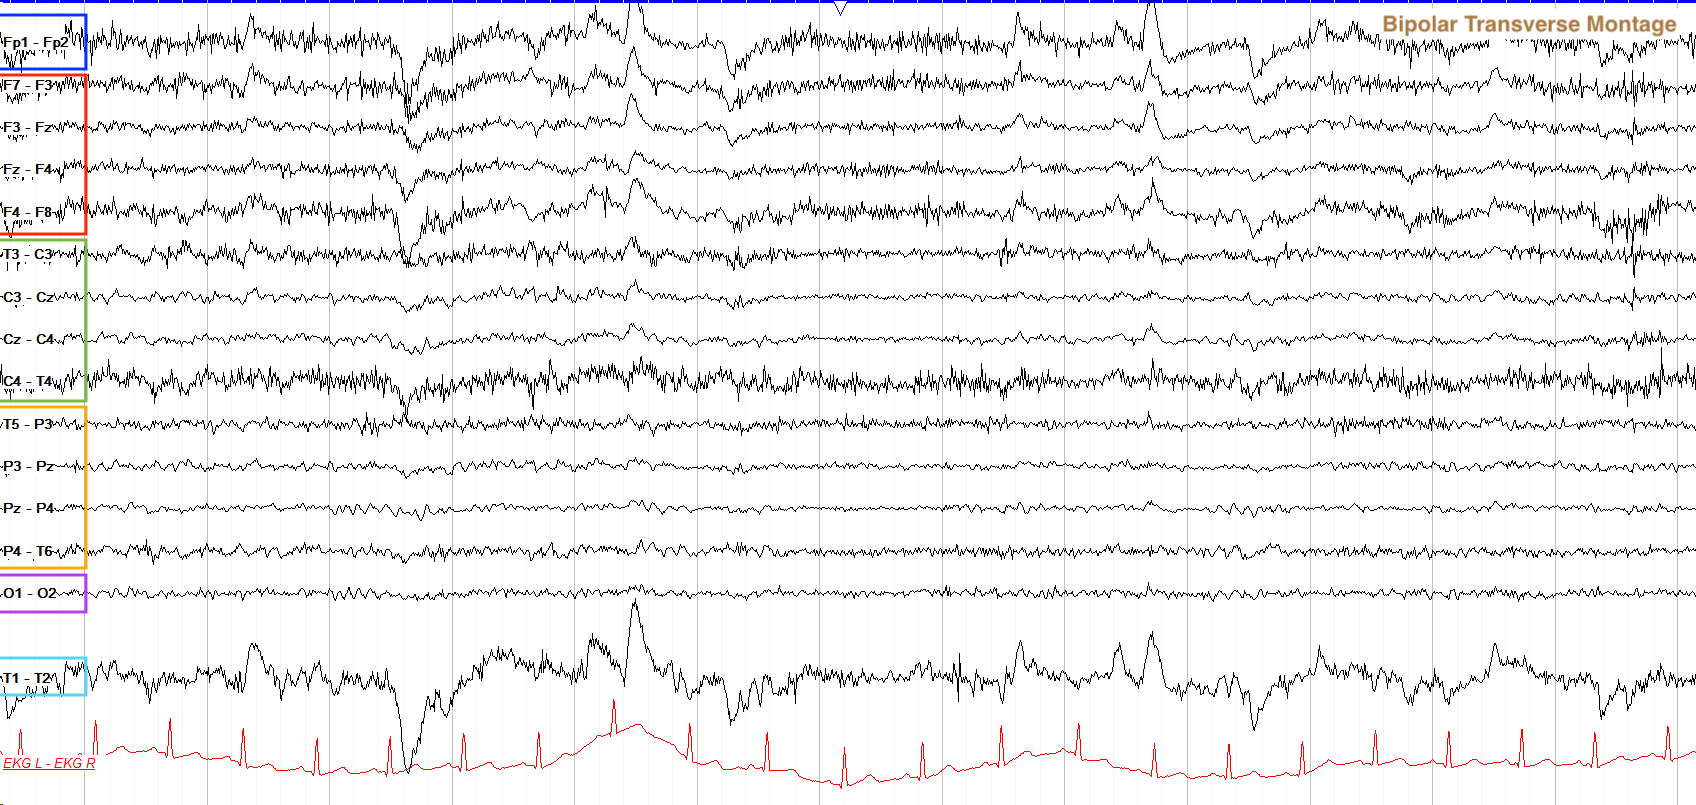
A transverse montage arranges electrode chains from left to right rather than anterior to posterior, which can help lateralize ambiguous activity.
Clearly, the bipolar montage type is a powerful and highly useful tool for reading EEGs, and is the most commonly used montage for screening because phase reversals stand out so clearly. However, bipolar montages can come with caveats and require a good understanding of the basic electrophysiology in order to fully understand what you're seeing. The good news is that thanks to digital EEG nowadays, you aren't limited to a single montage—modern EEG software allows you to change montages quickly and easily as you read.
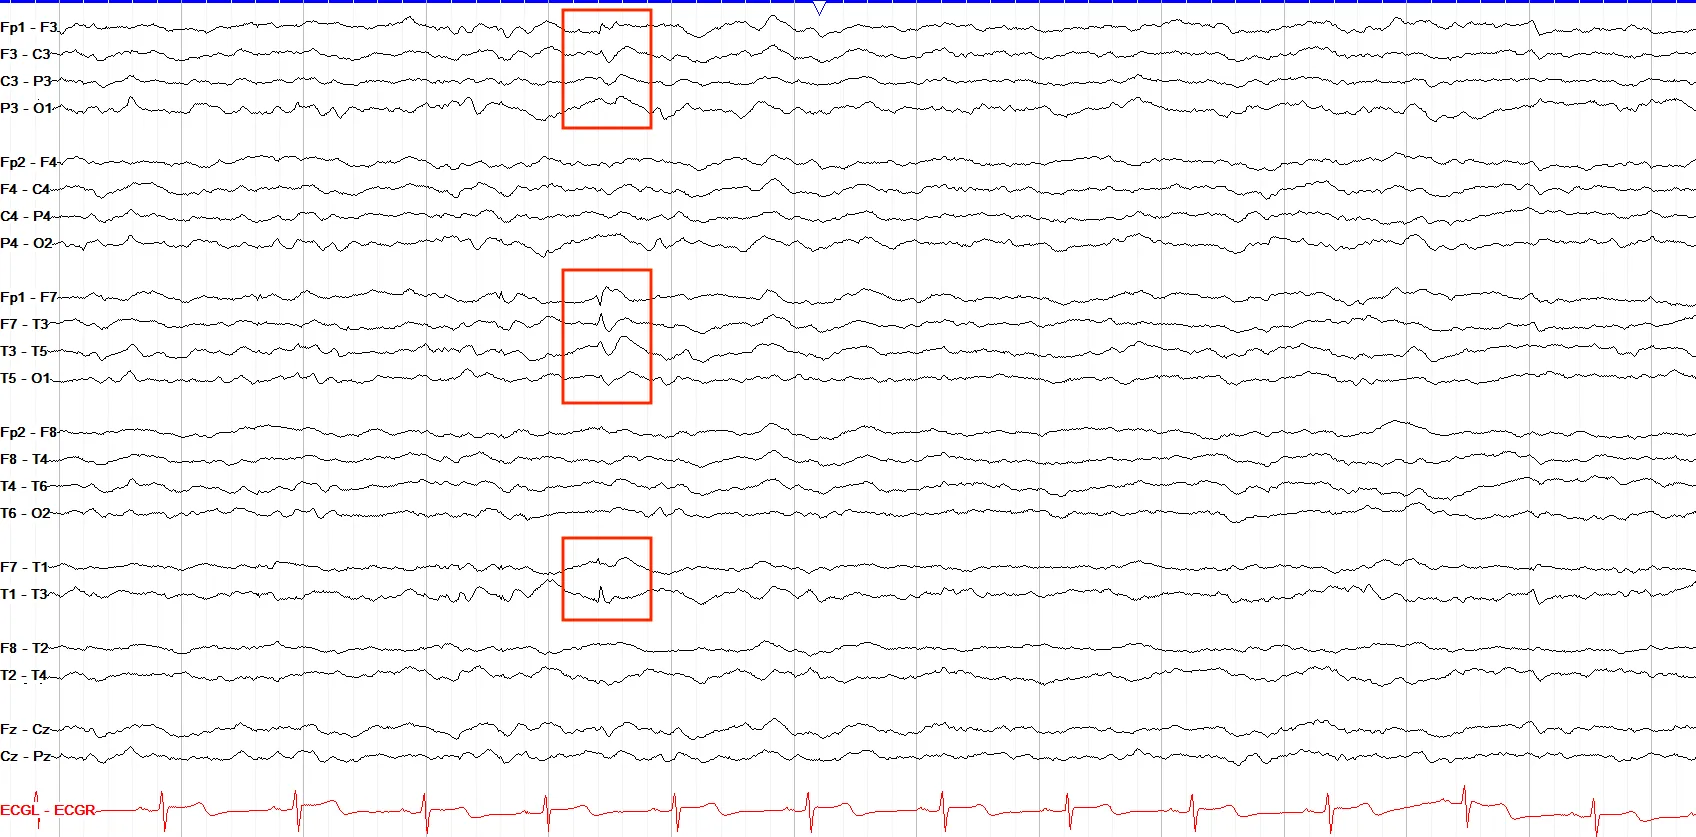
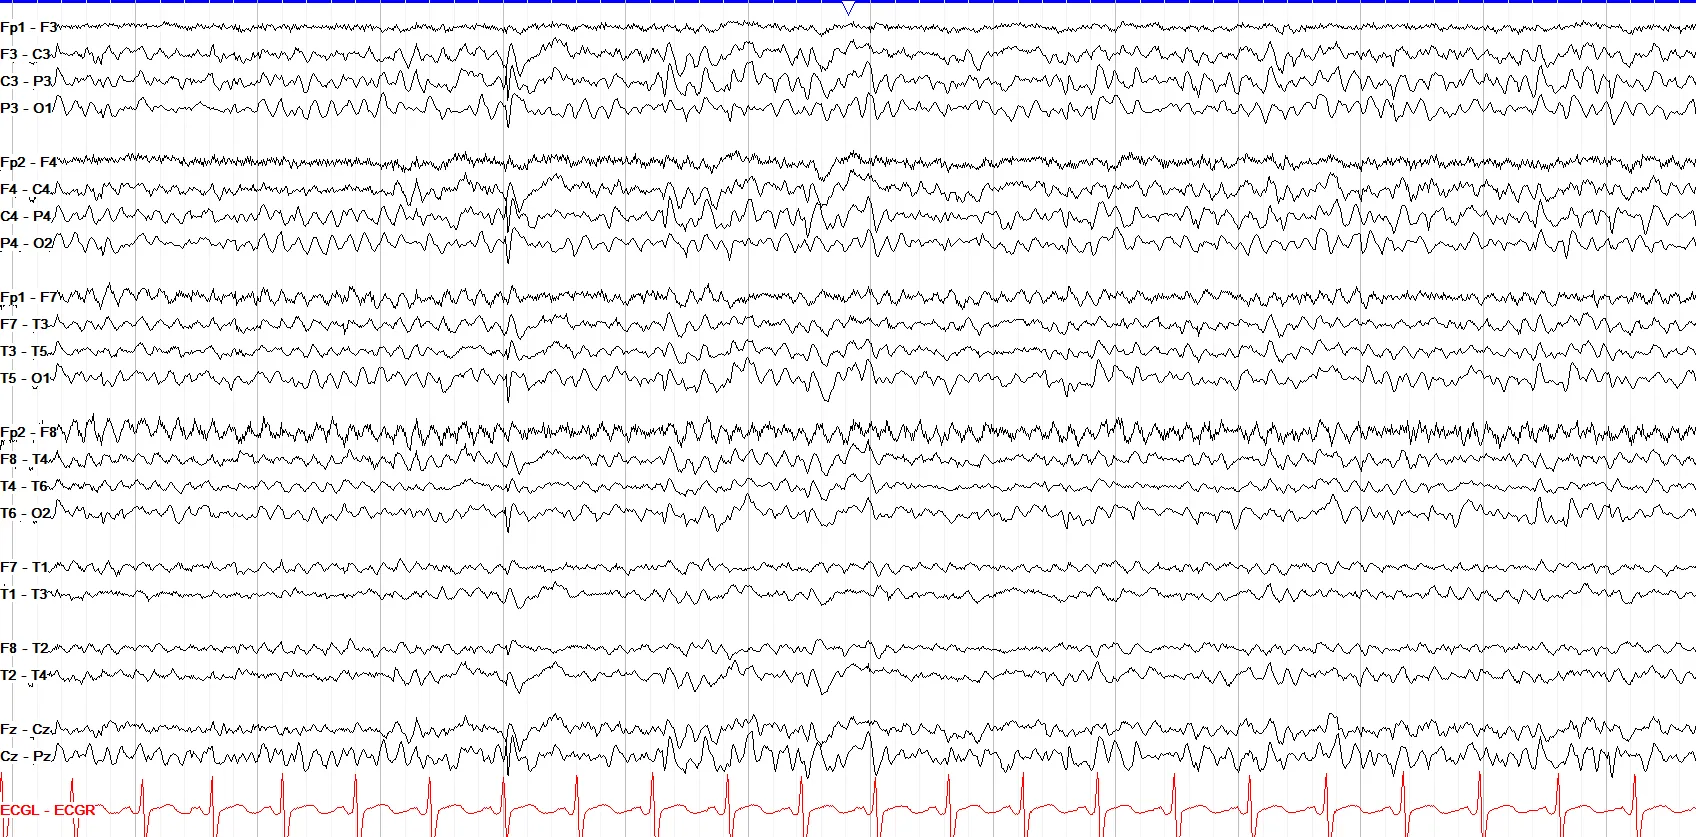
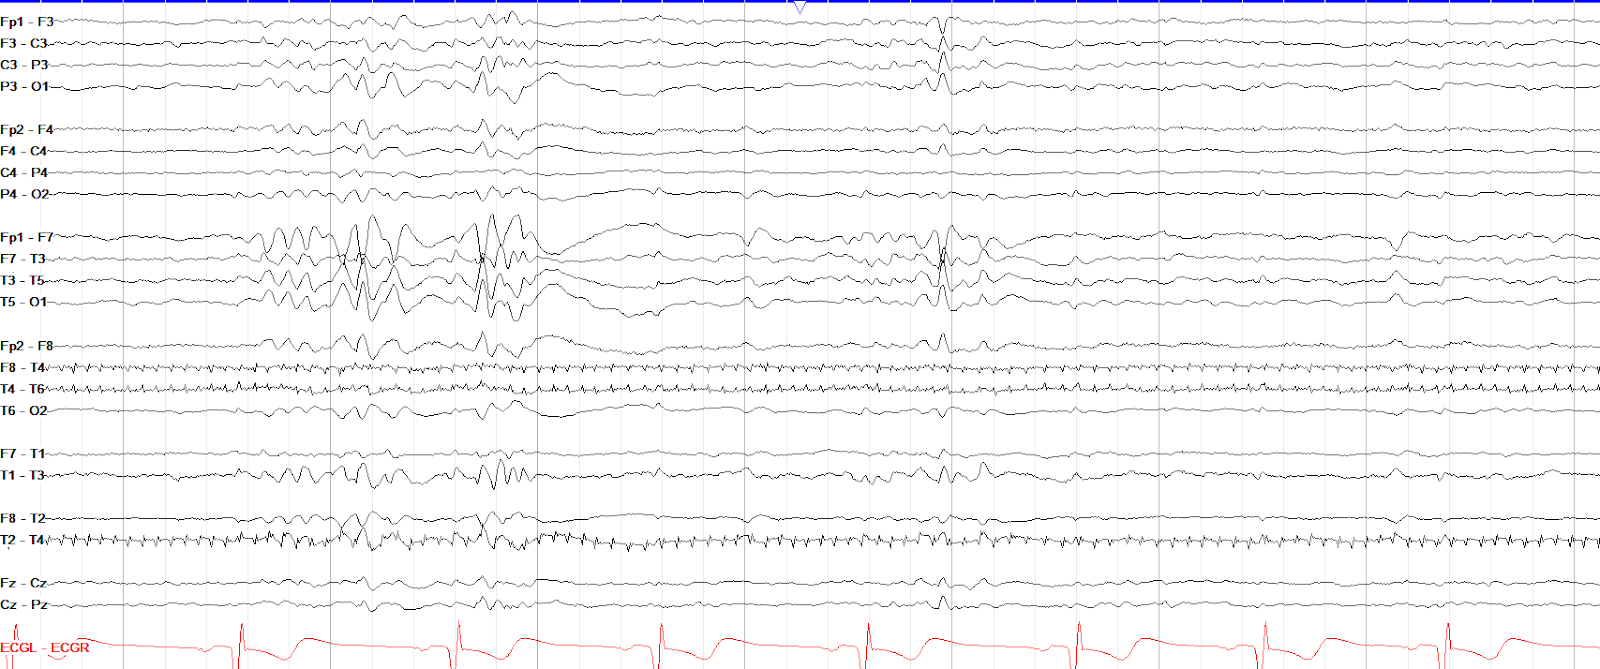
This tracing shows pairs of electrodes in chains going from anterior to posterior, with the parasagittal chains on top of the temporal chains; the subtemporal and central chains are also present. So, this is a bipolar T1-T2 montage (if the temporal chain was on top of the parasagittal, it would be a double banana).
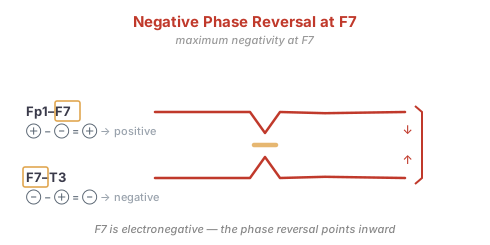
Regarding the discharge, we clearly see a phase reversal between Fp1-F7 and F7-T3, meaning that F7, the middle electrode of this set of pairs, has the maximal voltage of this discharge. There is also a field farther out (field being the presence of a disruption of the background that mimics the maximal point of phase reversal, but "tapers" off as you get farther away from the point of maximal voltage). The phase reversal points inward, so we know it is a negative phase reversal.
We can reverse the calculations described above to figure out the polarity of the electrodes involved. If the Fp1-F7 tracing is made by subtracting F7 from Fp1, and the discharge on that tracing goes down, then we know that tracing is positive and thus Fp1 was more positive than F7. Meanwhile, in the next tracing we subtract T3 from F7, and that tracing has an upward wave, meaning it's negative. So, we know that F7 was more negative than T3. So, F7 is electronegative.
Referential Montages
While bipolar montages are typically best for screening EEG studies, referential montages can be particularly useful to clarify the point of maximal electronegativity if it remains unclear on a bipolar view. Bipolar montages compare one electrode's voltage to another, but referential ones compare all of the electrodes to a single reference point. This reference point can be any number of things, but is commonly the average voltage of all electrodes (termed an average montage), or the electrically much quieter auricle of the ear. The referential montages used across this site are mostly the average type.
While bipolar montages have a fair deal of complexity regarding positivity, negativity and phase reversals, referential montages keep it simpler: every wave that goes up is negative, and every wave that goes down is positive. There are no phase reversals, and as such, the highest amplitude waveform is the one with the greatest voltage, be it downward or upward. This can make it easier to find the point of maximal voltage in a tracing, but it also makes it harder to see epileptiform discharges when screening because you don't have a phase reversal to stand out from the background.
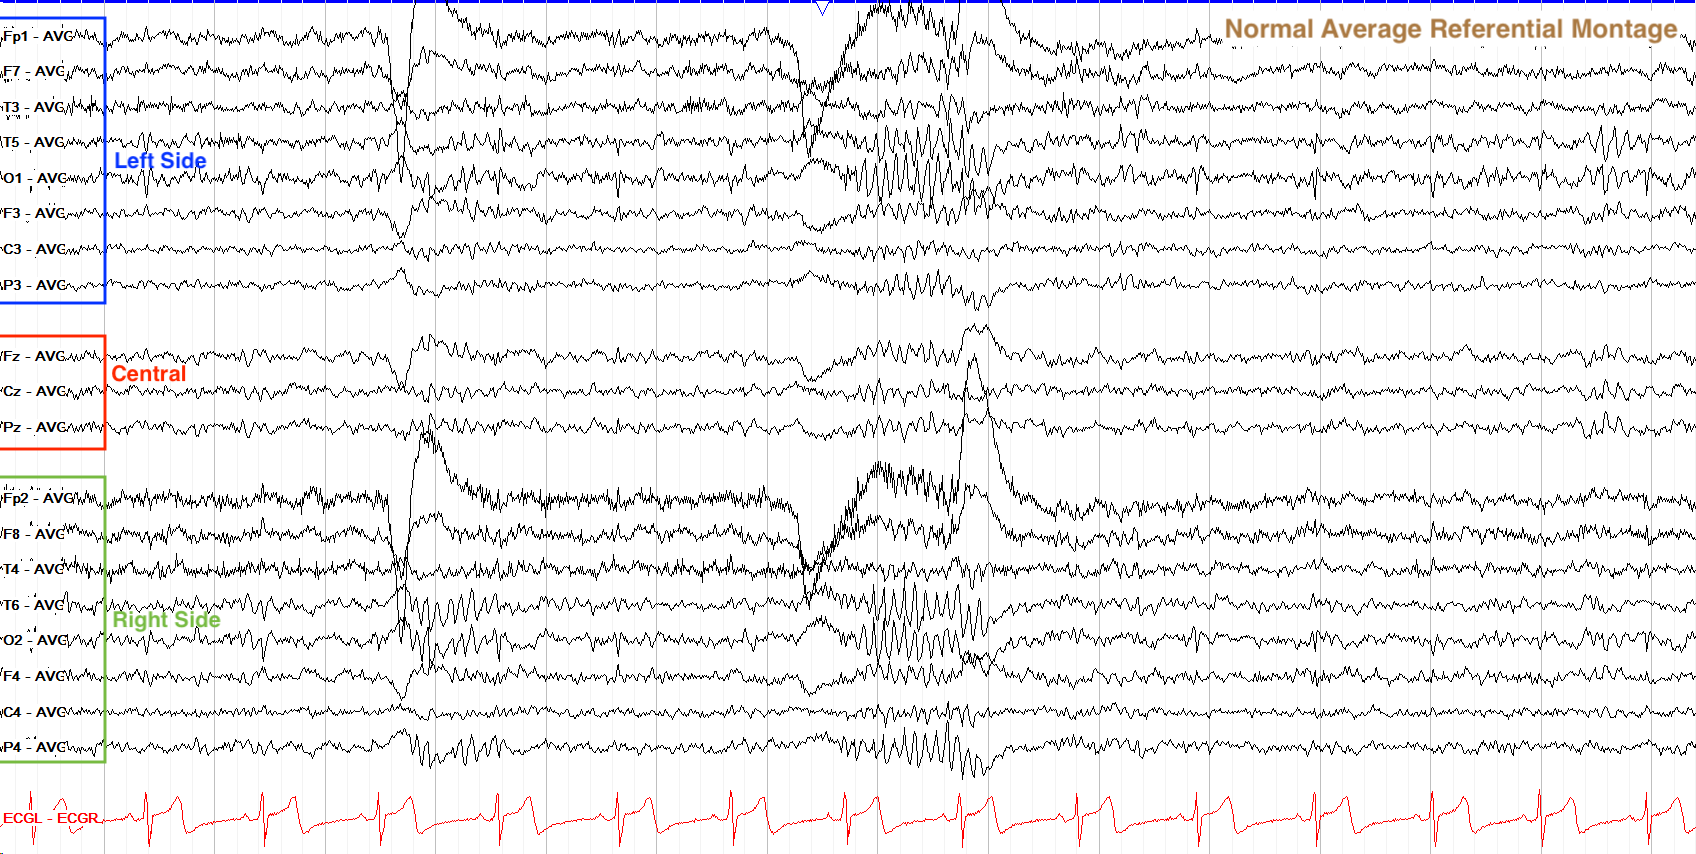
A normal EEG displayed in a referential average montage. Every electrode is compared to the same reference point, so there are no phase reversals.
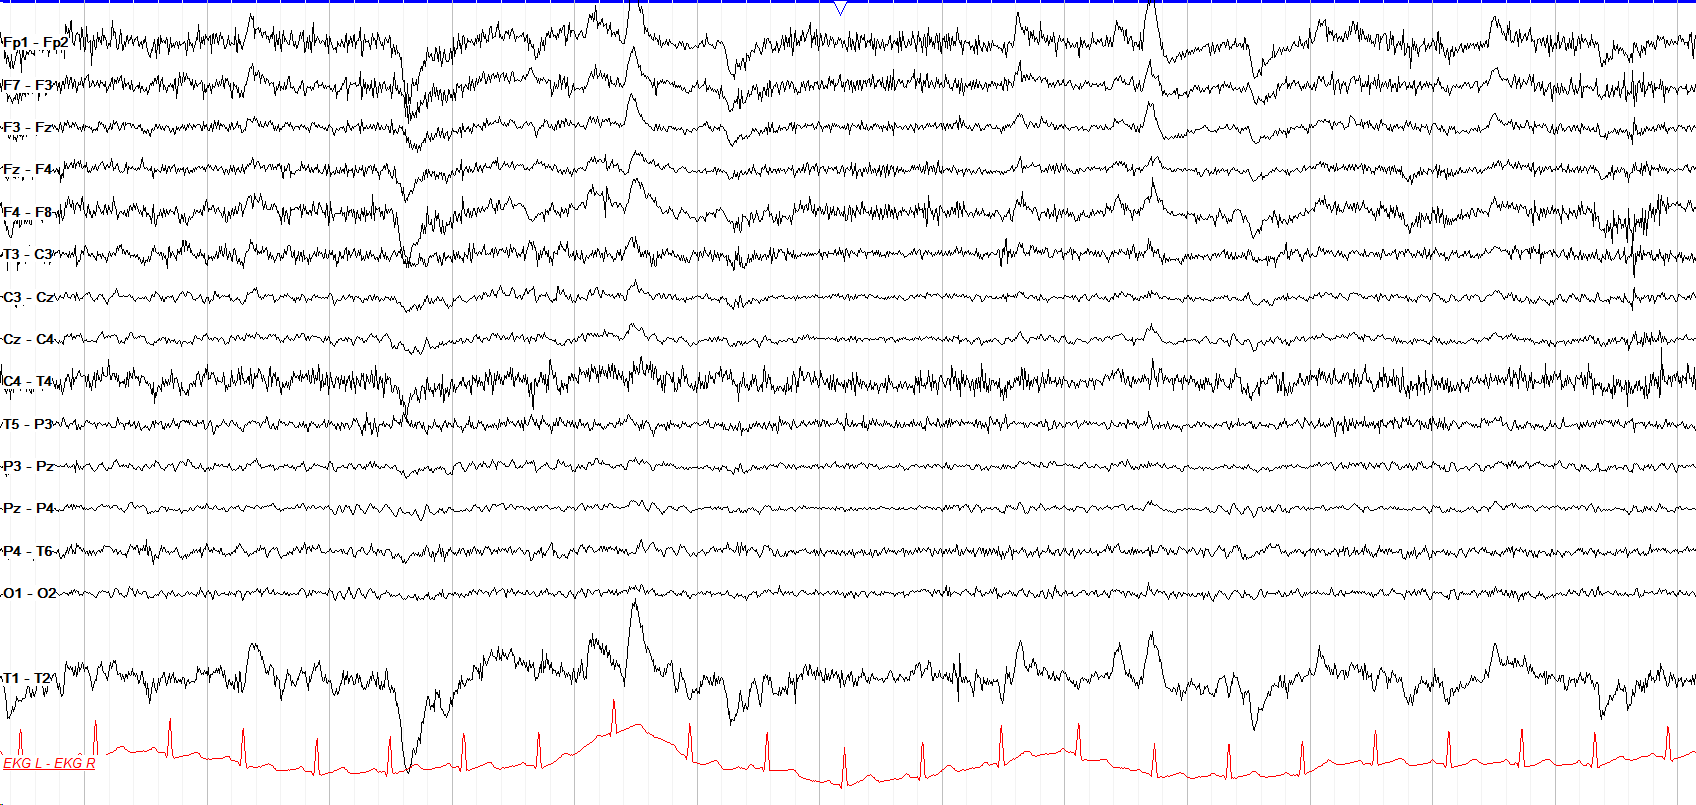
You haven't seen this type before, but it was mentioned above. Because each tracing line is a pair of electrodes, you know this is a bipolar montage. Next, you see that the pairings are going from left to right across the scalp in chains. So, this is a bipolar transverse montage. You won't see this type often but they can be helpful for characterizing discharges if more typical bipolar or referential montages remain unclear.
Page Speed
The formation of the tracing lines is only part of an EEG study. The next part is choosing your reading speed. This determines how many seconds of the study are displayed across your screen at a time. The standard adult reading speed is 30mm/sec and the standard neonatal speed is 15mm/sec. The higher your reading speed the fewer seconds are displayed on your screen at a time, and the more "stretched out" the waves appear.
This relationship arises because EEG tracings used to be recorded by ink nibs fluctuating on a continuously scrolling ream of paper. No matter how fast the paper went by, the ink nibs oscillated at the same speed as they recorded the electrophysiologic signal. The paper speed was measured in mm/sec, and so the more millimeters the paper moved per second, the more drawn out each second of tracing was. So, a reading speed of 60mm/sec would move the paper 60mm in one second, while a speed of 15mm/sec would move the paper only 15mm in one second, but in both cases the waveforms were drawn at the same rate and thus the higher reading speed would make the waves appear stretched out while the lower speed would make them appear more condensed.
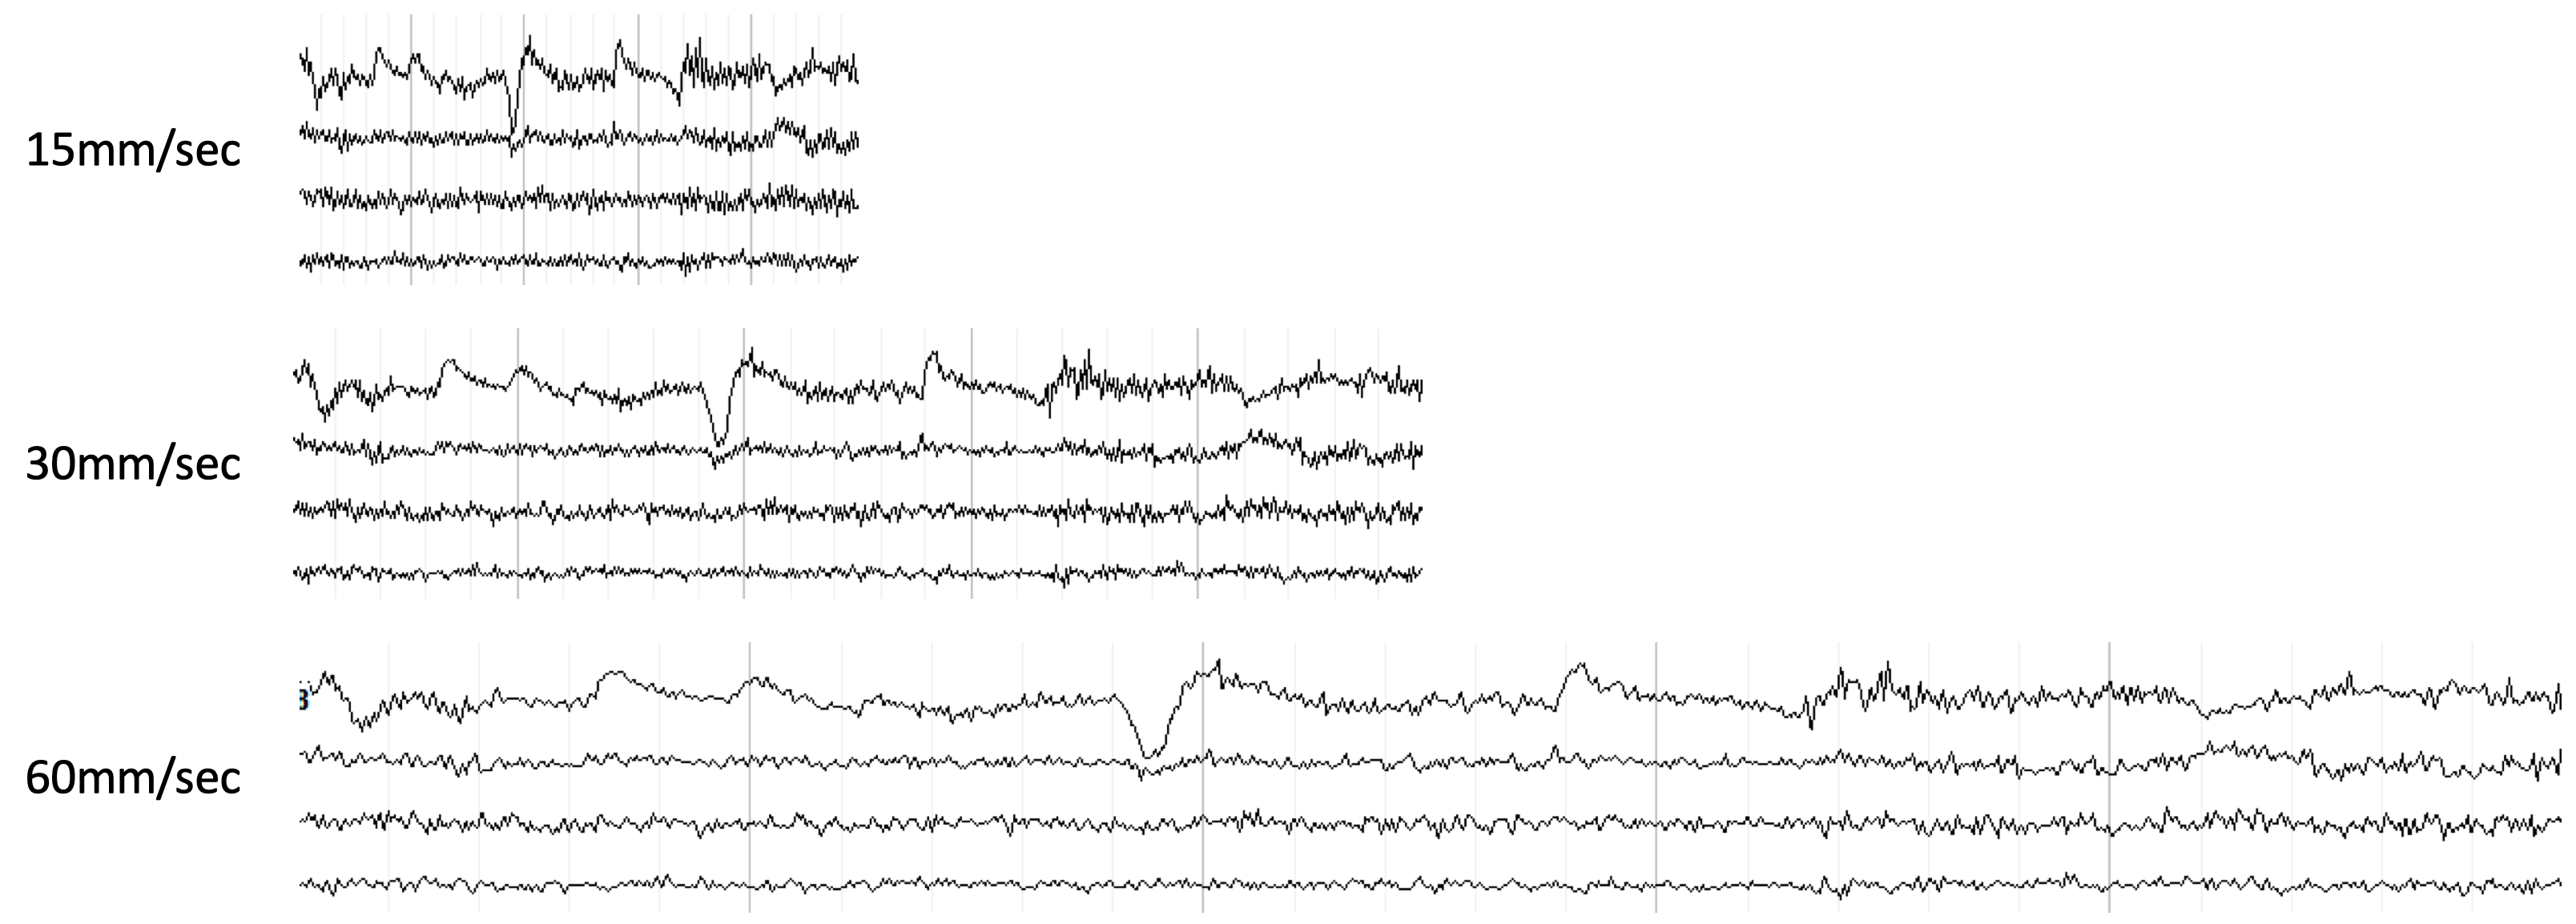
In the example above, we're looking at the same five seconds of data, but notice how the waveforms appear sharper and condensed at the 15mm/sec, to the point that some may even be misinterpreted as epileptiform spikes, while at the 60mm/sec speed everything becomes so drawn out as to almost lose its morphology. The 30mm/sec speed, like an electrophysiologic Goldilocks, is the standard reading speed right in the middle.
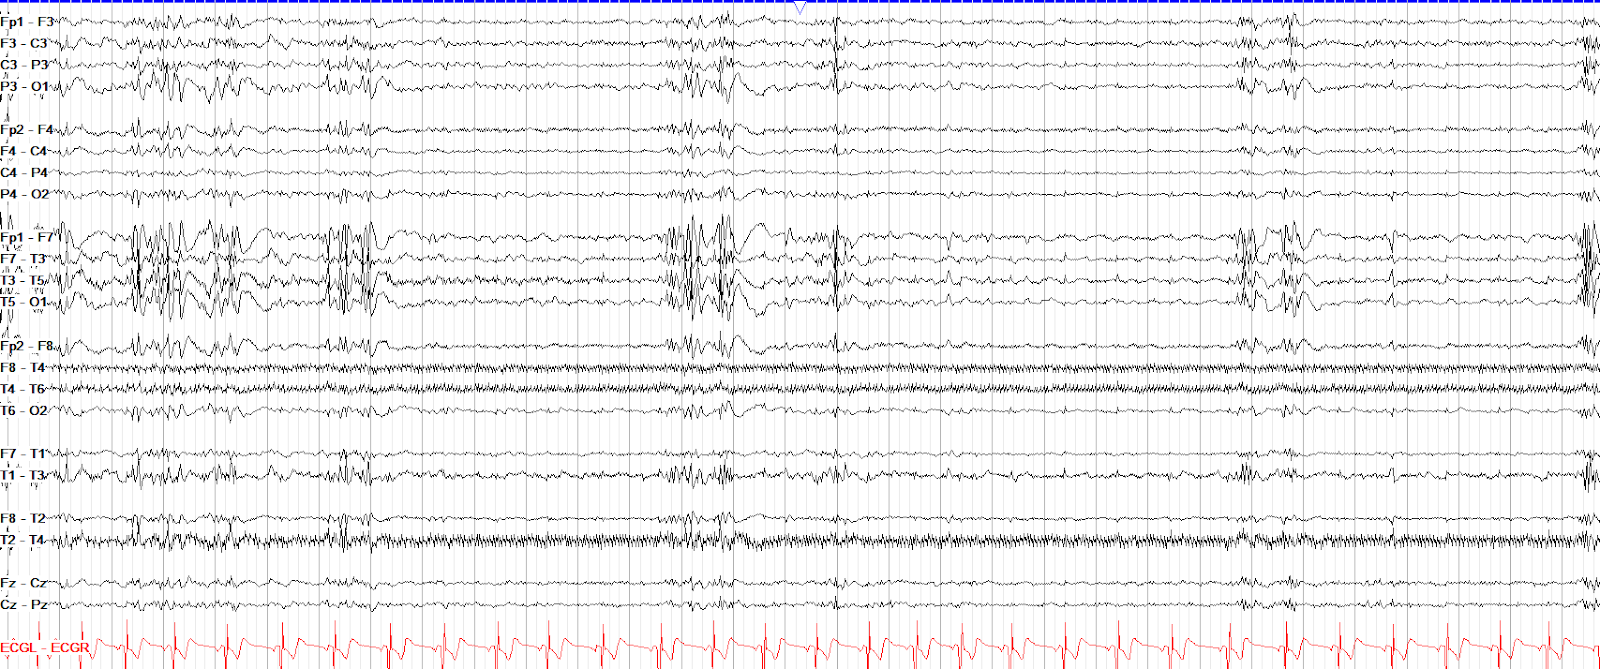
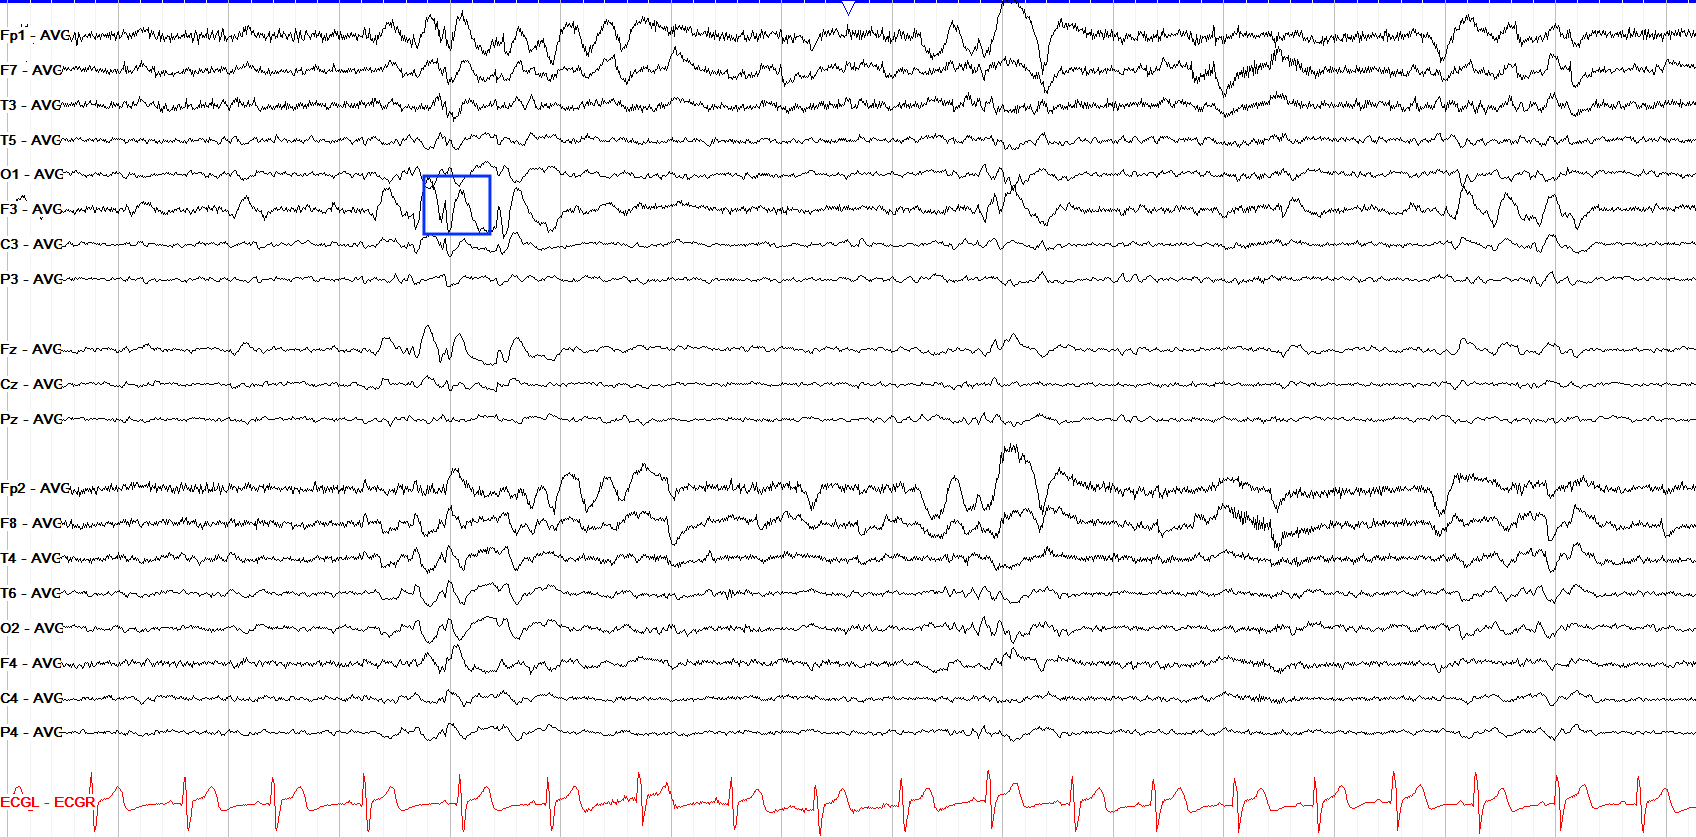
This is a referential average montage, and thus each electrode's voltage is compared to the average of the voltage across all electrodes. Recall that referential montages do not give phase reversals—what you see is what you get. So, this upward going spike and wave at F3 is a negative F3 maximal discharge. Note the smaller but similar looking waveforms in C3 and Fz; this is the discharge's field.
Filters
Filters are another foundational concept in EEG. Every tracing you read has been filtered, in that the waveforms on screen are a processed rather than pure representation of the underlying electrical activity. Filters can improve readability by attenuating distracting or irrelevant frequencies at the extremes of the spectrum, but pertinent cerebral activity can be diminished or distorted in the process. Thus, understanding how chosen filter settings affect your tracings is essential to accurate reading. There are three main filter types: low frequency (high pass), high frequency (low pass), and notch.
Low frequency filters (LFF) filter out frequencies below a certain threshold; they are also called high pass filters because they allow higher frequencies to pass through. The standard LFF is 0.5-1 Hz, as most activity below that level is artifact and can make the EEG very hard to read. Choosing a LFF that is too low will allow a lot of unwanted low frequency sweat and other artifact through, while choosing one that is too high may hide important delta activity.
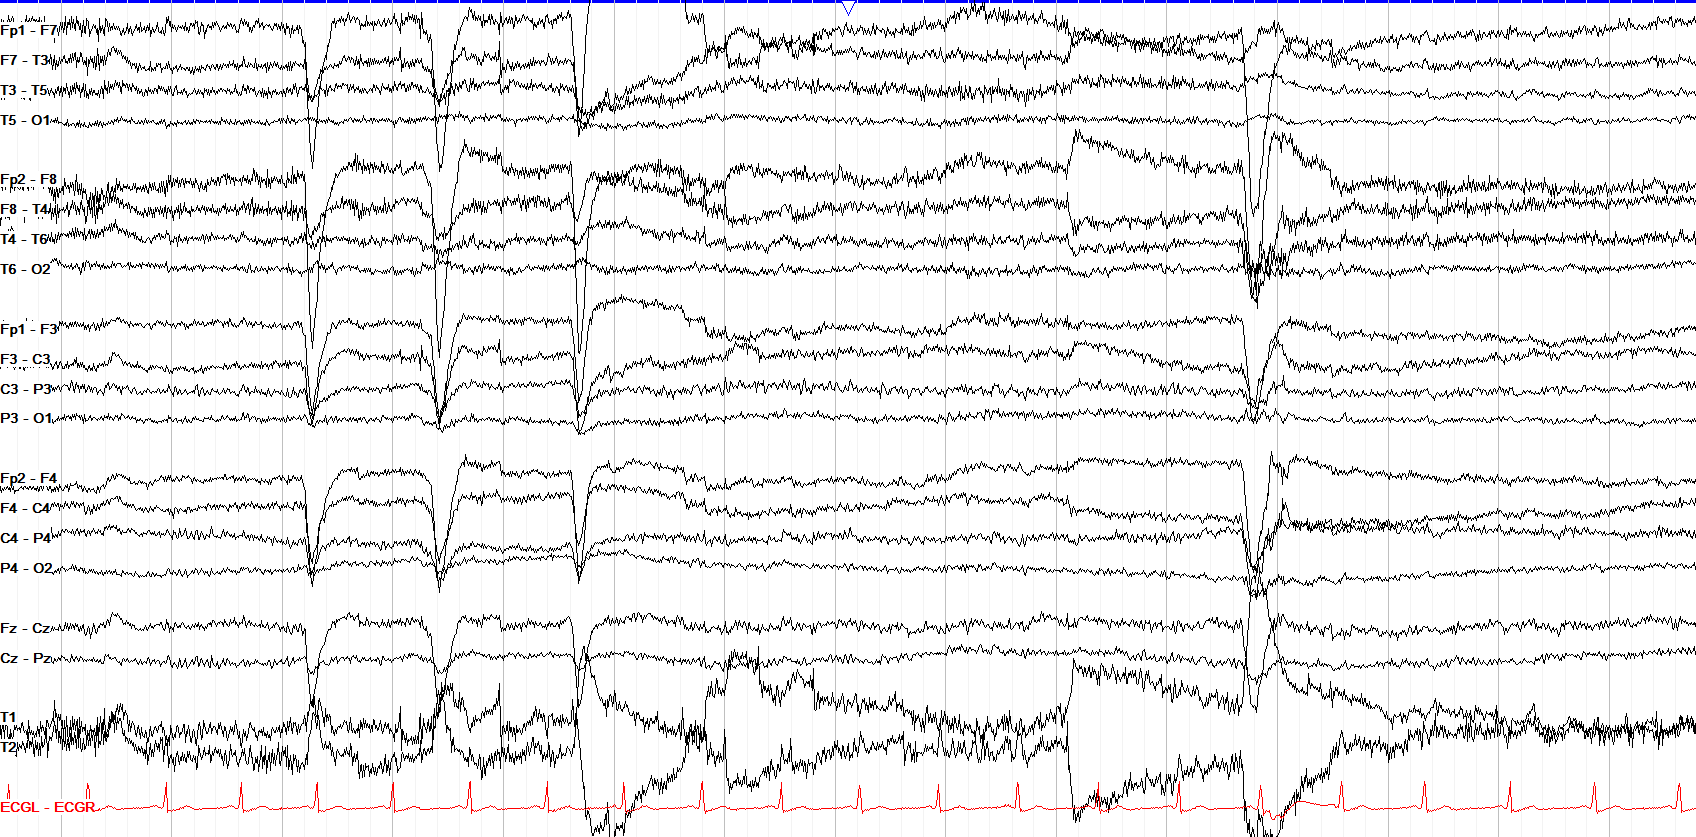
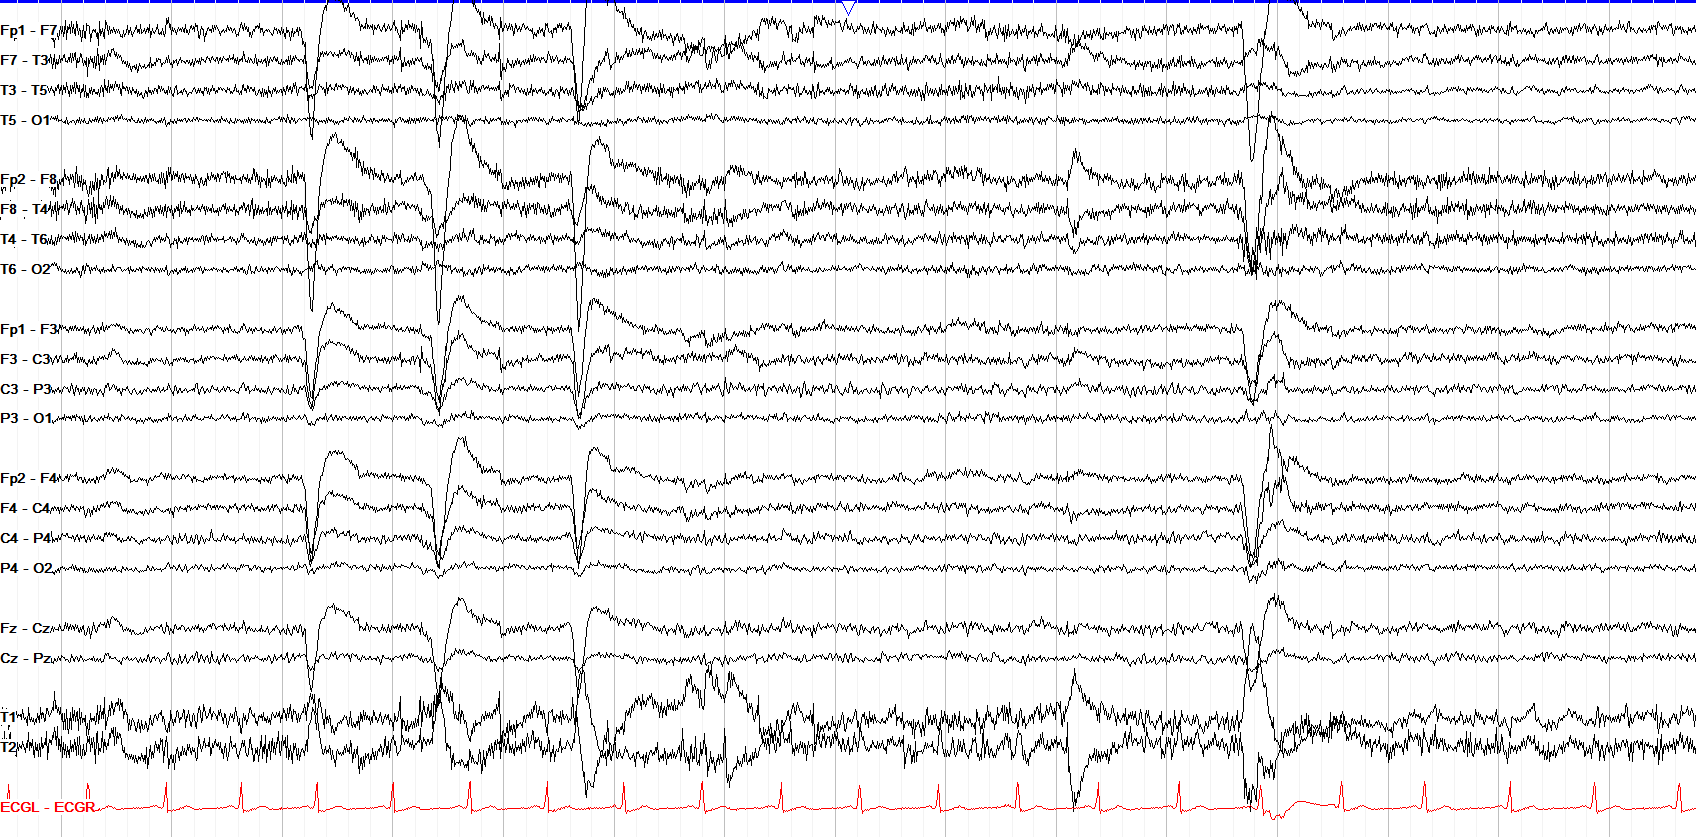
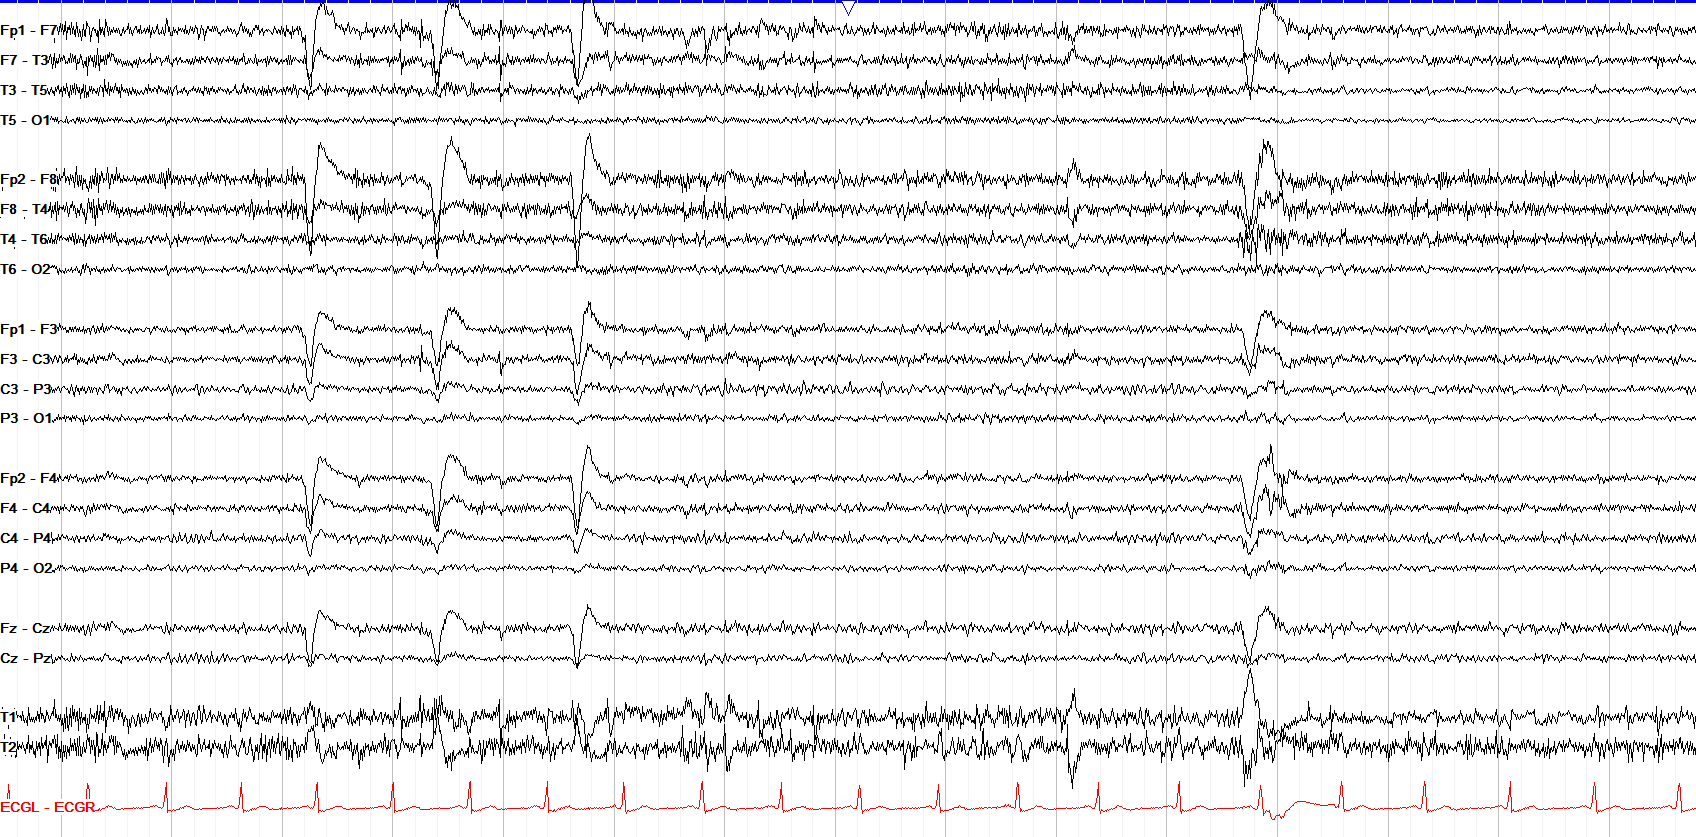
High frequency filters (HFF) filter out frequencies above a certain threshold; they are also called low pass filters because they let lower frequencies pass through. The standard HFF is 70 Hz, and choosing a HFF that is too low will filter out possibly important beta activity, while choosing one that's too high may lead to excessive myogenic artifact that obscures underlying slower rhythms.
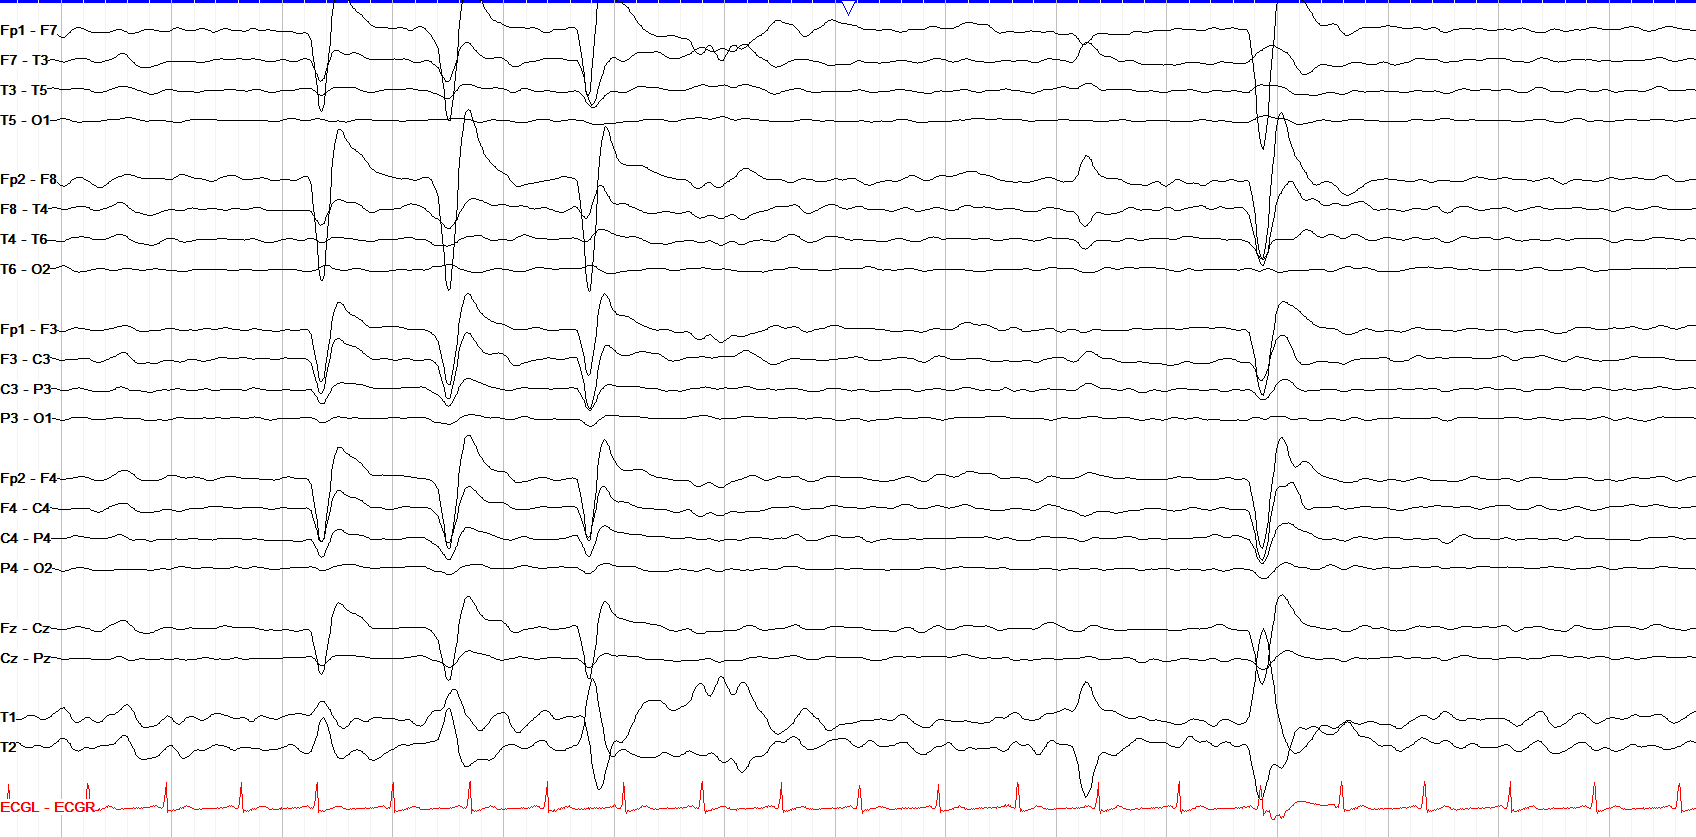
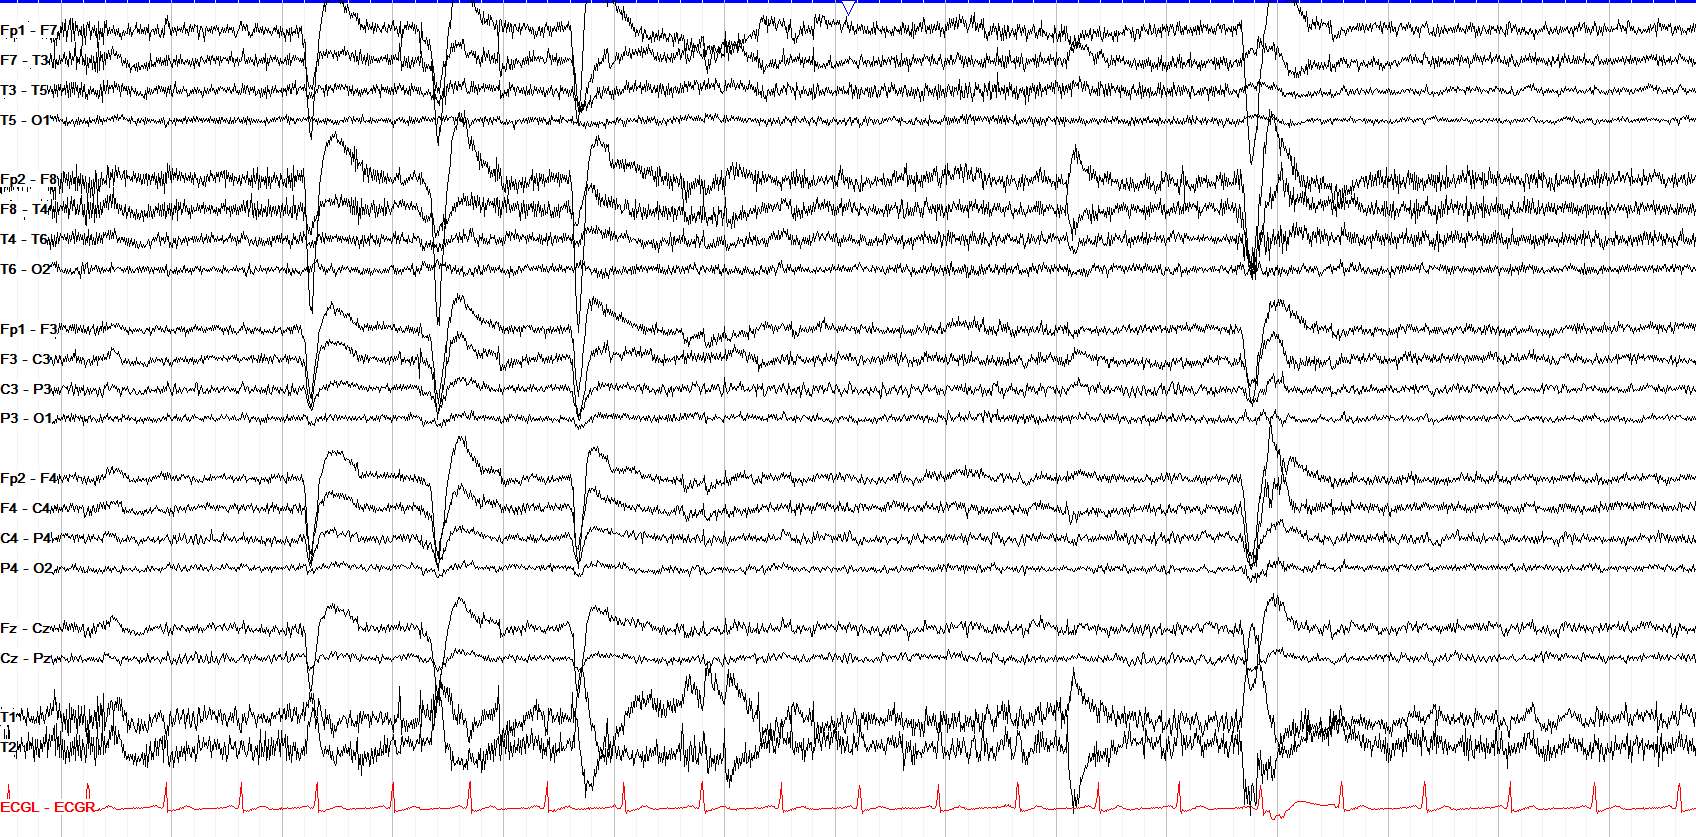
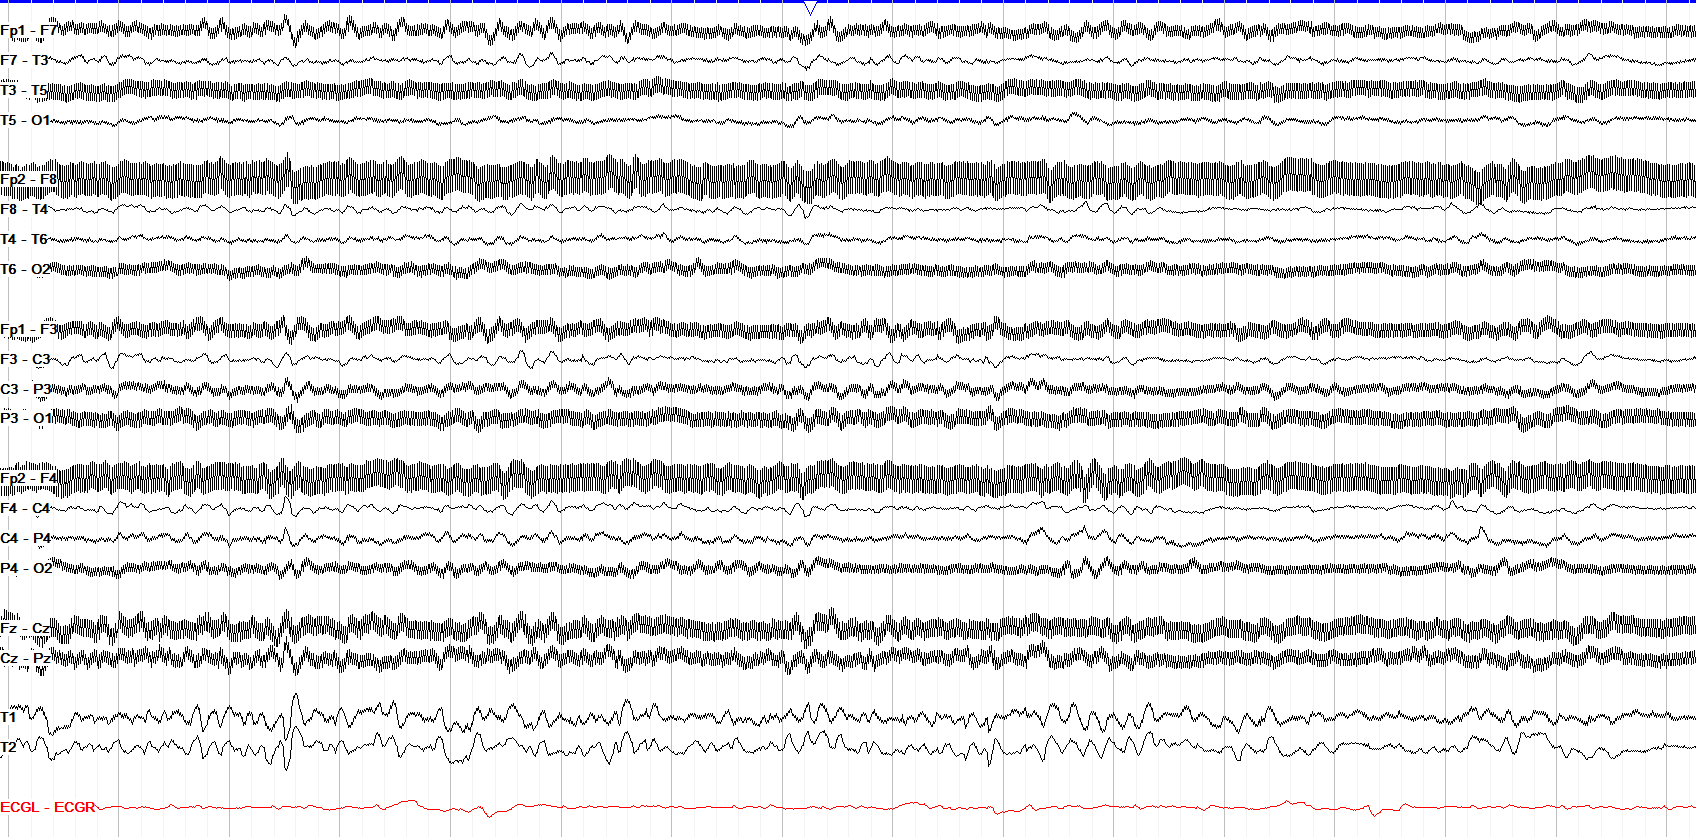
The notch filter selectively removes 60 Hz activity that arises from electrical interference such as wires and equipment (in Europe, that activity is 50 Hz). Because 60/50 Hz sits well above the range of cerebral activity reliably captured on scalp EEG, notching it out usually doesn’t affect interpretation, though can subtly distort sharp transients. Below is an example of electrical artifact with the notch filter turned off.
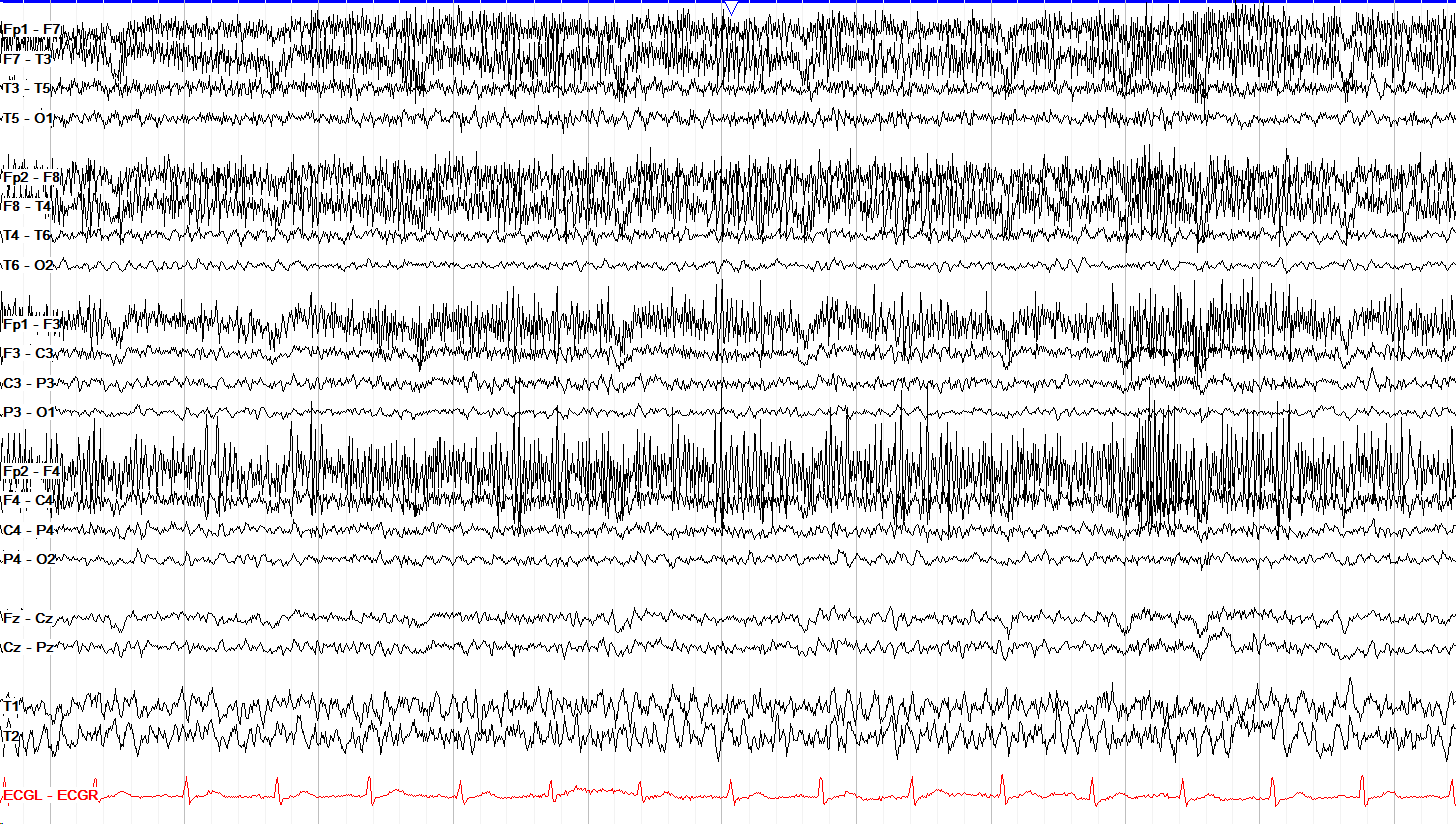
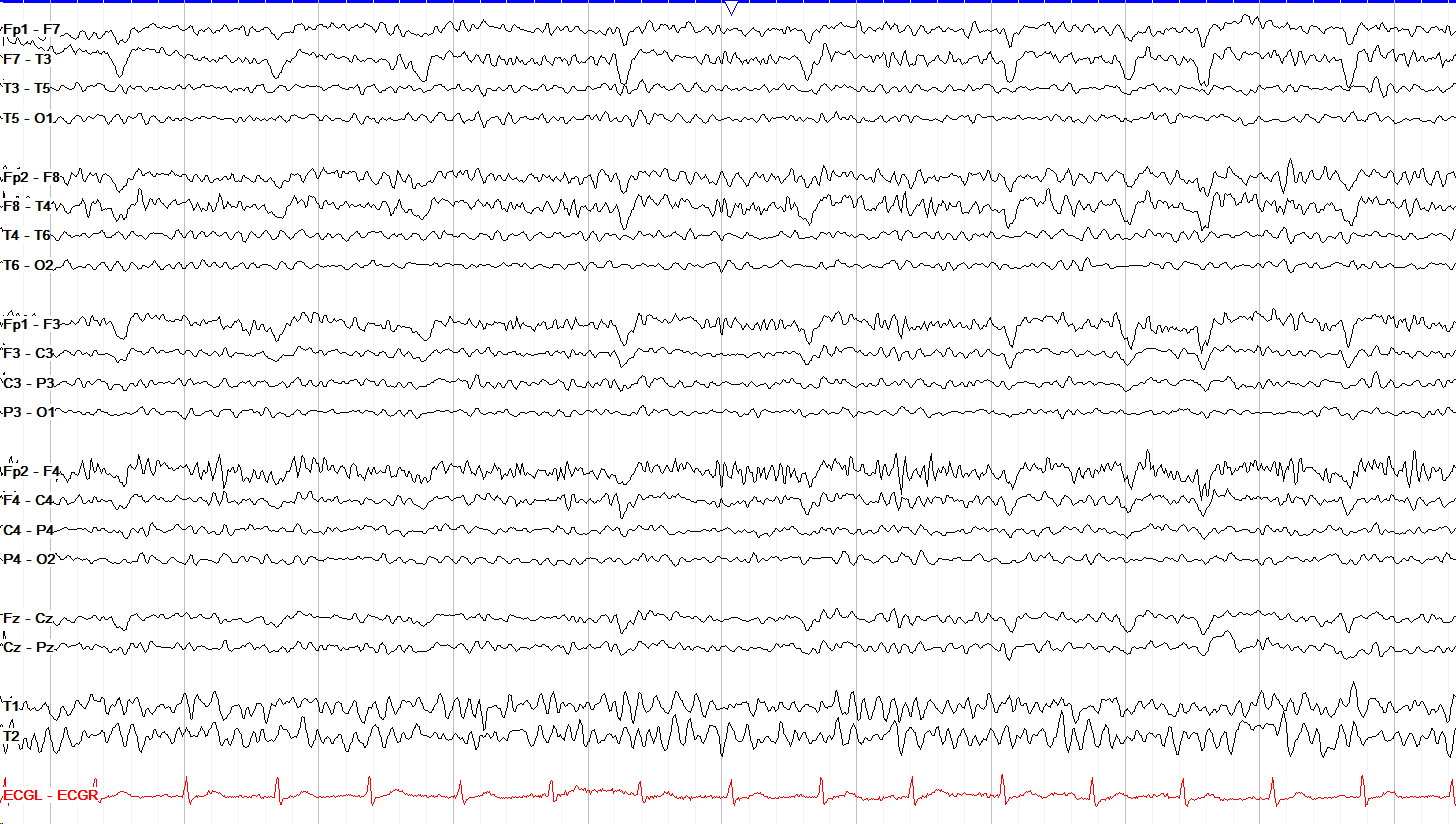
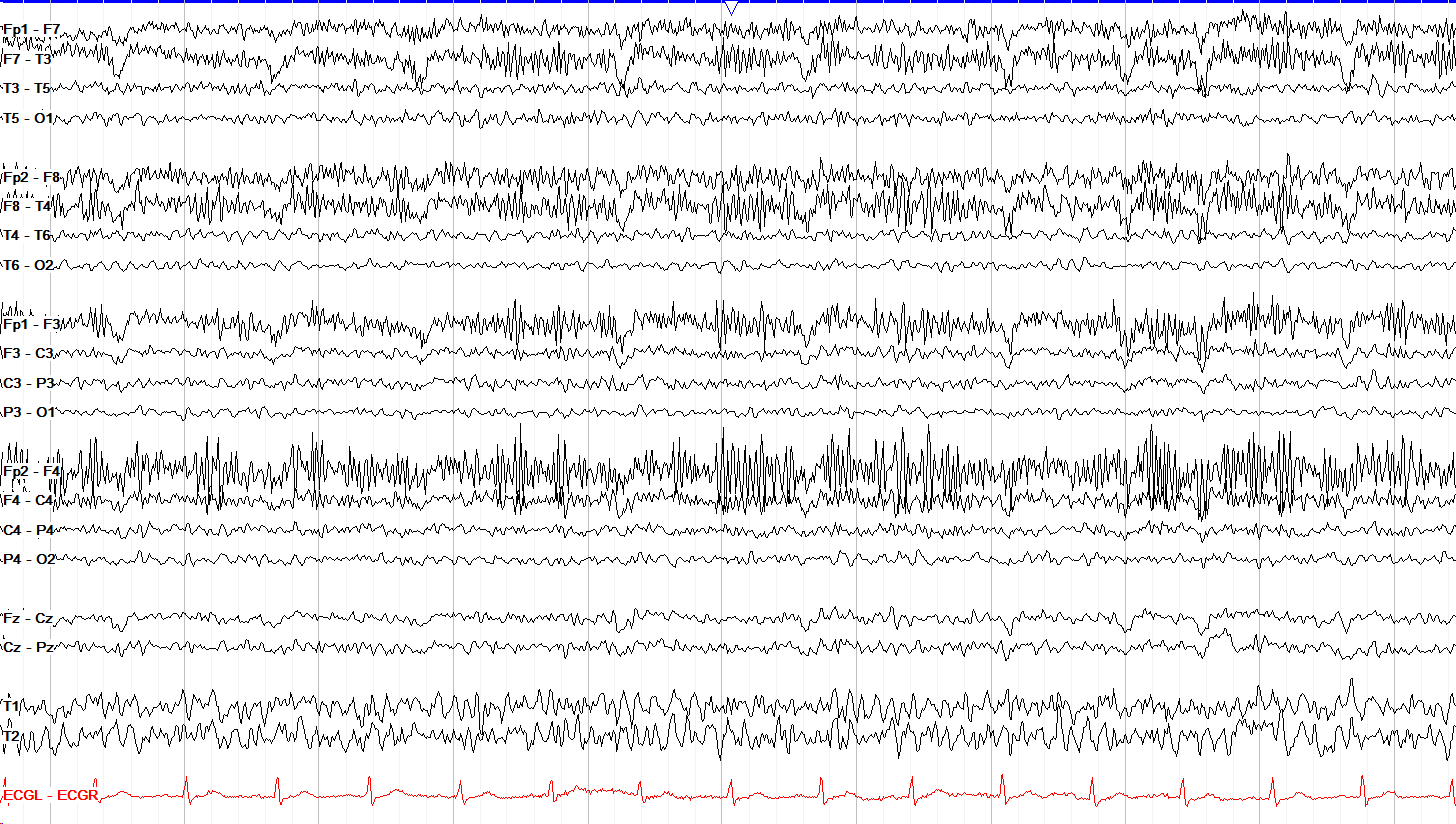
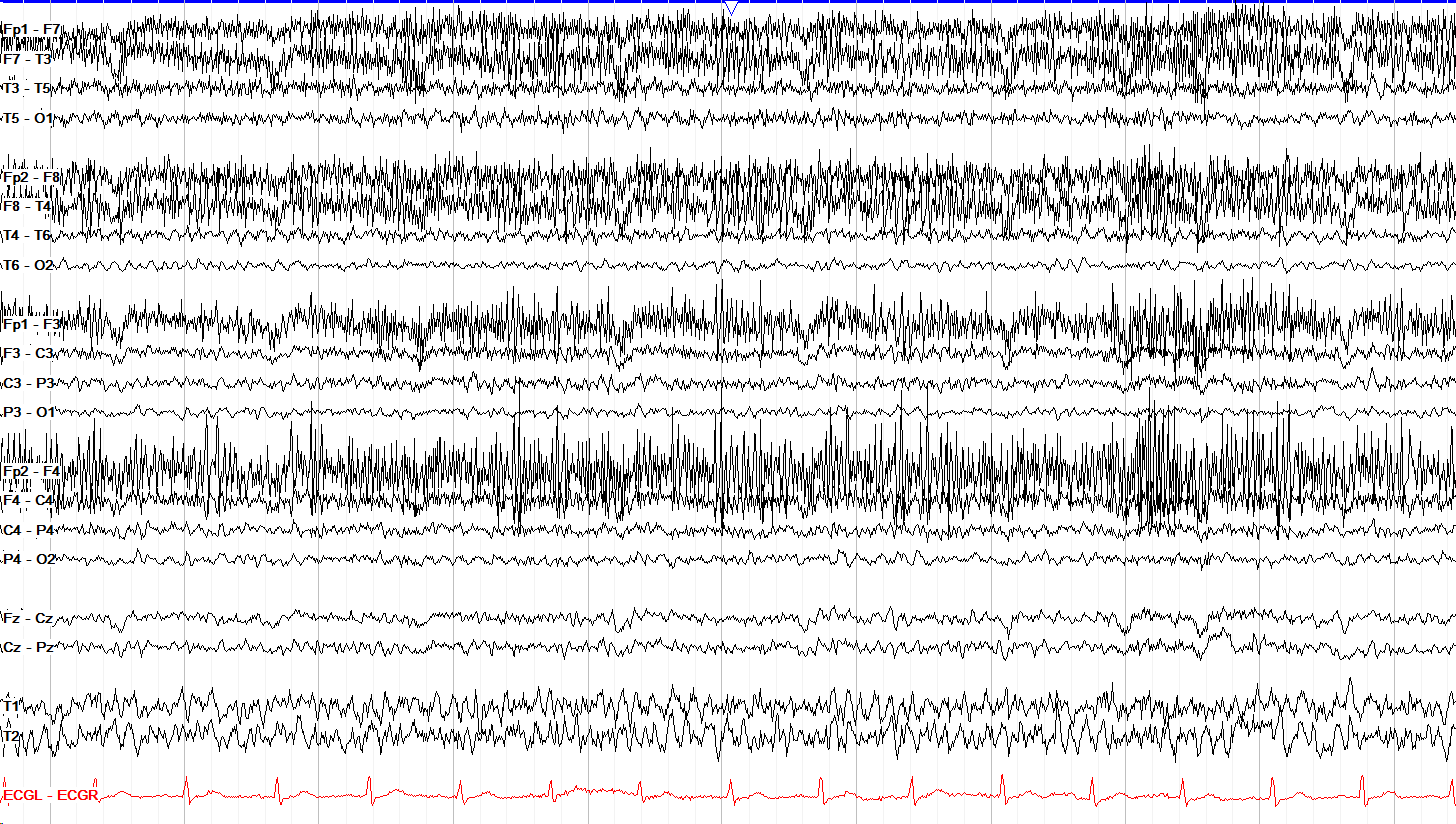
This tracing shows a lot of myogenic activity, seen as very high frequency activity most dominant over the frontal regions. This is common, but can obscure underlying slower frequencies. If this is a problem, you can lower the high frequency filter from 70 Hz to somewhere between 15-30 Hz to see if you can remove some of the artifact. However, in doing this be conscious that you may also be removing some physiologic beta activity. In this tracing, in fact, there appears to be diffuse excess beta in addition to the myogenic artifact; excess beta is most commonly found in the setting of benzodiazepine use.
Sensitivity
Sensitivity determines how tall waveforms appear on screen by setting the voltage needed to produce a given wave height. It is measured in microvolts per millimeter (μV/mm) and, somewhat counterintuitively, the higher the number the lower the sensitivity; like page speed this is a vestige of the days of paper EEG. A sensitivity of 5 μV/mm means it takes 5 microvolts to move the pen 1 millimeter, while a sensitivity of 10 μV/mm means it takes 10 microvolts to move the pen that same 1 millimeter; so, the lower number is actually more sensitive to the electrical signal. In practical terms, higher sensitivity values lead to smaller appearing waveforms.
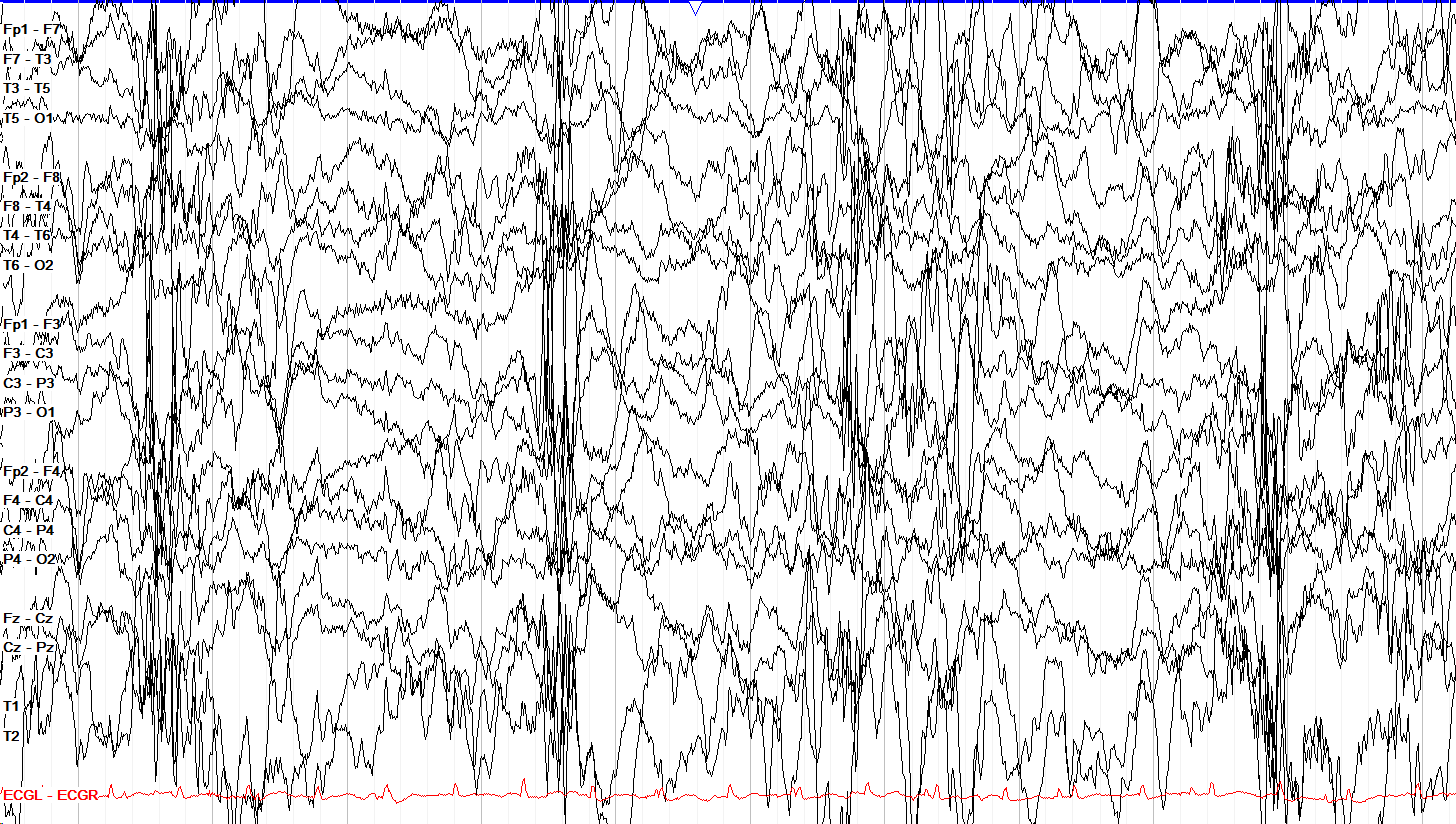
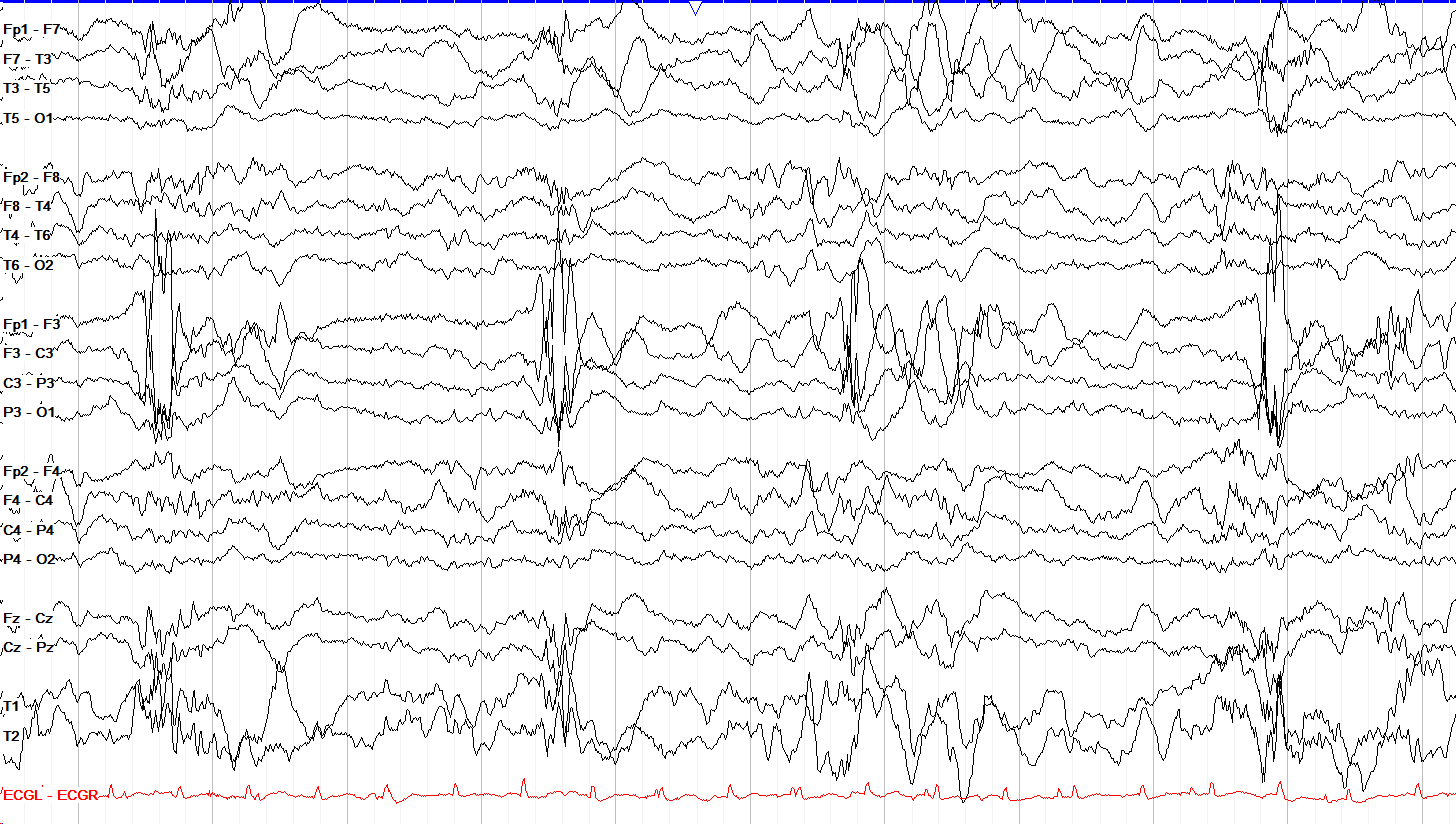
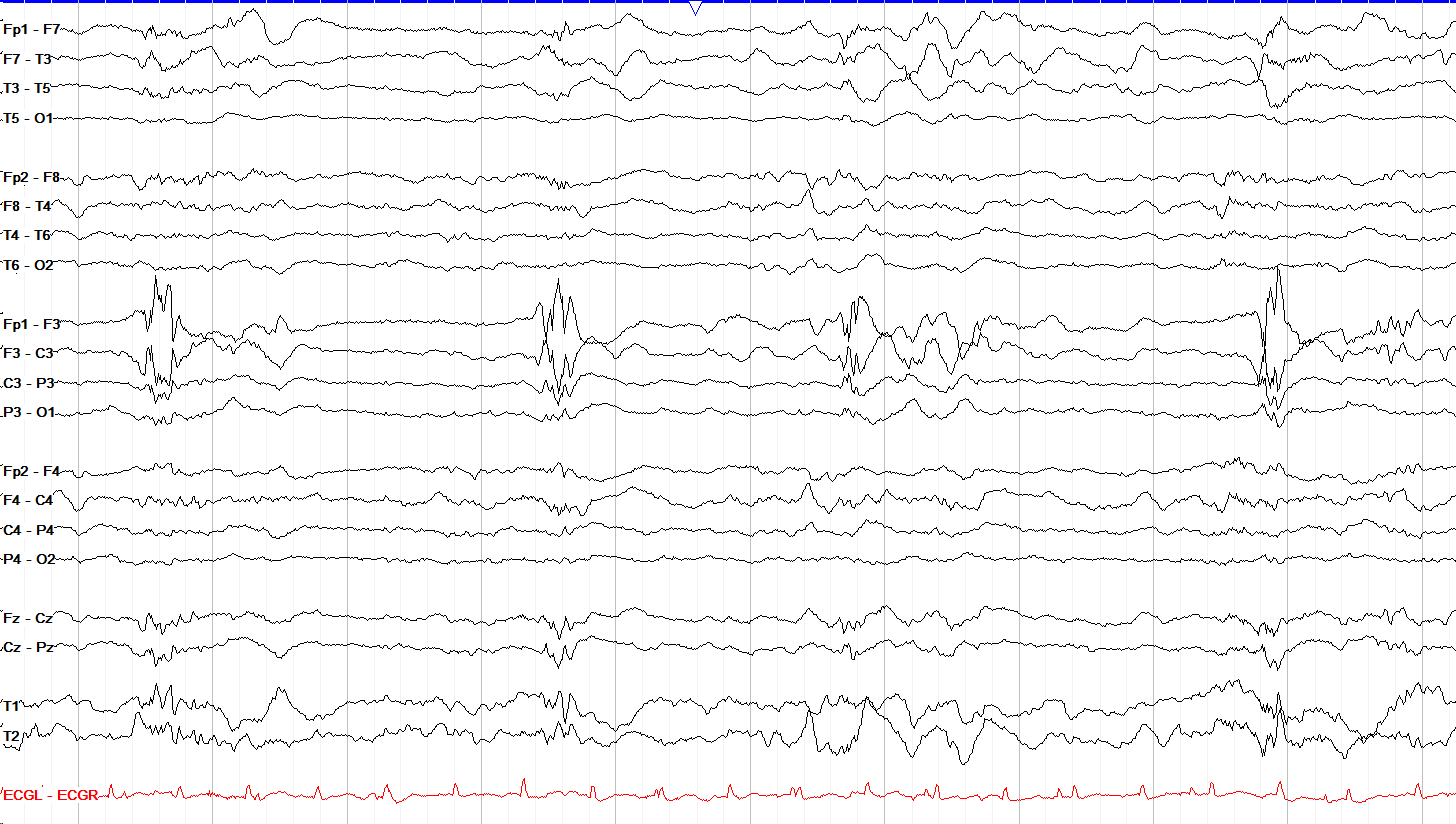
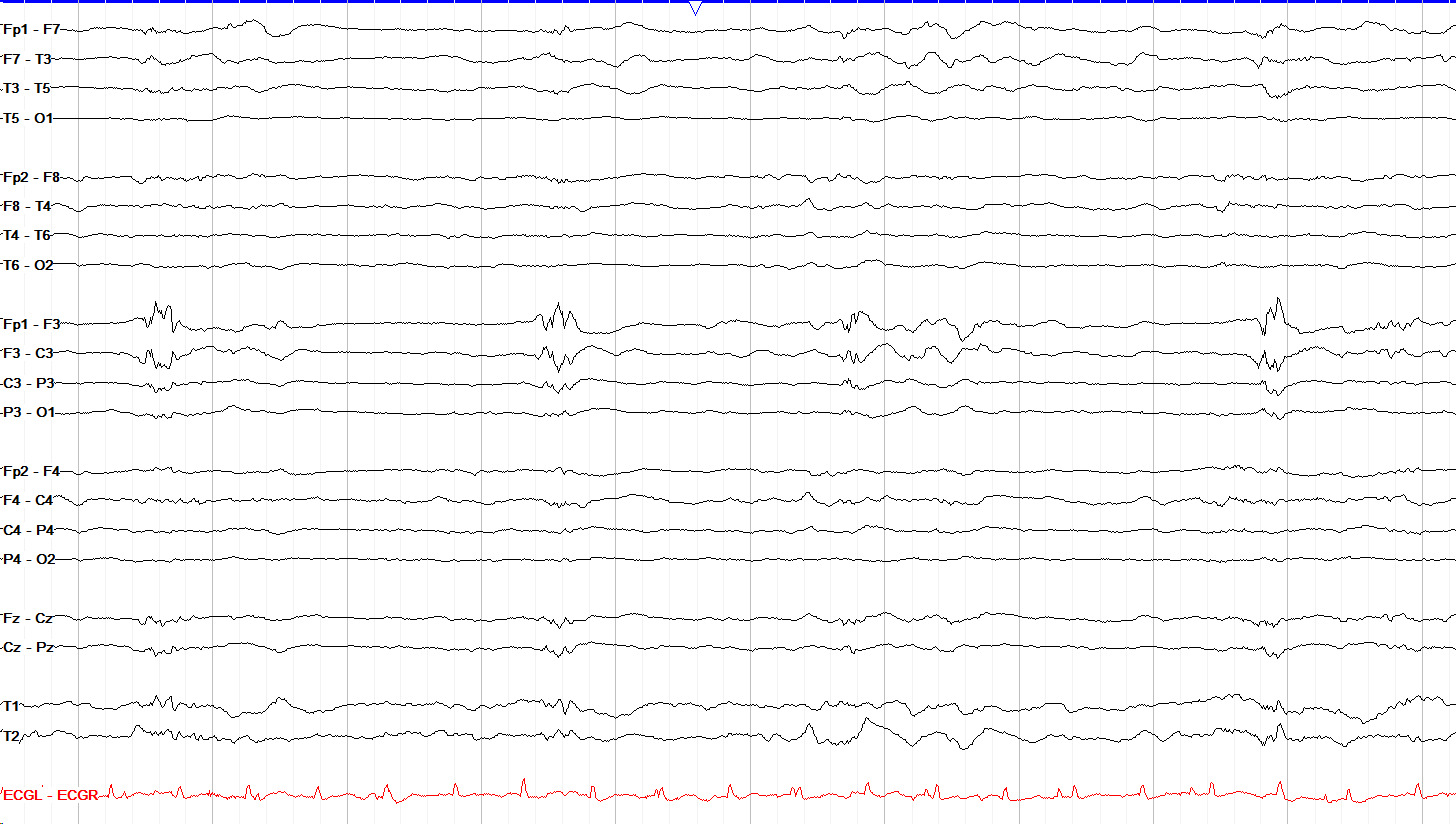
The standard reading sensitivity is 7 μV/mm, but for discharges of very high amplitude that are hard to make out, raising the sensitivity can often clarify things—just remember to go back to your previous setting afterwards so you don't miss lower amplitude activity. Note that in children lower sensitivities may be warranted; much like life in general, kids tend to have much higher amplitude activity than adults.
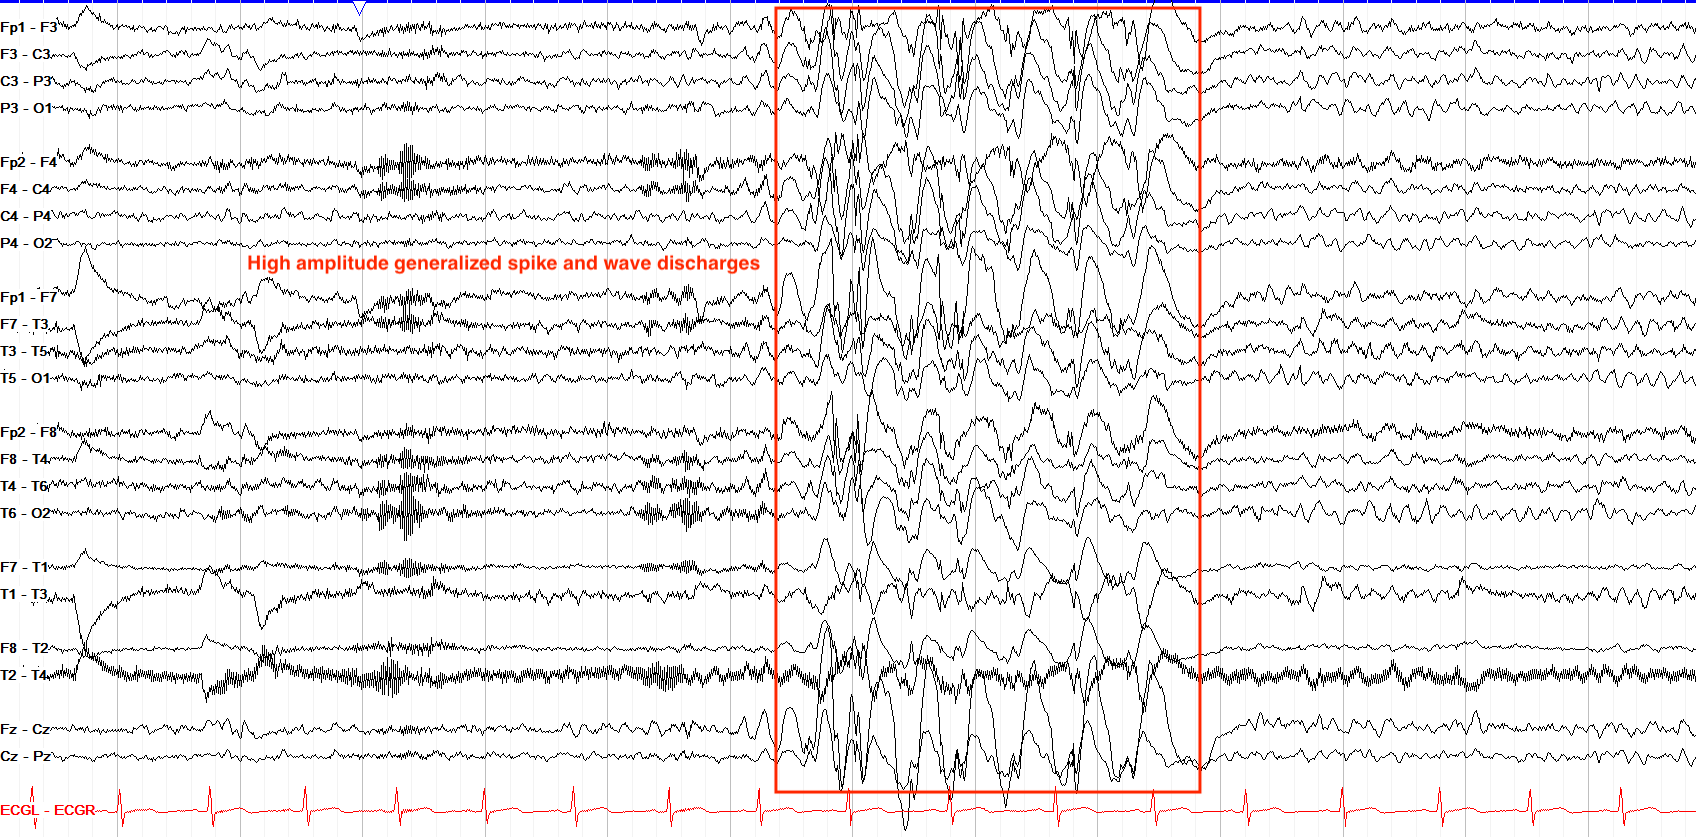
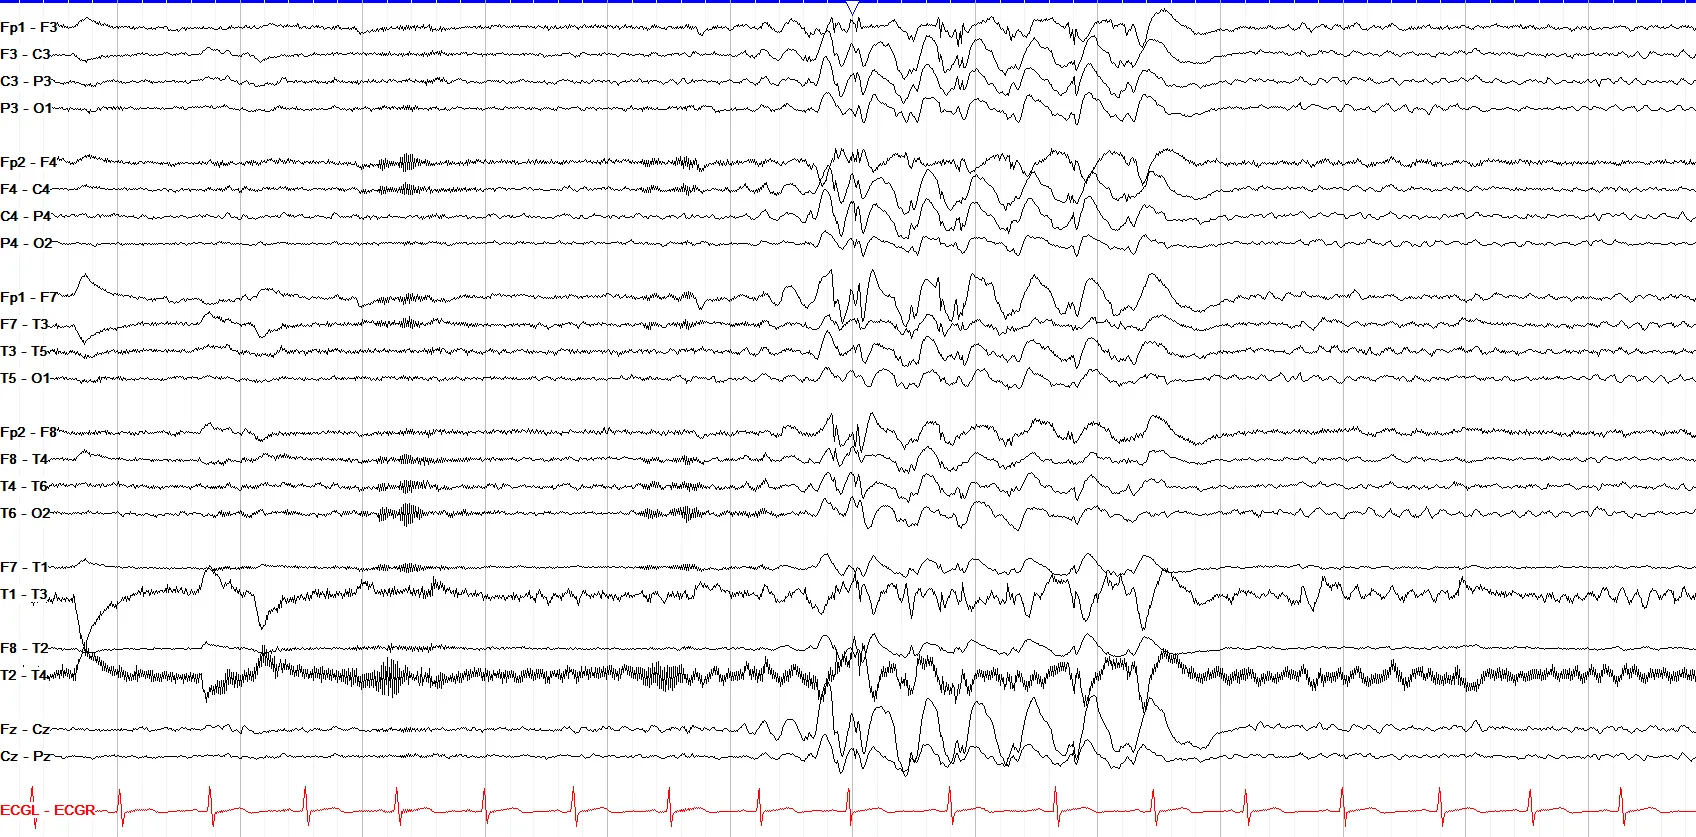
Recall that sensitivity is a measurement of how much voltage is required to cause a certain amount of deflection of a wave. Lower sensitivities require more voltage to make a wave of a certain height compared to higher sensitivities. So, in this example of very high amplitude generalized spike and waves, with some overlap into adjacent chains making it hard to clearly see the details of the waves, you can decrease the sensitivity (going from, say 7 μV/mm to 15 μV/mm) to make the waveforms appear smaller and more easily seen. The image below is the same set of waveforms but at a lower sensitivity of 15 μV/mm. Note that this also makes all the surrounding waves smaller and harder to read.
- The 10-20 system standardizes electrode placement by dividing the skull into 10% and 20% intervals; letters denote brain regions (F, T, P, O, C) and numbers denote laterality (odd = left, even = right, z = midline).
- Bipolar montages compare each electrode to an adjacent one in a chain; the most common is the double banana, with temporal, parasagittal, and central chains. Phase reversals in these montages point toward the electrode of maximal voltage.
- The end of chain phenomenon at terminal electrodes (Fp1, Fp2, O1, O2) can be resolved with circumferential montages.
- Referential montages compare all electrodes to a single reference point; waves up are always negative, down always positive, with no phase reversals.
- Page speed determines how many seconds of tracing are displayed at a time, while sensitivity reflects the voltage needed to make a waveform of a certain height.
- Standard technical settings: page speed 30 mm/sec (adult), LFF 0.5-1 Hz, HFF 70 Hz, sensitivity 7 μV/mm.
- The notch filter removes 60 Hz (or 50 Hz in Europe) electrical interference from equipment.
- Different technical parameters change waveform appearance, so the same activity looks different at different settings.