Slowing Suggests Dysfunction
While EEG is best known for its role in seizure detection and characterization, a broad array of other abnormalities can arise due to varying degrees of brain dysfunction in both focal regions of the brain and more diffusely. Thus, discerning abnormal backgrounds, patterns, and discharges from normal ones is paramount when reading an EEG.
Perhaps most common among the non-epileptiform abnormalities is slowing or disorganization, which is categorized in several ways including generalized vs focal, continuous vs intermittent, and polymorphic vs monomorphic/rhythmic.
Generalized Slowing
In reading the overall background of an EEG, you look for organization including continuity, reactivity, variability, symmetry, synchrony, an anterior to posterior (AP) gradient, posterior dominant rhythm (PDR), and appropriate state changes. If any of these are lacking, there is disorganization, the most common cause of which is generalized slowing. This is a nonspecific finding suggestive of diffuse cerebral dysfunction or encephalopathy as can be seen with infections, metabolic problems, hypoxic-ischemic injury, medication effect, neurodegenerative disease, and more. Generalized slowing is categorized into mild, moderate and severe, or middle-grounds between the three.
Mild generalized slowing is typically characterized by the presence of a slowed PDR and a suboptimal AP gradient, often with excess theta mixed with the normal alpha activity; reactivity, variability, state changes and the other markers of a normal awake EEG remain. With moderate generalized slowing the PDR is very fragmented or gone entirely, and the record shows a predominance of theta into delta activity with much less alpha. Severe generalized slowing is highly disorganized, dominated by delta activity, often discontinuous, and without clear state changes, reactivity, or appreciable architecture such as an AP gradient or PDR.
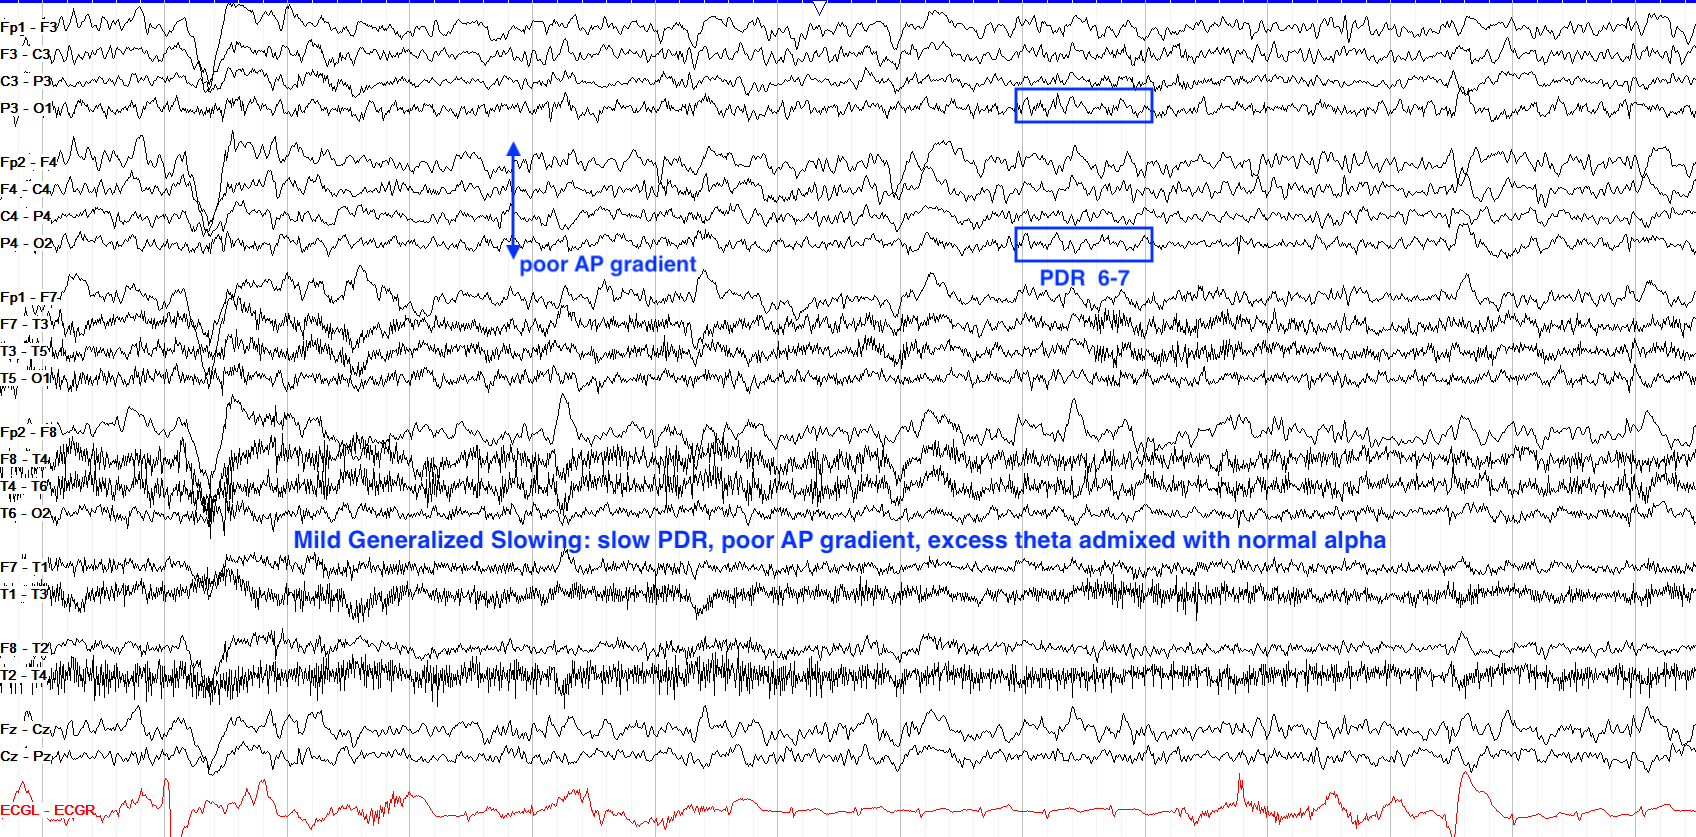
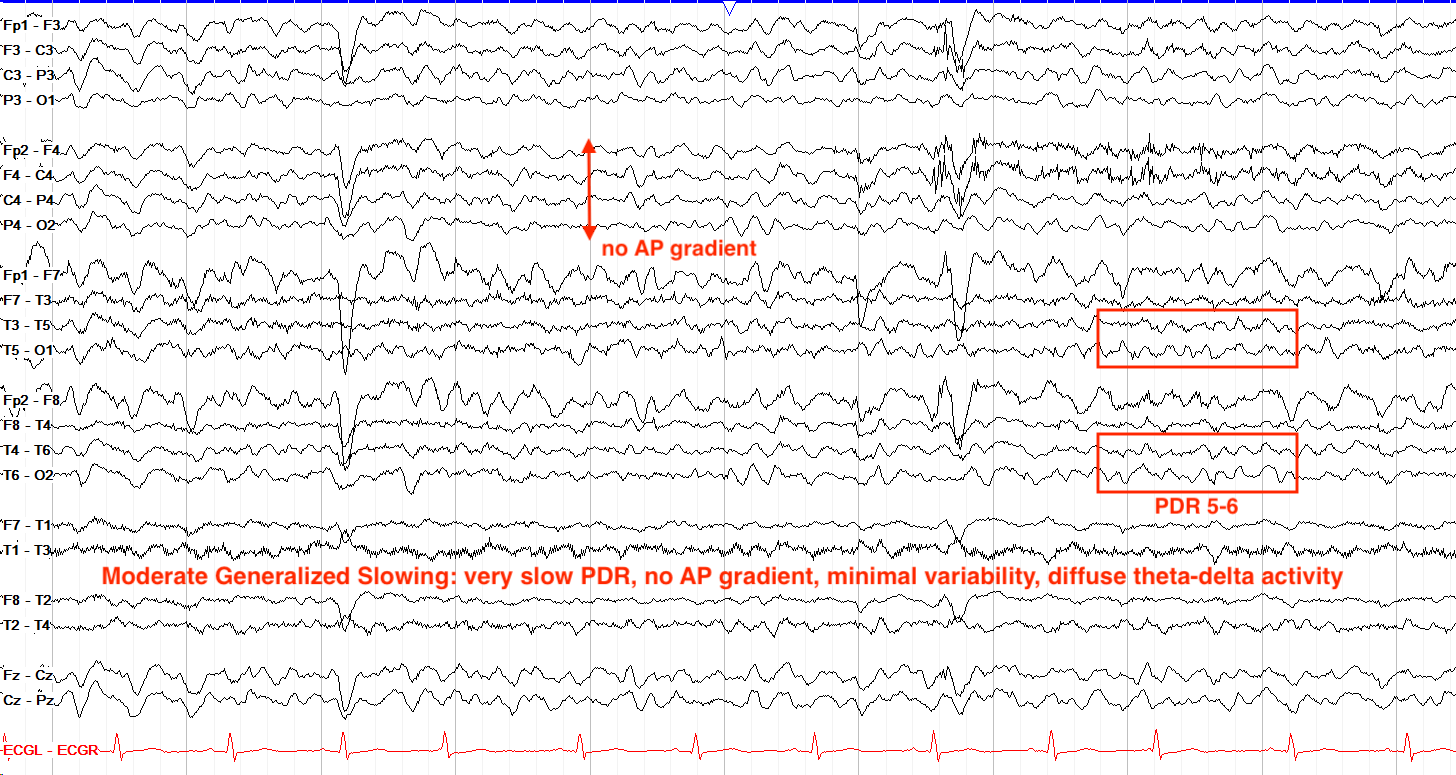
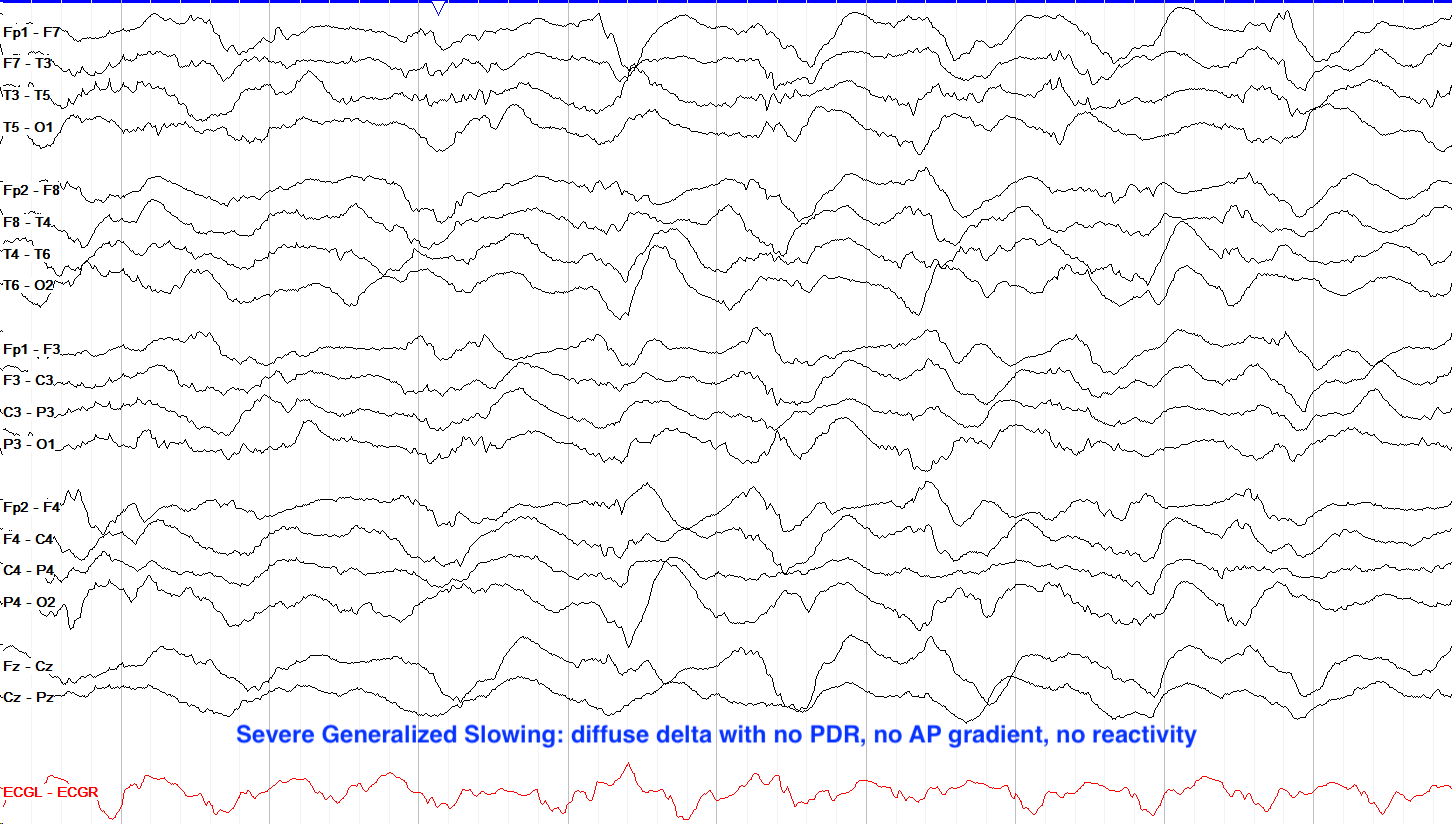
When tracings sit in the middle of these groups, you can specify that; for instance if there is a tracing that’s mostly theta but has some periods of subtle discontinuity and less clear reactivity or state change, you may term that moderate to severe generalized slowing.
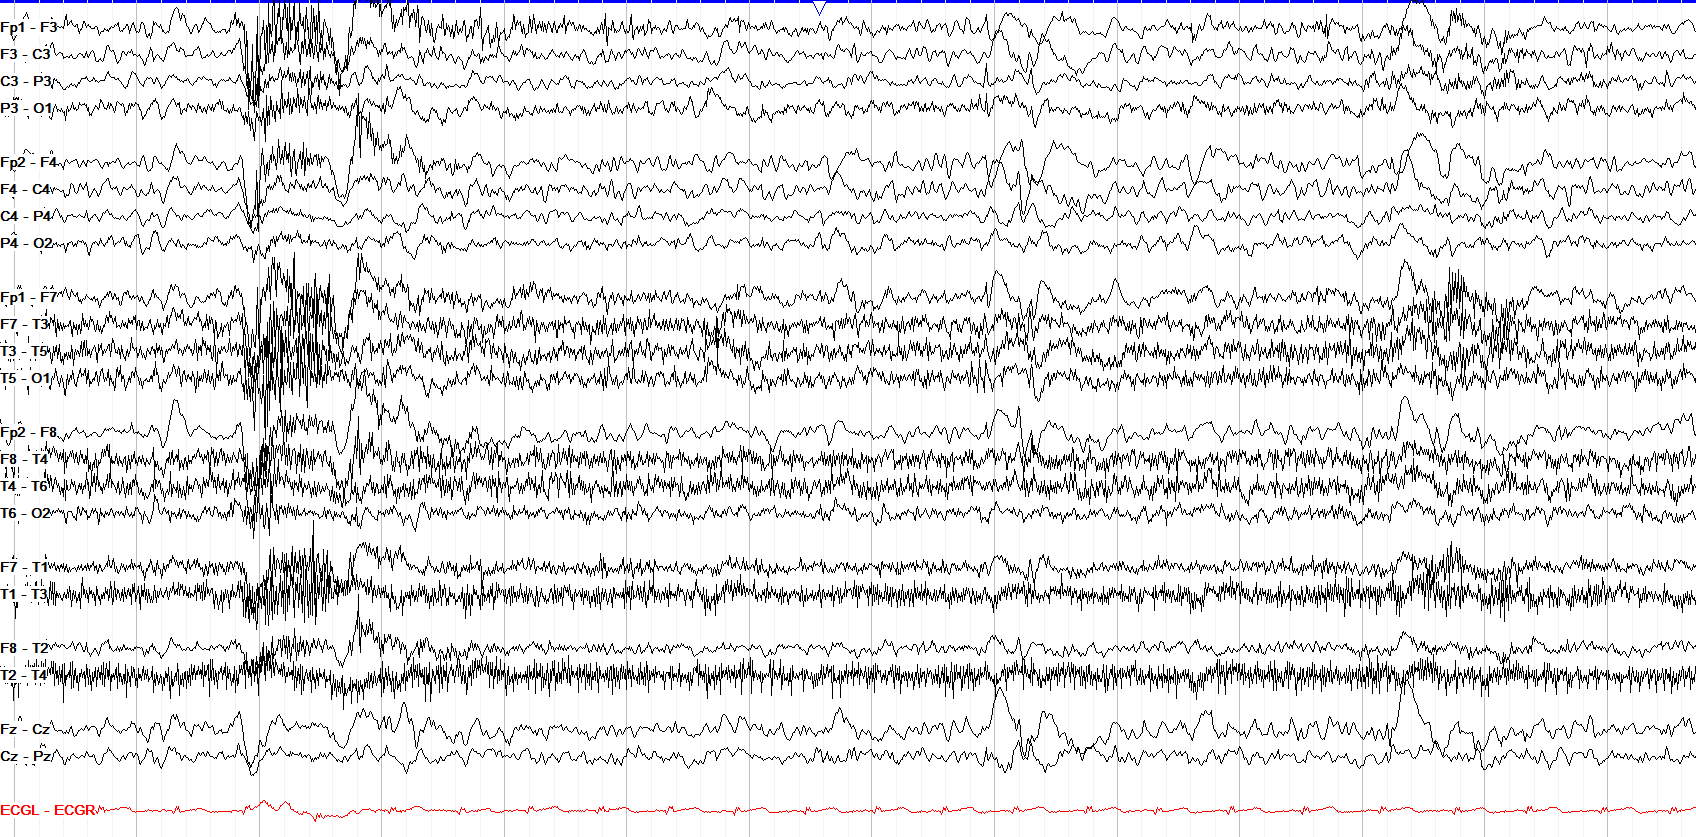
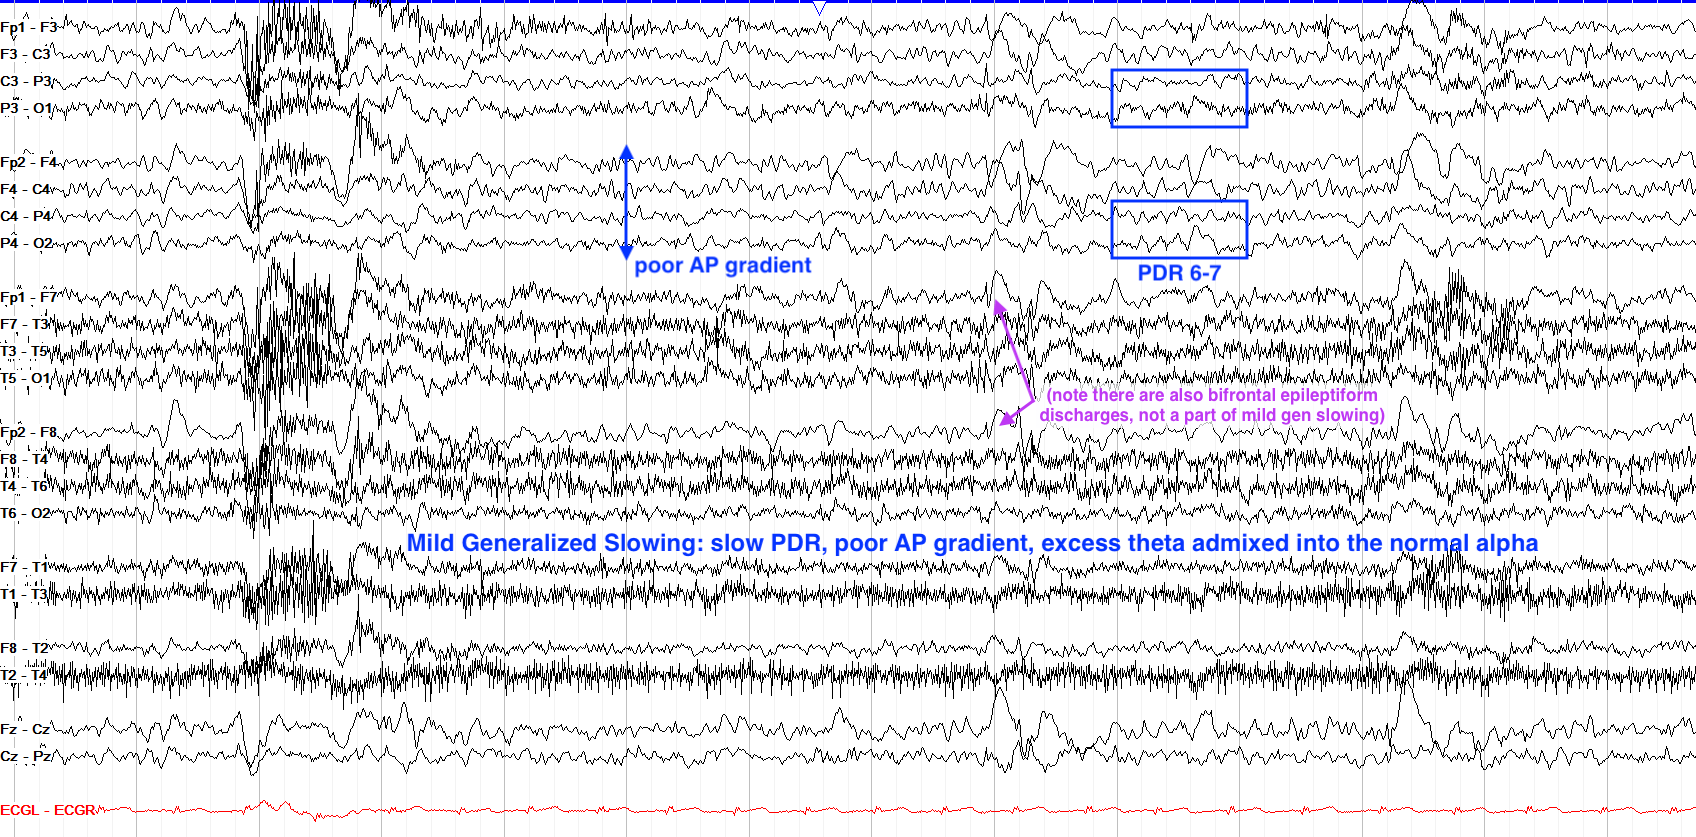
This tracing is marked by a mildly slow PDR of 6-7 Hz, along with a notably less organized AP gradient. Much of the usual architecture of a normal study is here though, including eye blinks and variability across the page. We see some excess theta admixed into the normal and expected alpha activity, but no major delta activity. The area marked by a purple arrow may appear to be frontal delta activity, but these are in fact epileptiform spike and slow waves (note the notch-like spike before each large slow wave), discussed in the epileptiform activity section.
Focal Slowing
While generalized slowing suggests diffuse brain dysfunction, focal slowing is more indicative of a structural abnormality involving the slowed area, particularly if the slowing is mostly delta.
Focal slowing can be categorized, based on its morphology, as either polymorphic or monomorphic (rhythmic). Focal polymorphic slowing reflects mostly subcortical white-matter involvement with cortical disconnection, and is a reliable but nonspecific marker of a structural lesion. Rhythmic focal slowing may have a structural correlate but its significance is more that it’s often associated with cortical hyperexcitability and seizure risk (this is further discussed below and in the epileptiform activity section).
Aside from morphology, focal slowing is also categorized based on its persistence, as either continuous / persistent or intermittent. Continuous / persistent focal slowing is suggestive of a significant structural abnormality such as a tumor, bleed, ischemic infarct, demyelinating lesion, significant atrophy, and more. Intermittent focal slowing can also arise due to a structural abnormality, but such abnormalities tend to be smaller in nature, such as a focal cortical dysplasia or the beginnings of a small tumor, and thus are more likely seen on EEG with certain state changes, accompanying illness, or medication effect (this is not a hard and fast rule). While slower frequencies (delta vs theta, for instance) don’t necessarily suggest a worse underlying abnormality, continuous slowing is worse than intermittent, and a rule of thumb is that the less reactive and variable a slowed region is, the worse the underlying cerebral dysfunction.
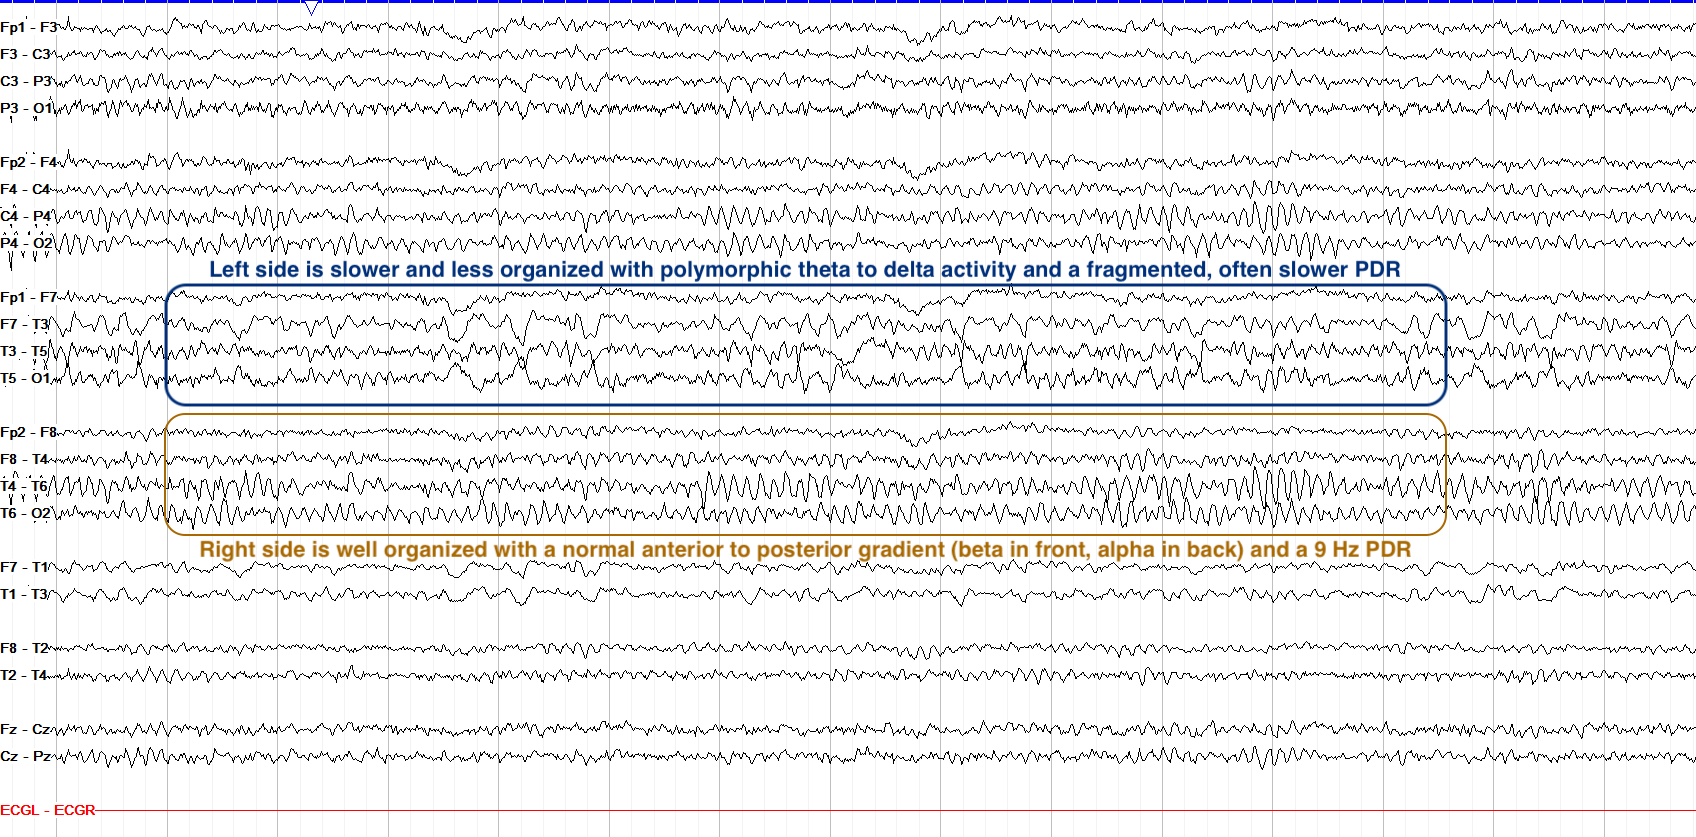
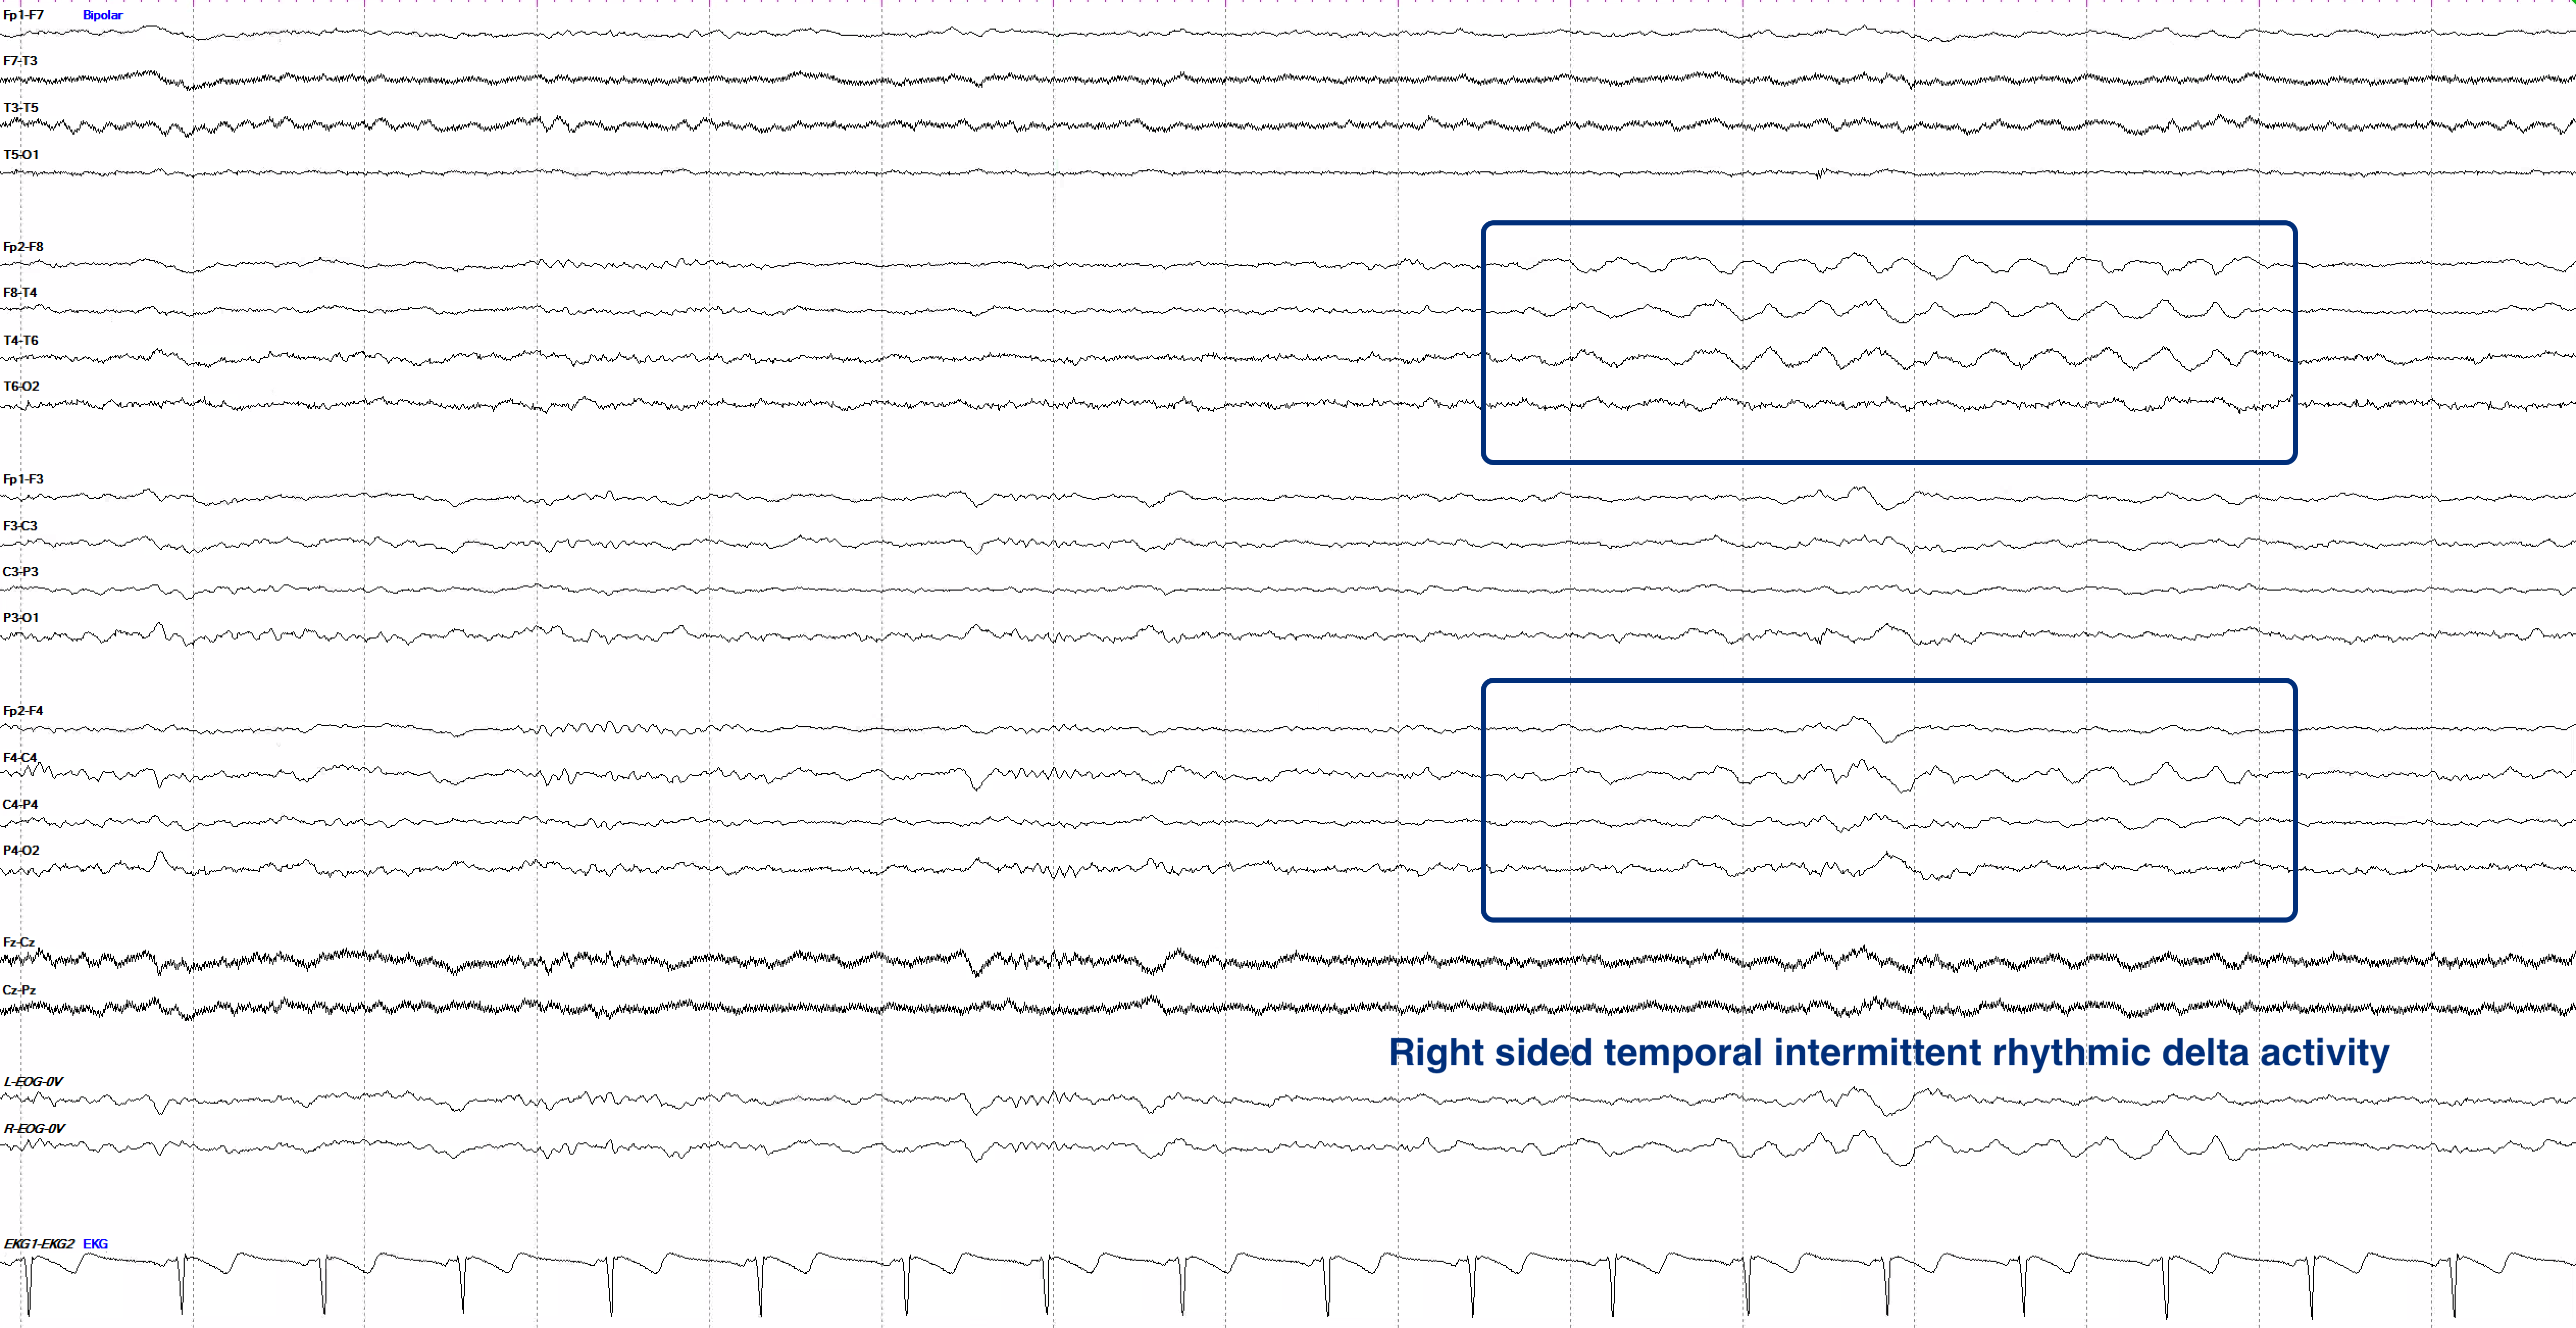
In the continuous polymorphic slowing example below, notice how the left hemisphere (maximal temporally) continuously has a slower to at times absent PDR compared to the right, and is marked by theta to delta activity while the right hemisphere has normal alpha and beta activity. While the intermittent rhythmic example has a much quieter background overall, you can clearly see the right hemispheric, temporally predominant 2-3 Hz rhythmic activity wax and wane in the latter half of the page.
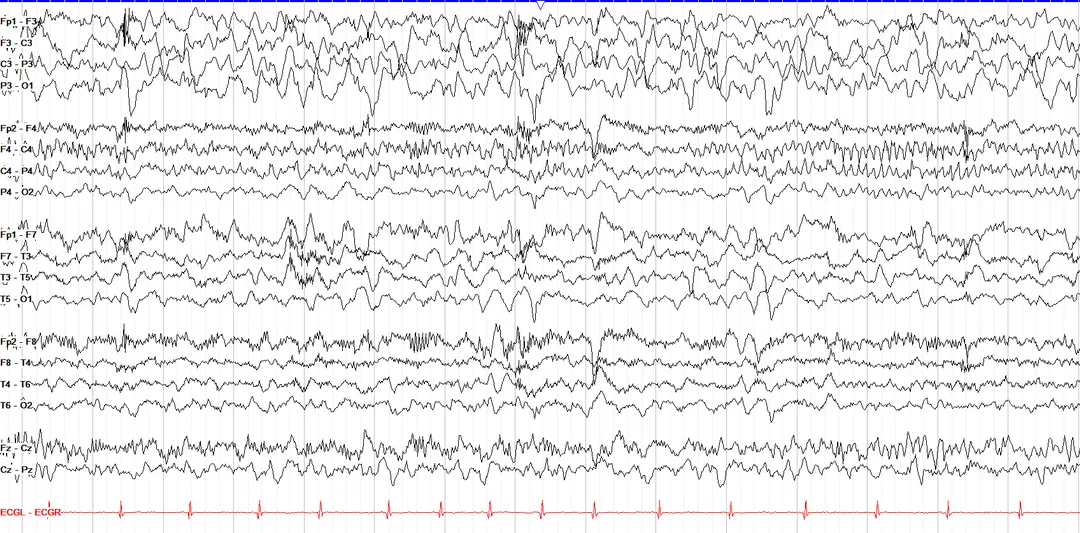
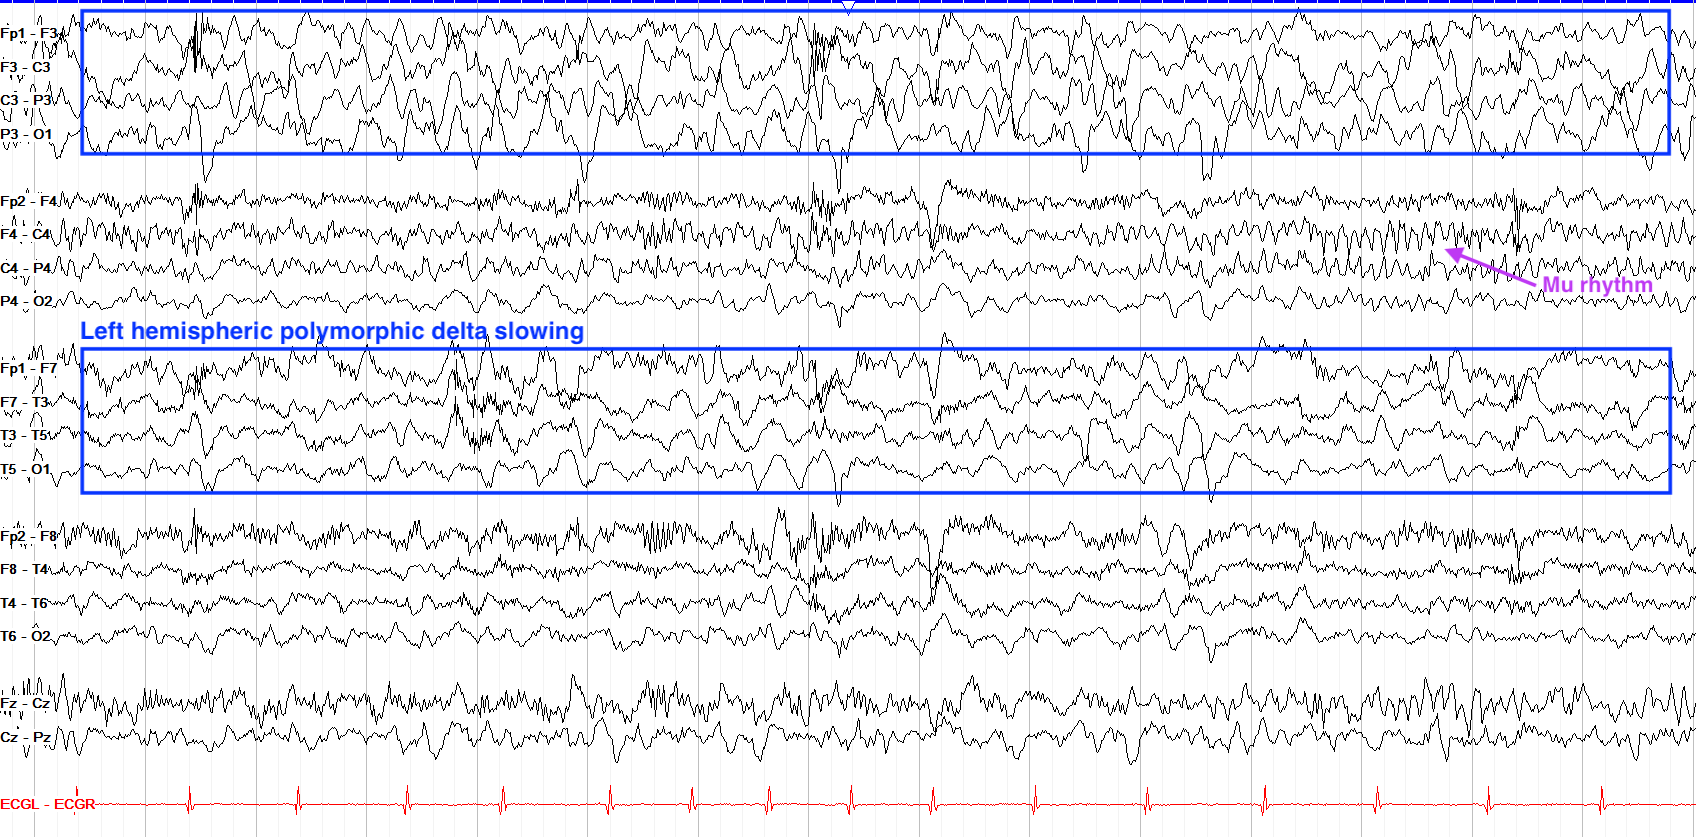
This tracing shows persistent high amplitude delta slowing over the left hemisphere, though the right hemisphere also shows less organization and more delta than is typical. So, this appears to be a combination of focal left hemispheric on top of more generalized slowing.
Given the high amplitude particularly over the parasagittal chain, this may represent not just slowing but breach, which is seen after brain surgery and discussed more below. Note also the periods of mu rhythm--the resting alpha frequency of the sensorimotor cortex that is arch-like in morphology, over the right parasagittal chain; mu rhythm goes away with thoughts of or initiation of movement.
Breach Activity
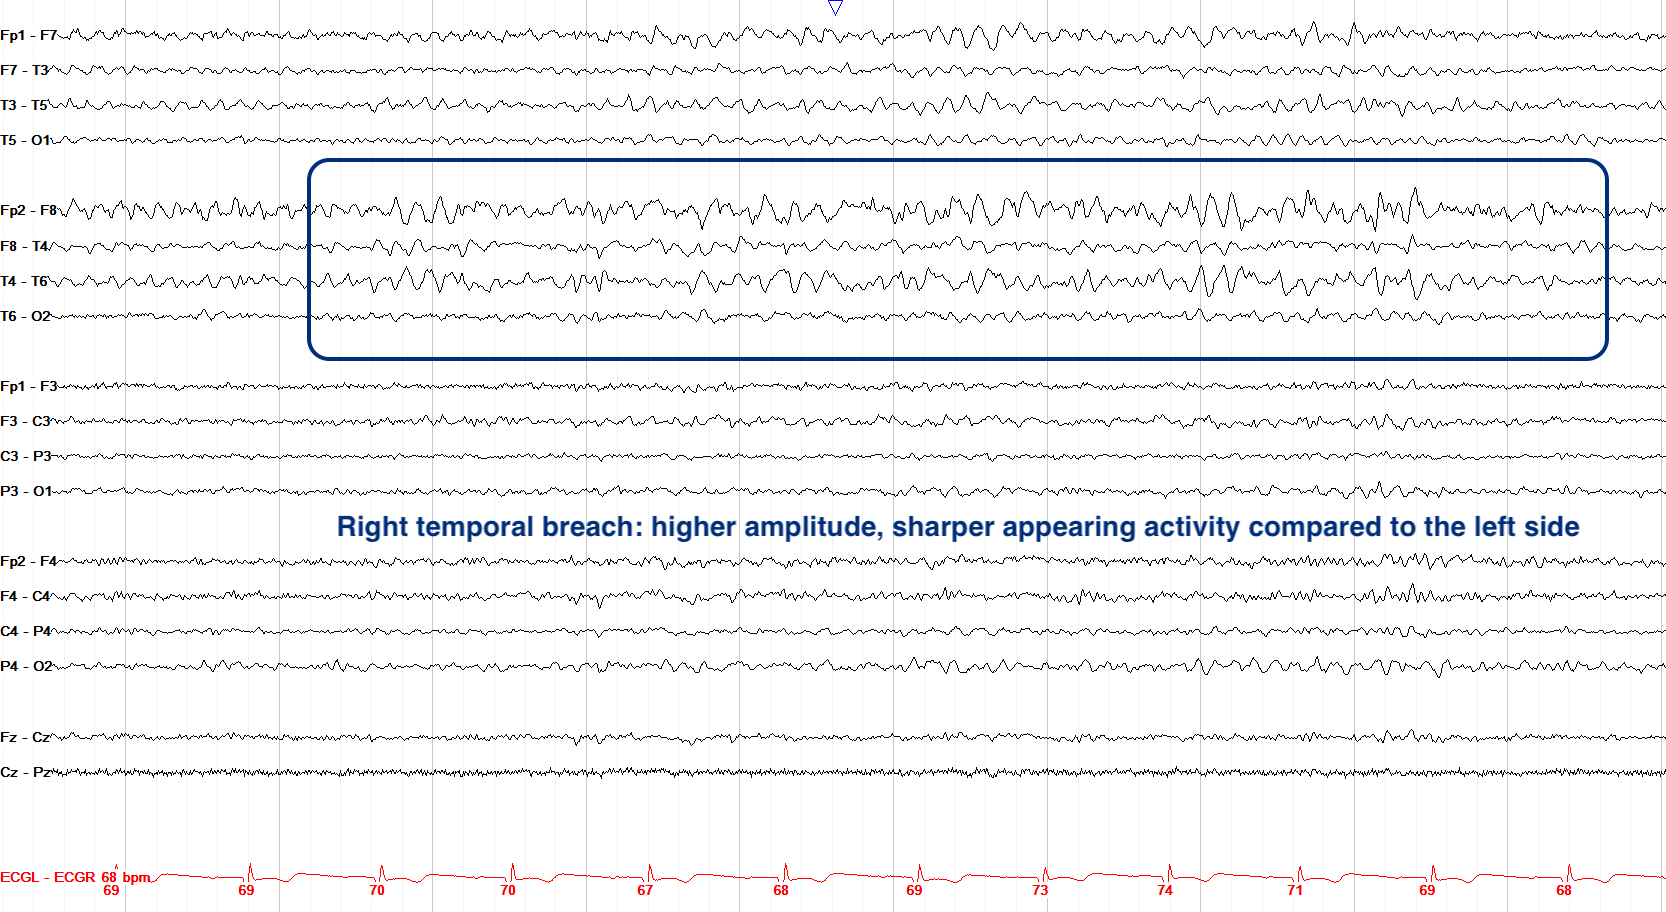
Breach activity describes higher amplitude, often spiky (apiculate) and slightly irregular appearing activity over a region of the skull that has been previously opened due to brain surgery. It is so named because the surgical breach in the skull allows slightly different patterns of electricity through to the scalp electrodes relative to areas with an intact skull.
Often, breach activity coincides with slowing because the region of brain underneath, if it needed surgery, likely had something wrong with it in the first place. It is important not to mistake the spiky appearance of breach activity for epileptiform discharges, though such discharges can certainly sit within an area of breach in the setting of pre-existing underlying pathology or post-surgical inflammation.
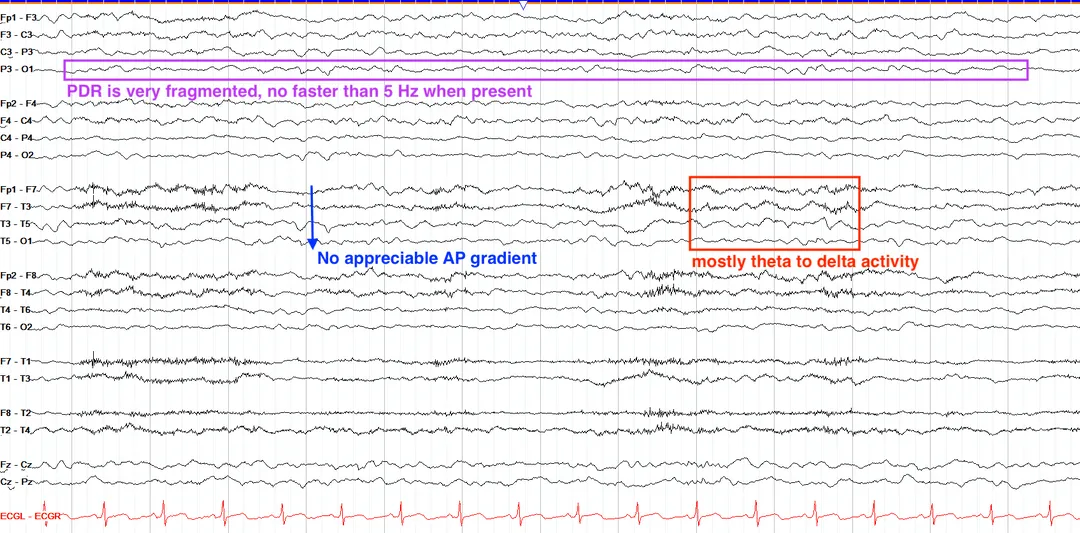
Recall that when assessing background you should look for a PDR, AP gradient, synchrony, symmetry, continuity, reactivity, and clear wave morphology. On this page, we have a continuous tracing that is synchronous and symmetric. However, there are only fragments of a PDR on both sides, and when present it is no faster than 5 Hz. Thus we have at least mild generalized slowing here. However, there is also no AP gradient—realistically, the page would look much the same if we flipped it upside down. Furthermore, we don’t have much alpha activity, with the page mostly theta and delta activity that is relatively monotonous in appearance from beginning to end. Overall, then, this would be considered moderate generalized slowing.
Attenuation & Discontinuity
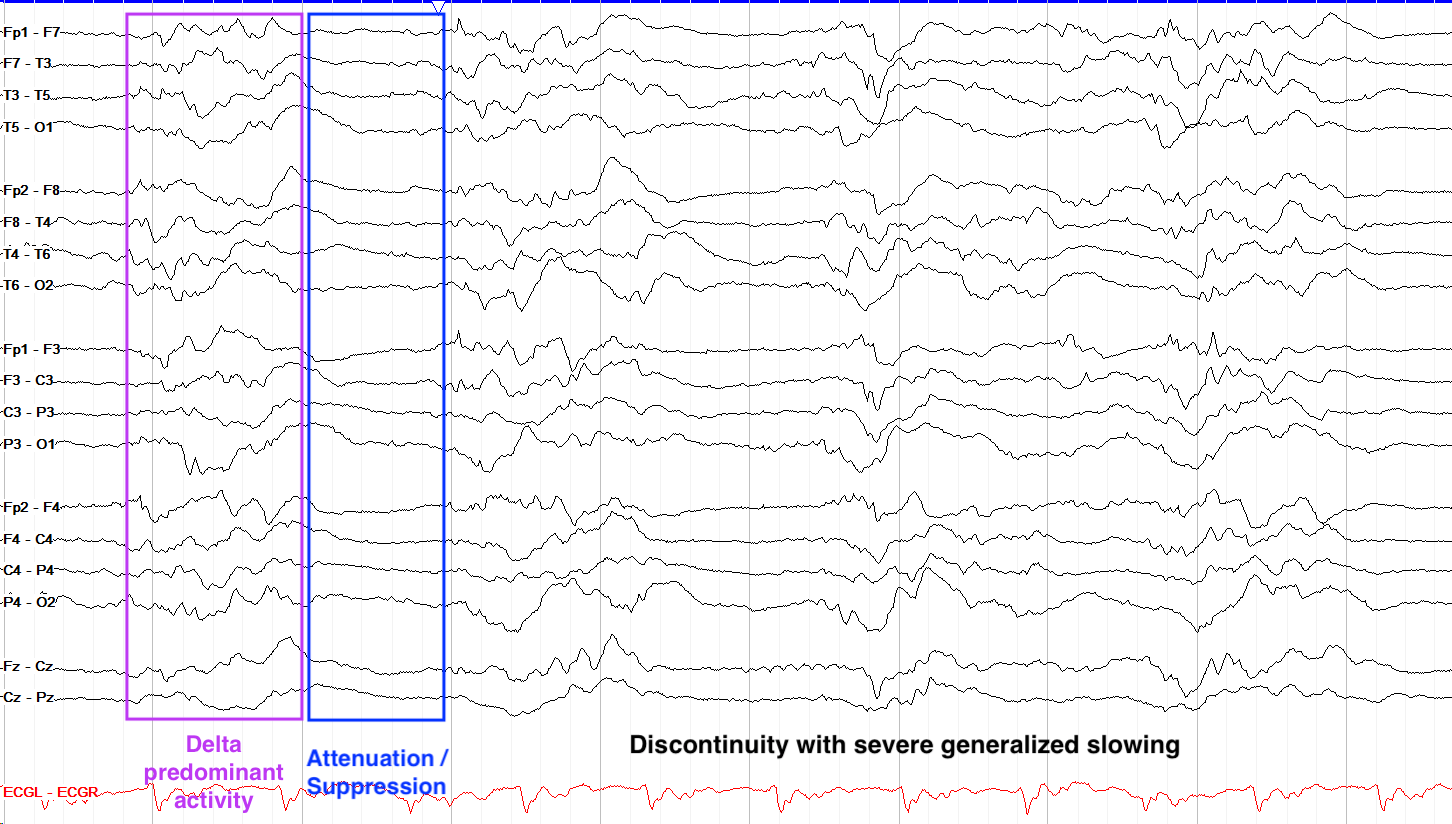
While breach activity is seen as higher than expected amplitude and spiky morphology, attenuation describes lower amplitude activity. Persistent attenuation over a region can come from something sitting between the brain and the skull, like a hematoma or hygroma, or a brain issue itself such as a stroke. Intermittent attenuation may even be interictal or ictal, such as with tonic seizures that classically involve a sudden diffuse attenuation with overriding fast activity.
Discontinuity describes intermittent periods of significant attenuation or, if the tracing goes essentially flat rather than just attenuated, suppression. Outside of the neonatal stage of life this is always highly abnormal and a marker of severe diffuse slowing and brain dysfunction. You may see it in comatose patients and those with severe brain injury; in cases of refractory status epilepticus unresponsive to multiple antiseizure drugs and infusions, high levels of sedation are used to suppress the brain to an intentional discontinuity called burst suppression, which requires at least 50% of the record to be suppressed.
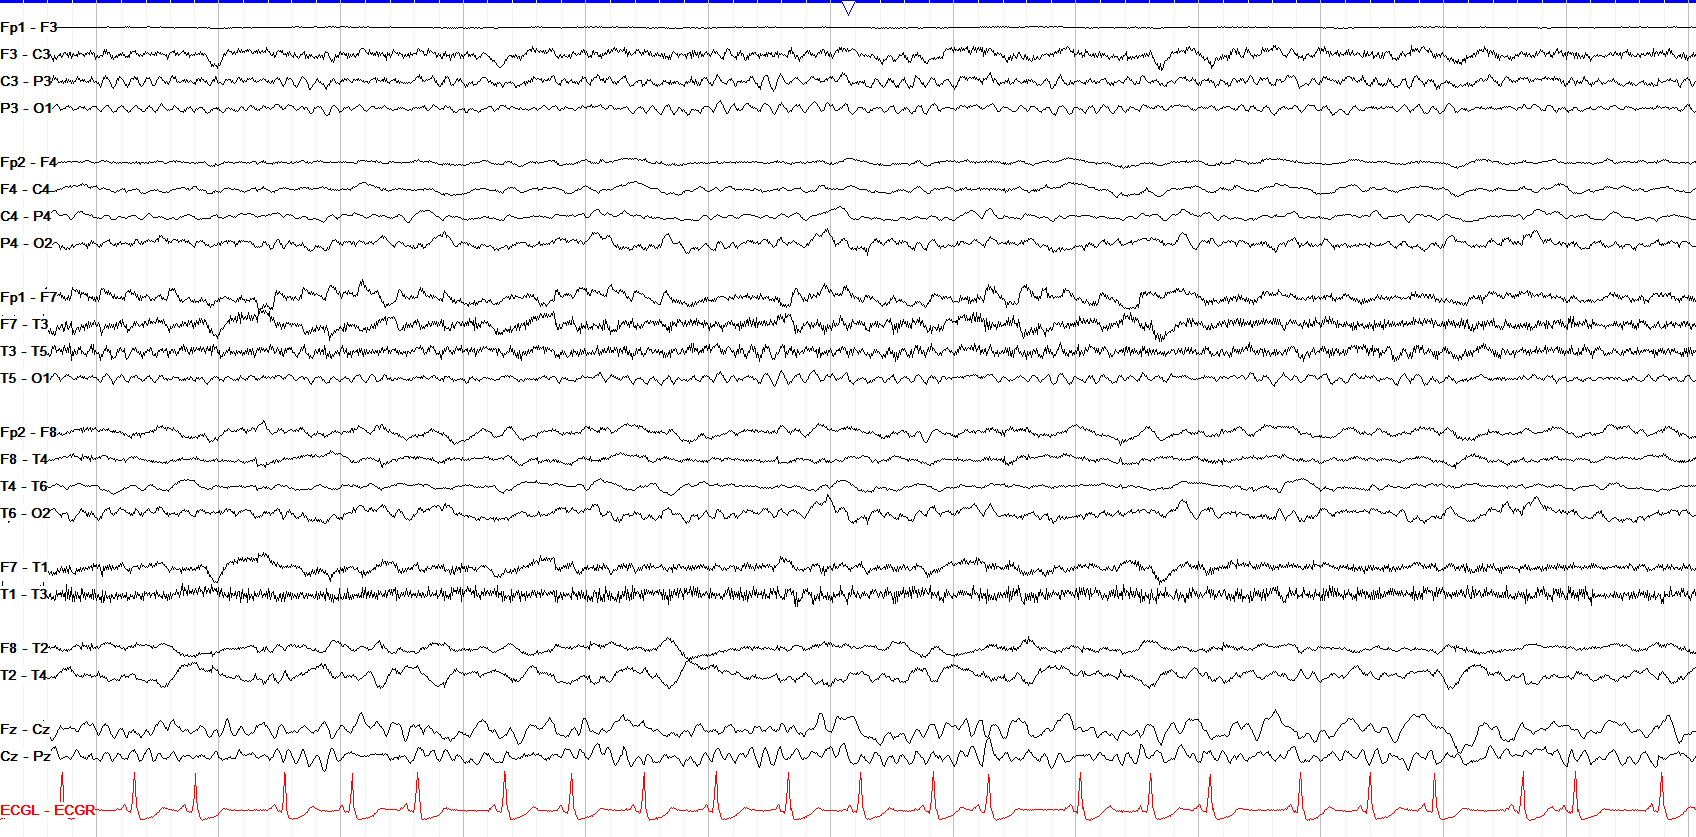
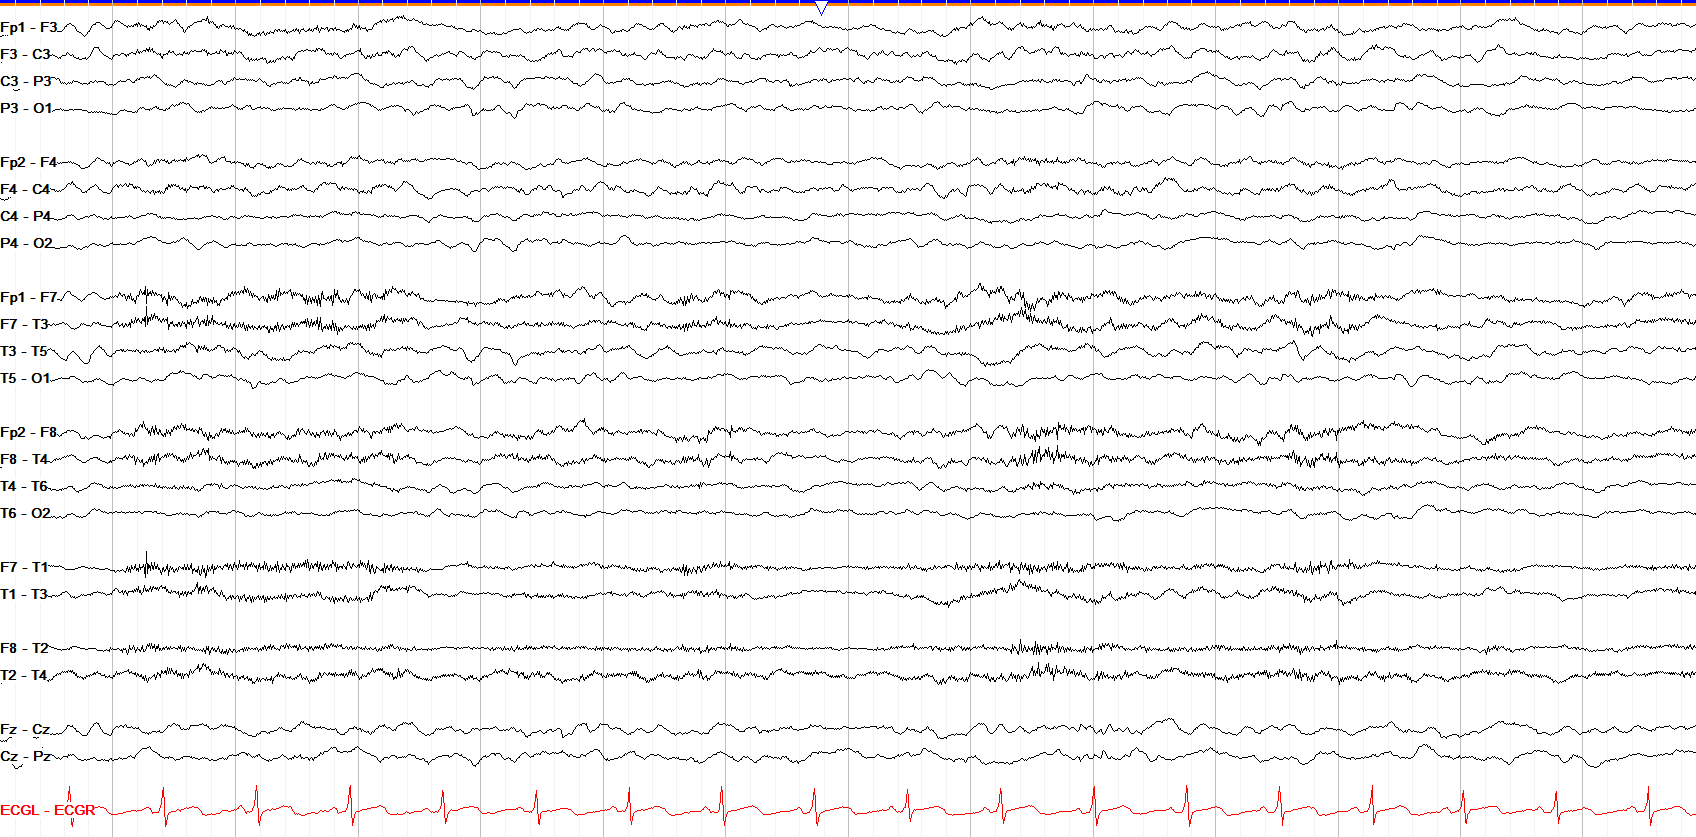
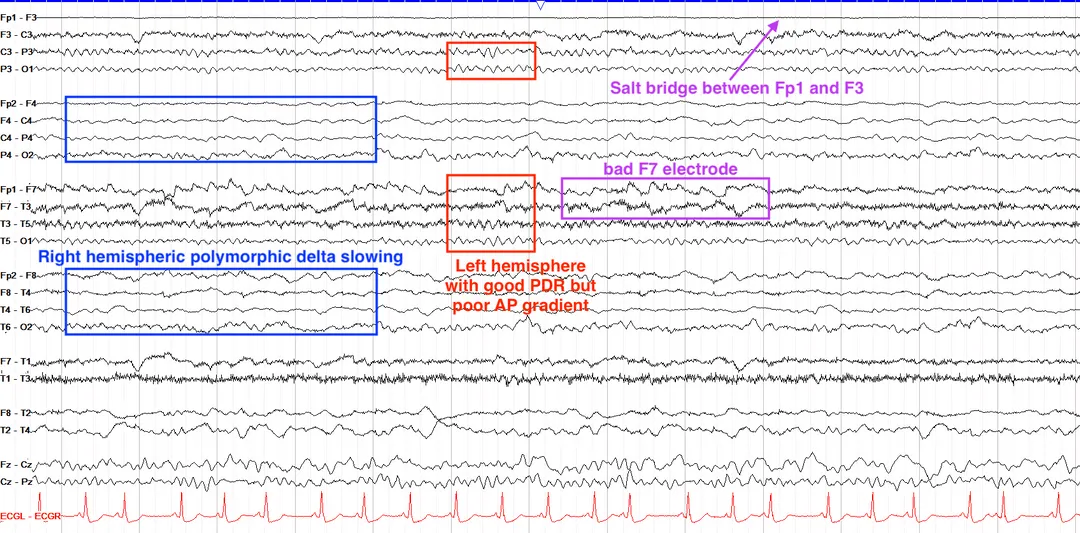
This is a somewhat complicated tracing so let’s look at one side at a time. First note that on the left side you have a PDR that trends between 8-8.5 Hz, which is just barely in the normal range, but the AP gradient on the left is somewhat inconsistent with excess slow activity in the frontal regions.
Moving to the right side, we see a persistent / continuous, somewhat low amplitude delta activity in the frontal regions, and fragments of a PDR in the occipital leads. There is even less of an AP gradient and normal morphology than on the left side. As such, this tracing shows persistent right hemispheric polymorphic delta slowing on a background of mild generalized slowing.
Excess Beta
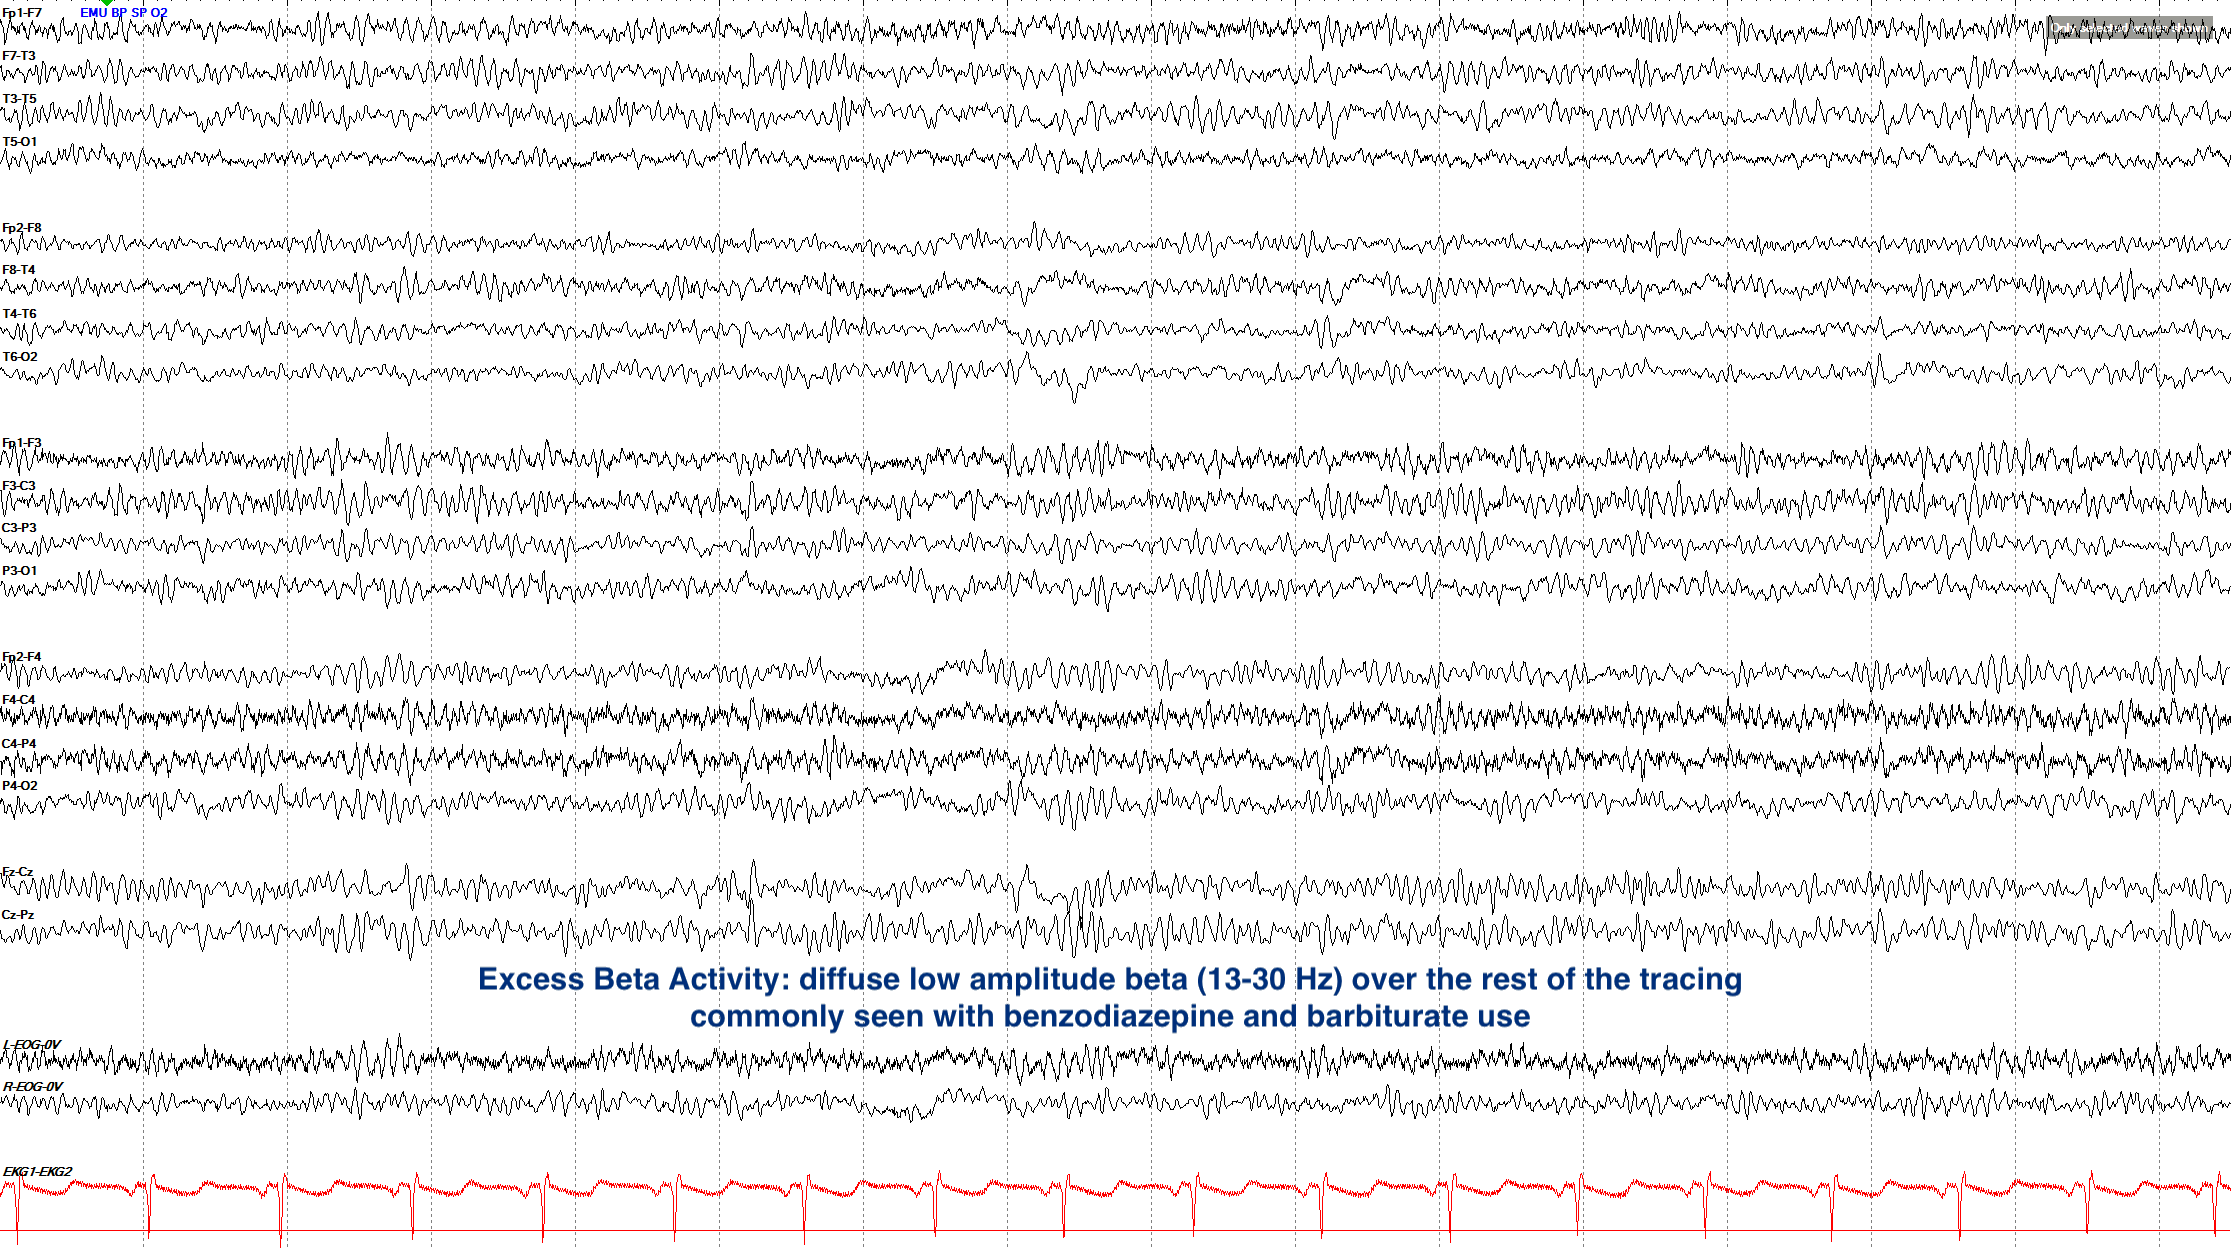
Excess beta activity, when diffuse or frontally predominant, is a commonly seen phenomenon most often arising as a medication effect in the setting of benzodiazepine or barbiturate use. It is marked, as expected, by low amplitude beta overriding the normal activity throughout the tracing. It can also be seen with anxiety and, somewhat counterintuitively, with drowsiness. While excess beta is an abnormality, it is essentially a benign one.
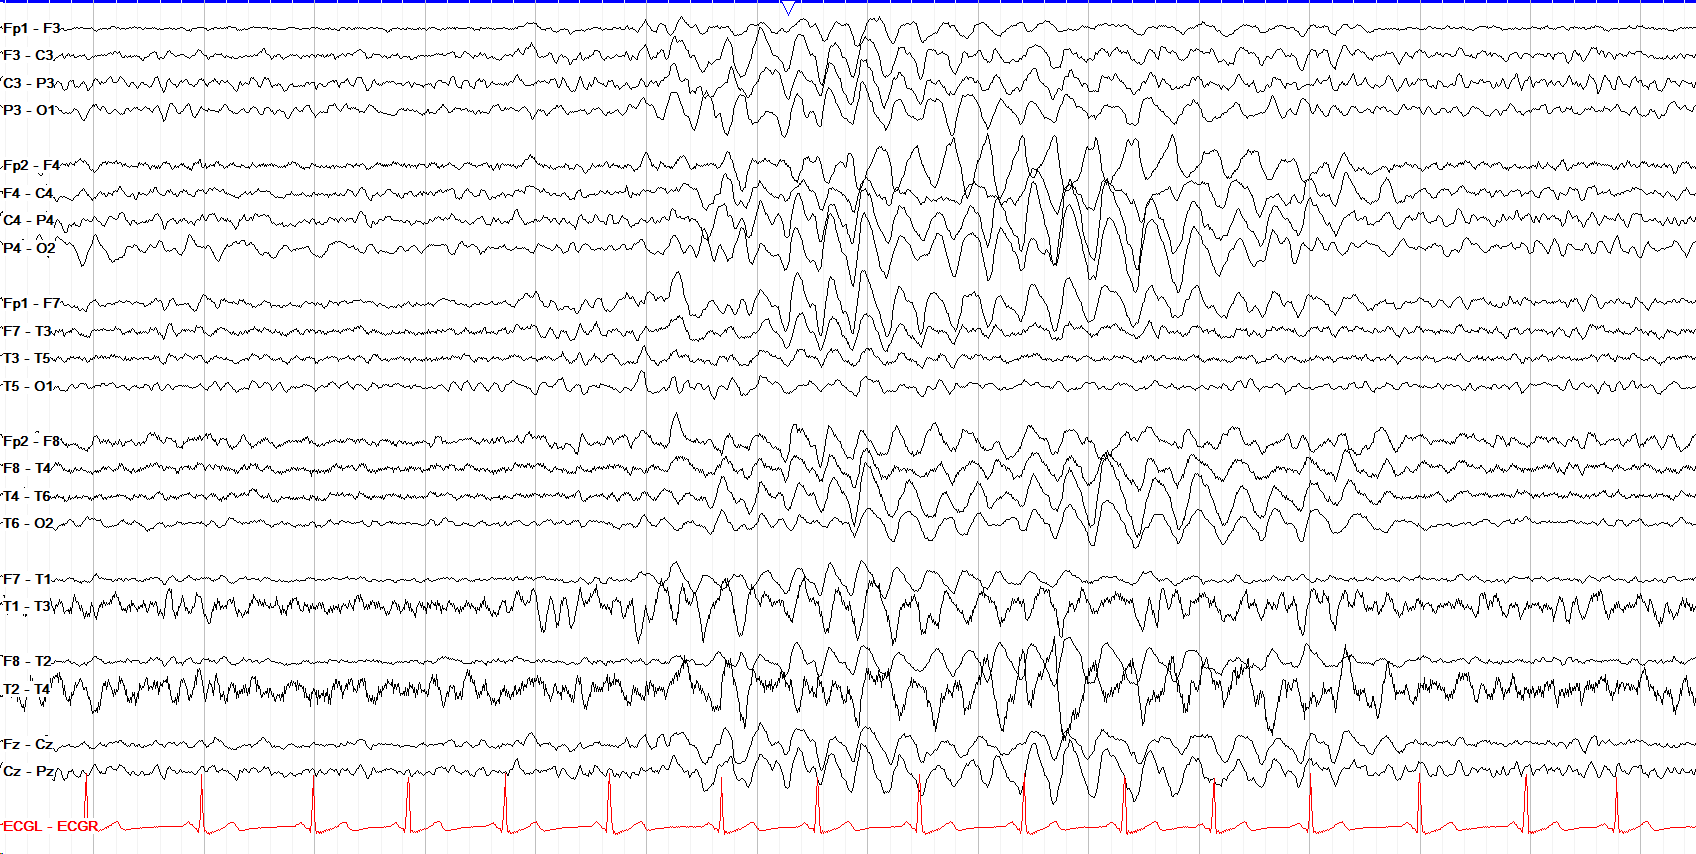
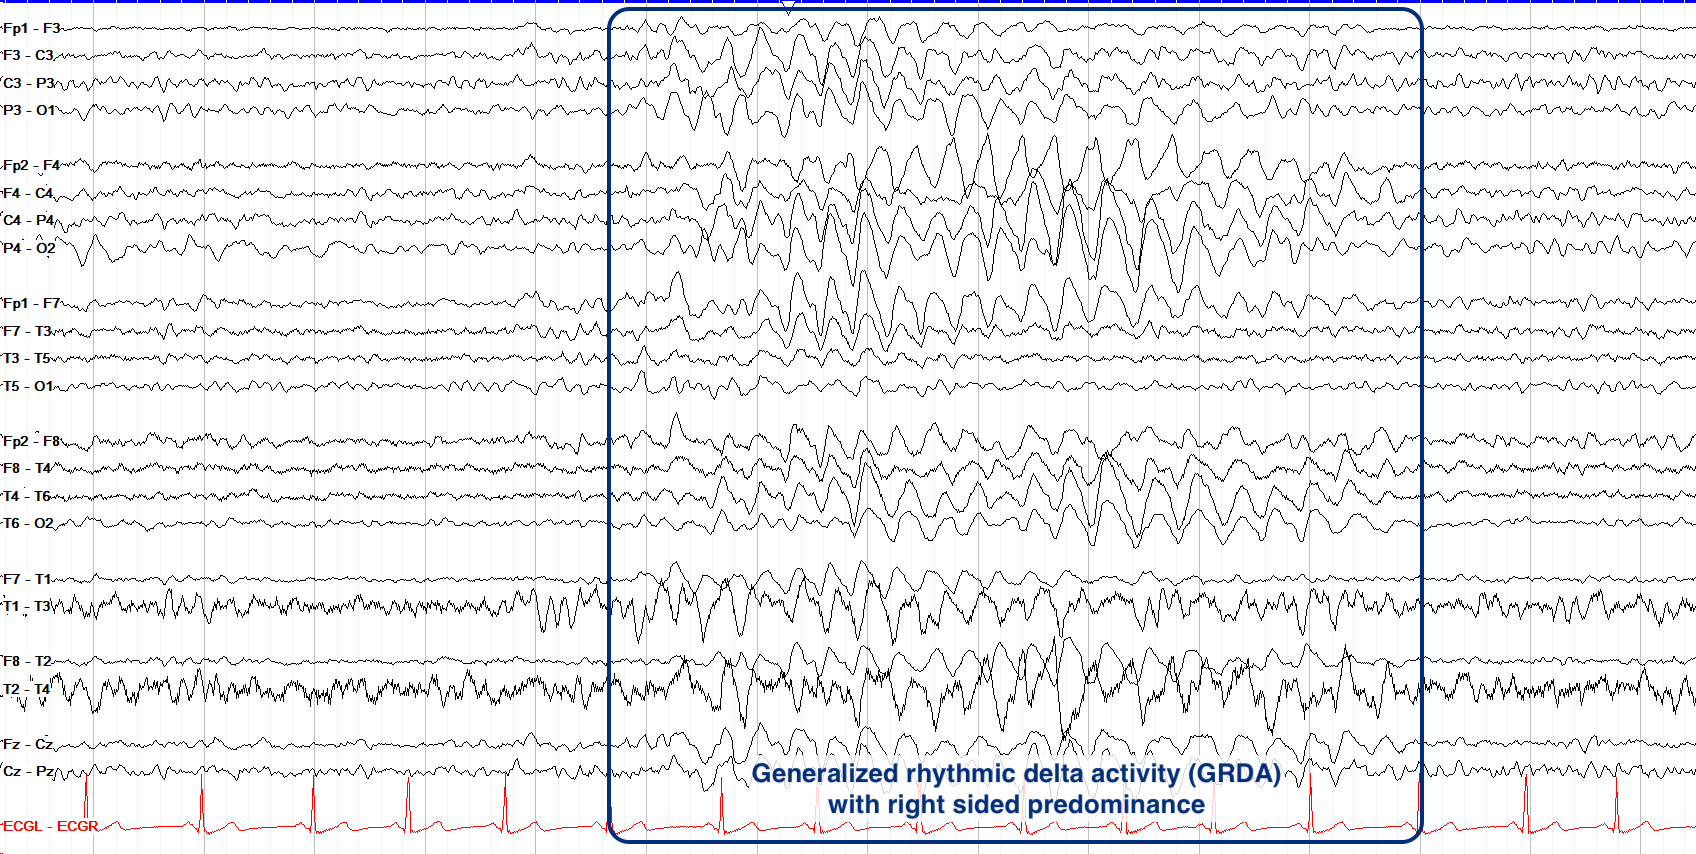
This tracing shows a burst of generalized high amplitude delta activity at about 3Hz, lasting several seconds and thus meeting the ACNS criteria for rhythmicity (i.e. having at least 6 repeating cycles). The delta activity is generalized but more prominent on the right side, particularly in the temporal chains. This is thus consistent with generalized rhythmic delta activity (GRDA) with right-sided predominance, suggestive of nonspecific and diffuse cerebral dysfunction.
Triphasic Waves
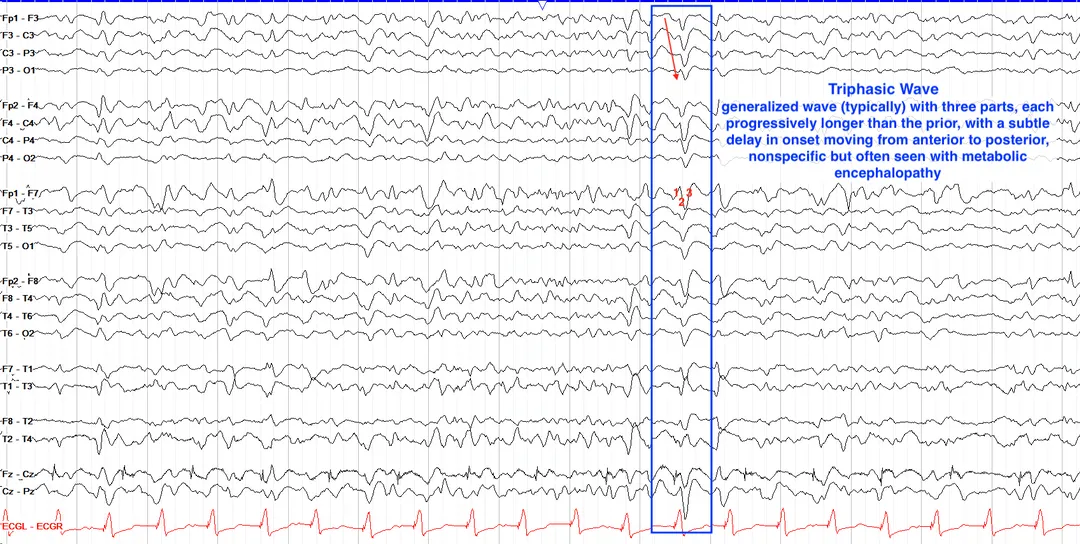
Triphasic waves are a nonspecific waveform most classically associated with metabolic (historically, hepatic) encephalopathy. Their name is descriptive, as they are comprised of three parts, with each part being slightly longer than the preceding one. They are most often generalized, with a subtle delay in the onset of each as you move from the anterior to posterior regions.
Sometimes, triphasics can be periodic, particularly in critically ill patients. In the example below there are several on the page, but the most well formed one is marked; note that this page also shows moderate generalized slowing.
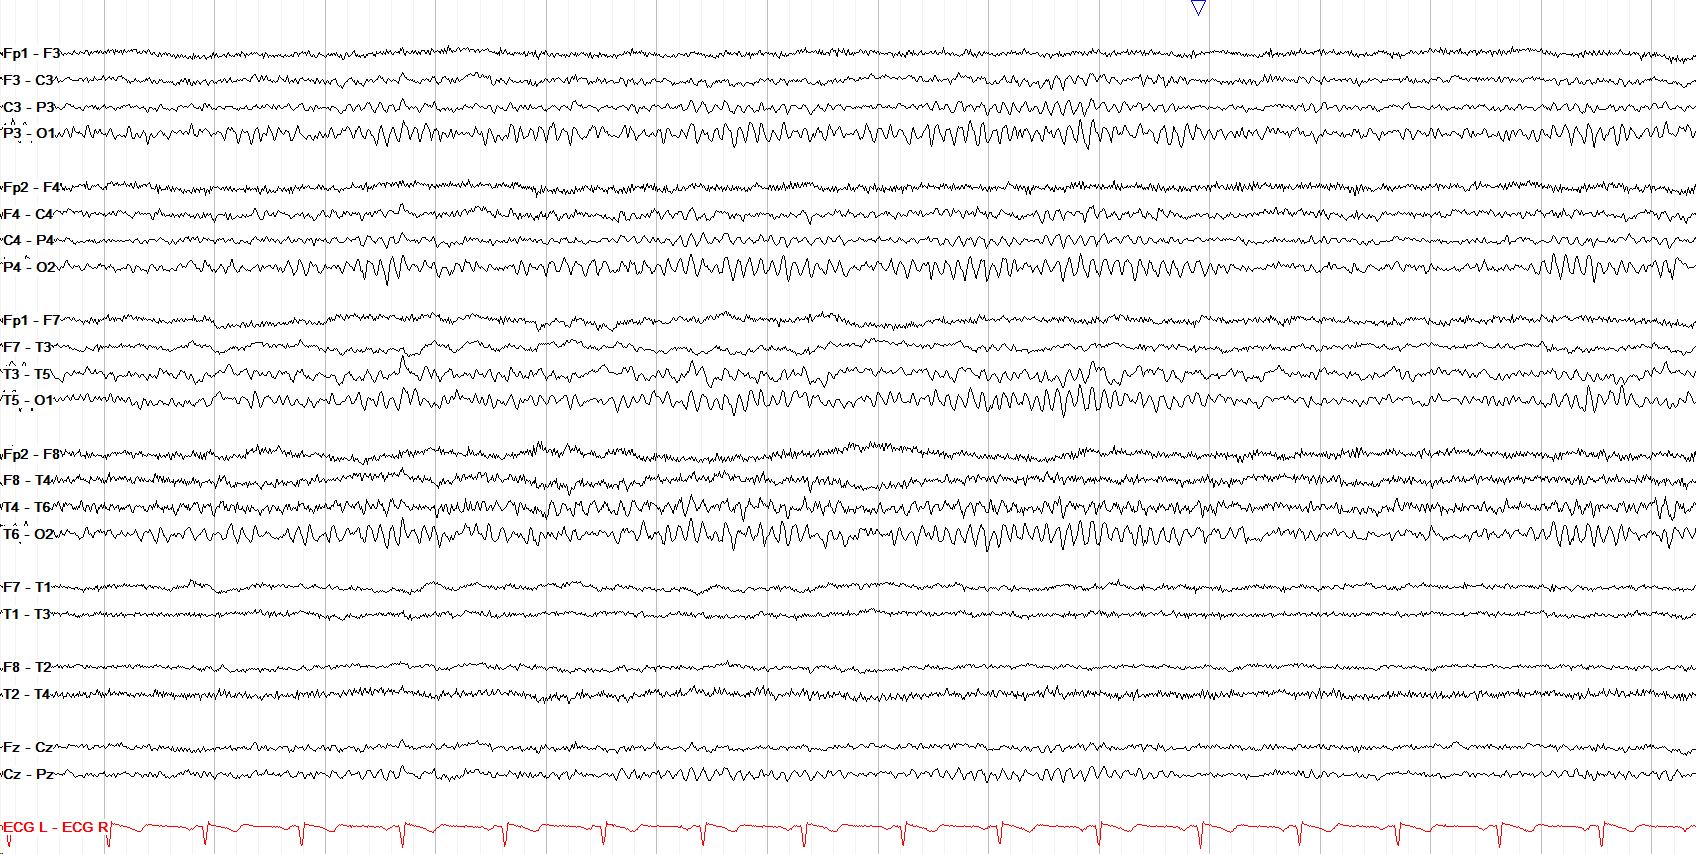
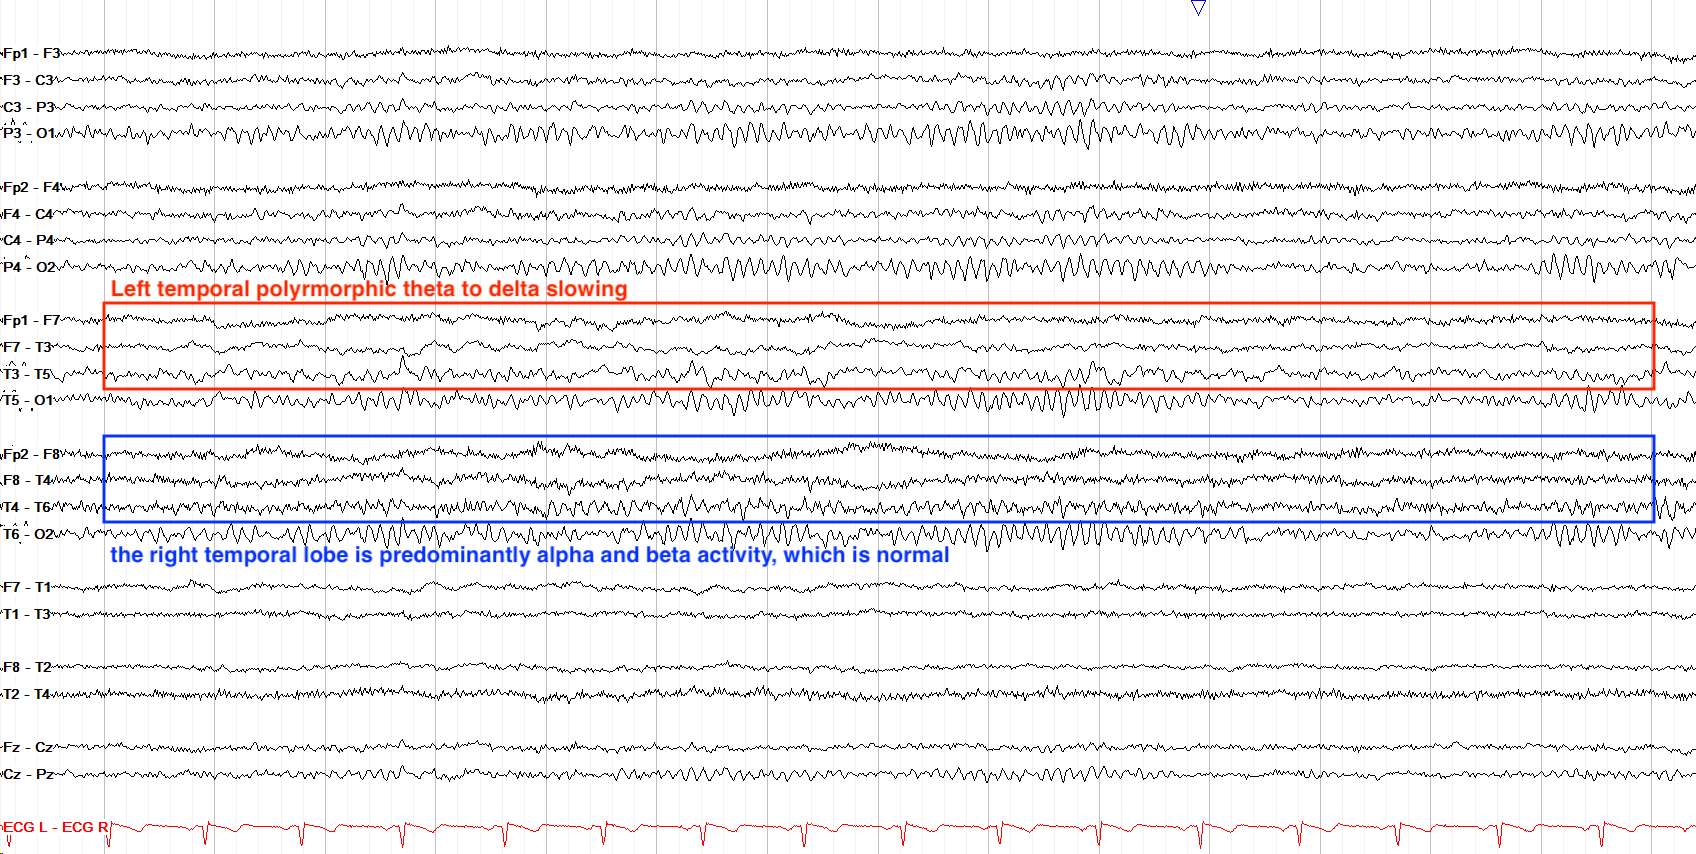
Here we see a good PDR throughout of 10 Hz, but note while the right temporal region is alpha and beta activity, the left temporal region has a kind of “sloppier” appearance with admixed slower frequencies from theta and delta. In a normal awake adult, you should basically never see theta or delta activity. The slowing here is not rhythmic and seems to run across the entire page, so we’d classify it as focal left temporal persistent polymorphic theta to delta slowing.
- Slowing on EEG is a nonspecific finding indicating underlying cerebral dysfunction, and can be generalized or focal, continuous or intermittent, polymorphic or rhythmic.
- Mild generalized slowing shows a slowed PDR and poor AP gradient with preserved reactivity, while moderate slowing has a fragmented/absent PDR with predominantly theta-delta activity, and severe slowing is highly disorganized and often discontinuous.
- Focal slowing suggests structural pathology, with continuous slowing more concerning than intermittent, and polymorphic slowing nonspecific while monomorphic slowing may suggest epileptiform activity.
- Breach activity is higher-amplitude, spiky/sharply-contoured activity over a region of prior skull defect; it is benign but must not be mistaken for the epileptiform discharges that can be embedded within it.
- Attenuation and discontinuity (EEG suppression) are abnormal outside the neonatal period, with regional patterns suggesting focal pathology and burst suppression indicating severe encephalopathy.
- Excess beta activity can indicate medication effects (benzodiazepines, barbiturates) or pathologic encephalopathy, with diffuse arrhythmic beta more suggestive of drugs and focal rhythmic beta more concerning for pathology.
- Triphasic waves (1-3 Hz polymorphic three-phase waveforms, maximal frontally) indicate encephalopathy from various causes and represent significant brain dysfunction.
- Always correlate EEG findings with clinical history, as many nonepileptiform abnormalities are nonspecific and require clinical context for proper interpretation.