Reading the Background
When reading any EEG you start with the background, which reflects the overall health of a person's brain and can be affected by many factors including acute illness, medications, degenerative disease and normal state changes. There are four background components:
- Organization & AP Gradient
- Posterior Dominant Rhythm
- Variability & Reactivity
- State of Consciousness
Organization & AP Gradient
The organization of an EEG tracing refers, broadly, to how the waveforms appear across the entirety of the page, and includes continuity, symmetry, and the anterior posterior gradient.
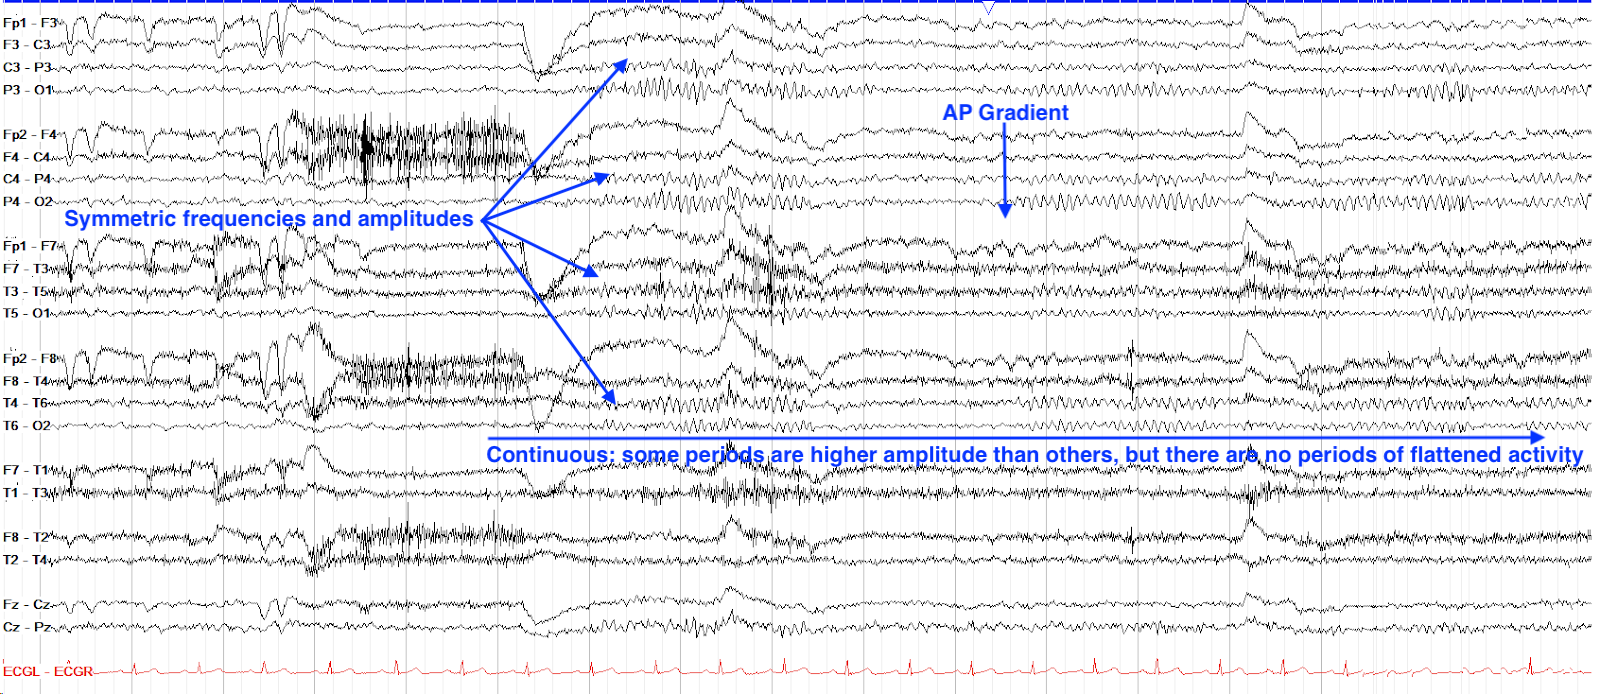
Continuity refers to the waveforms being uninterrupted by periods of flat or very attenuated activity. Healthy children and adults should always have a continuous record, but early neonatal tracings can show periods of discontinuity (this is discussed further in the neonatal and pediatric section). Below are examples of both a continuous and discontinuous record.
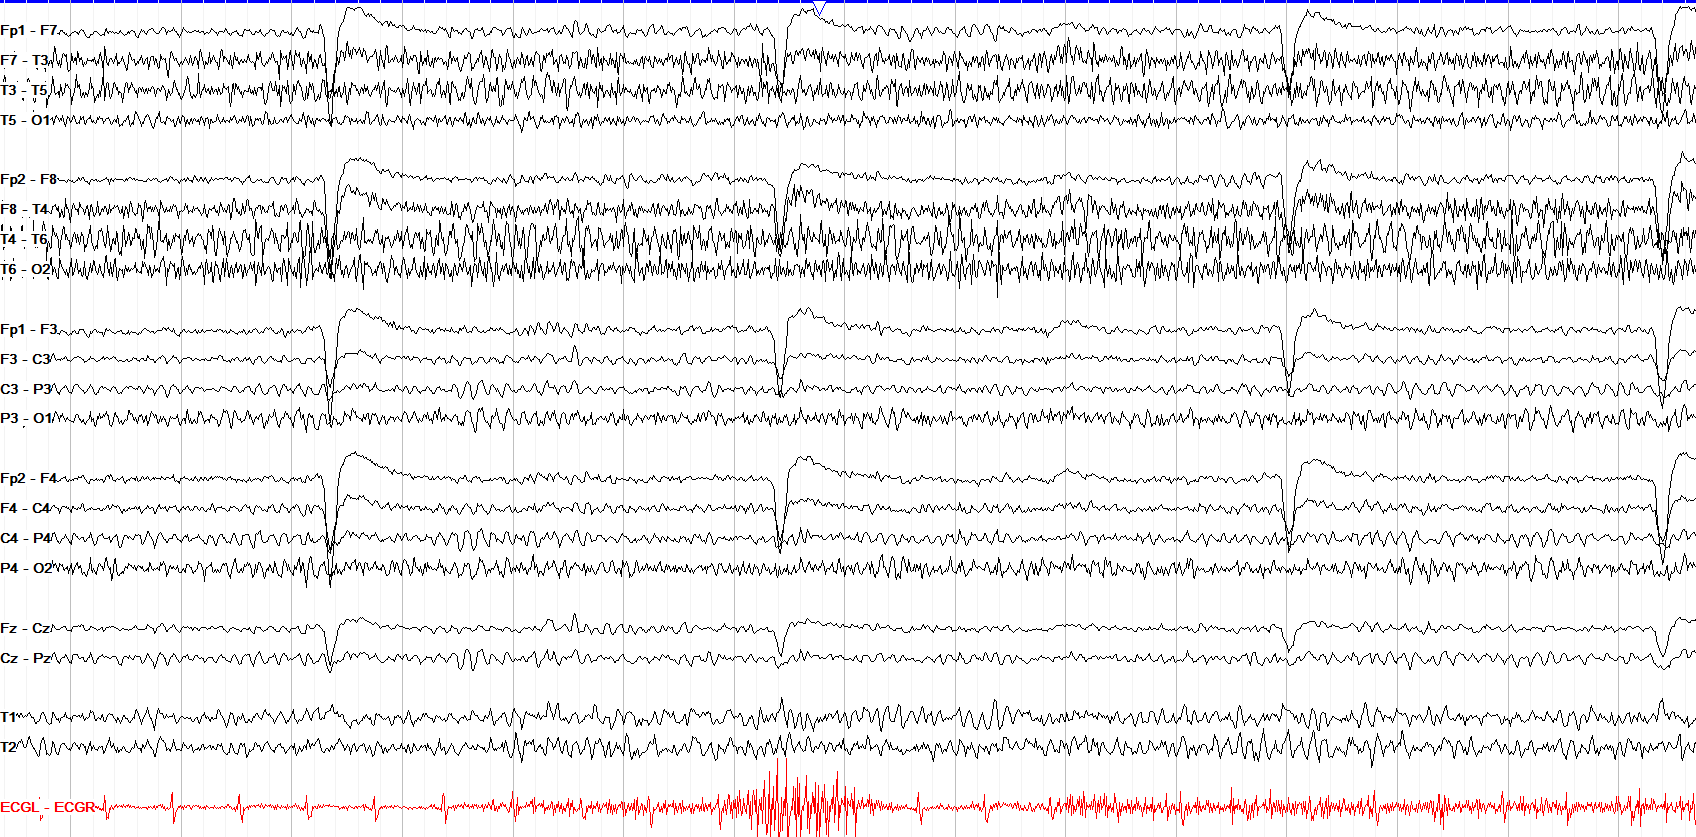
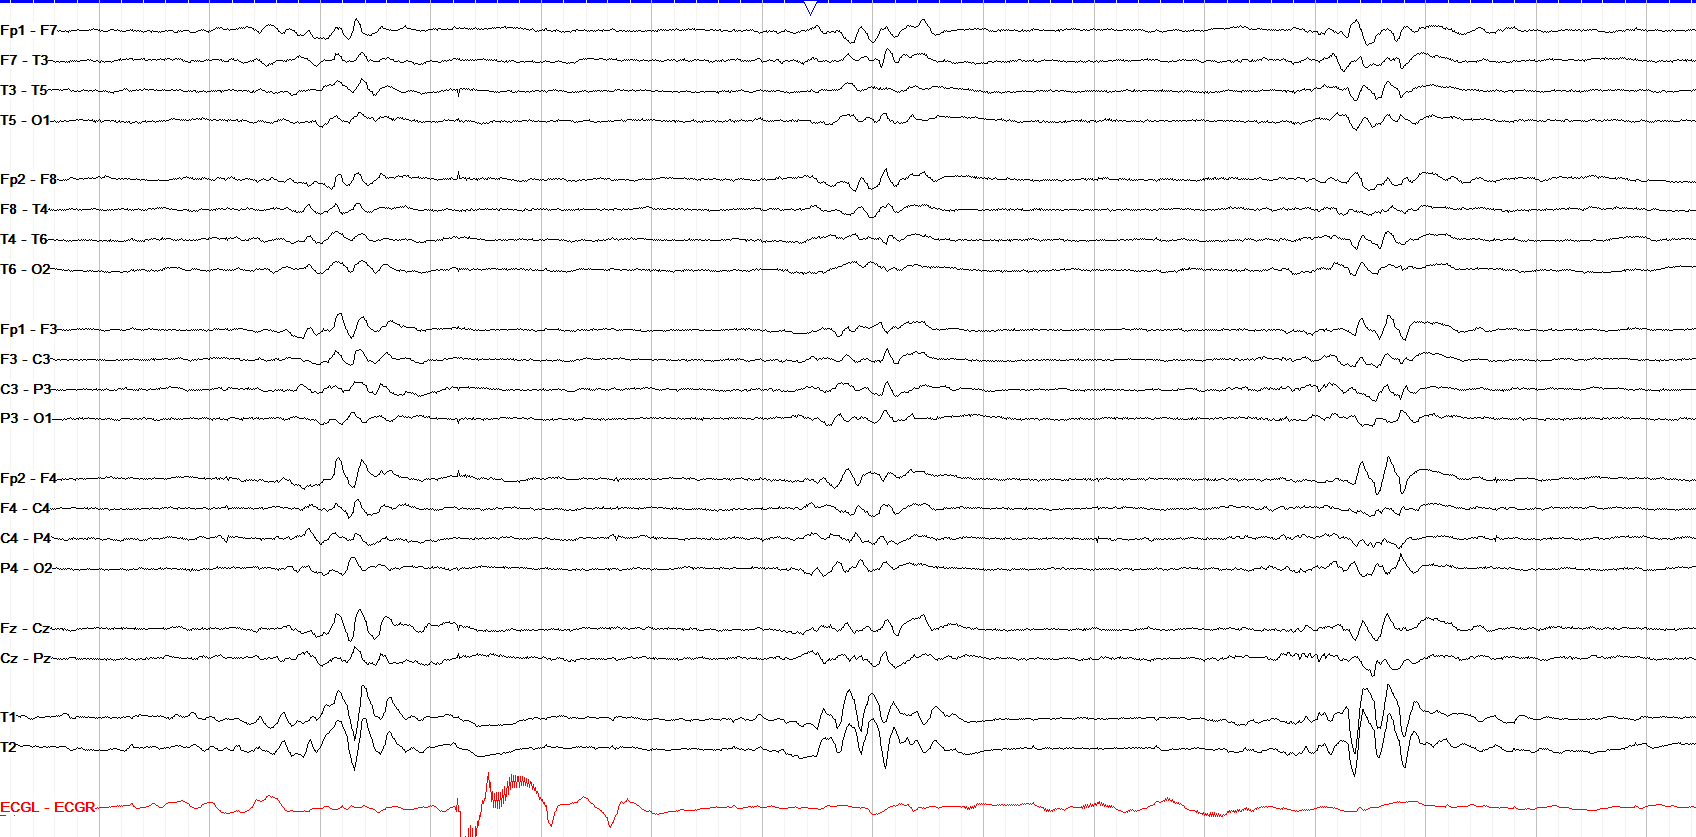
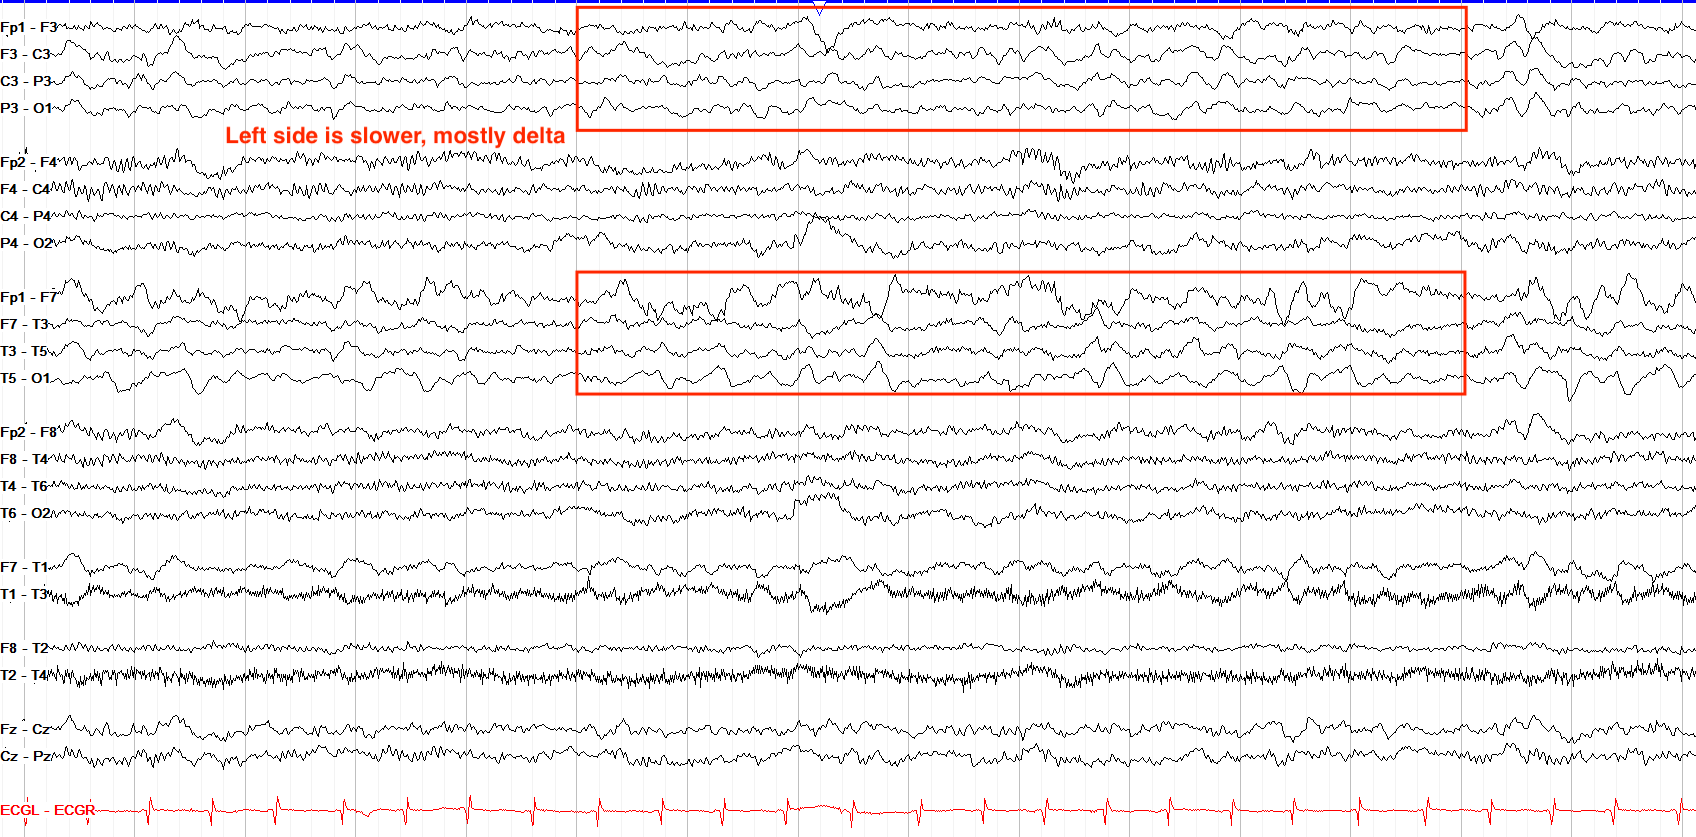
The next component of organization is symmetry, in which both the left and right sides appear, largely, the same in terms of both amplitude and frequency. Healthy EEGs should always be symmetric, and intermittent or persistent asymmetries can arise from structural entities such as tumors or bleeds. Changes in symmetry can be subtle, but note how, on the asymmetric example below, the left hemisphere has higher amplitude and slower delta activity compared to the right side.
In addition to symmetry and continuity, consider the anterior posterior gradient, in which faster, lower amplitude frequencies are present towards the front of the brain while slower, higher amplitude frequencies are found in the back of the brain. The AP gradient leads into the last component of organization, the posterior dominant rhythm (PDR), discussed in the next section.
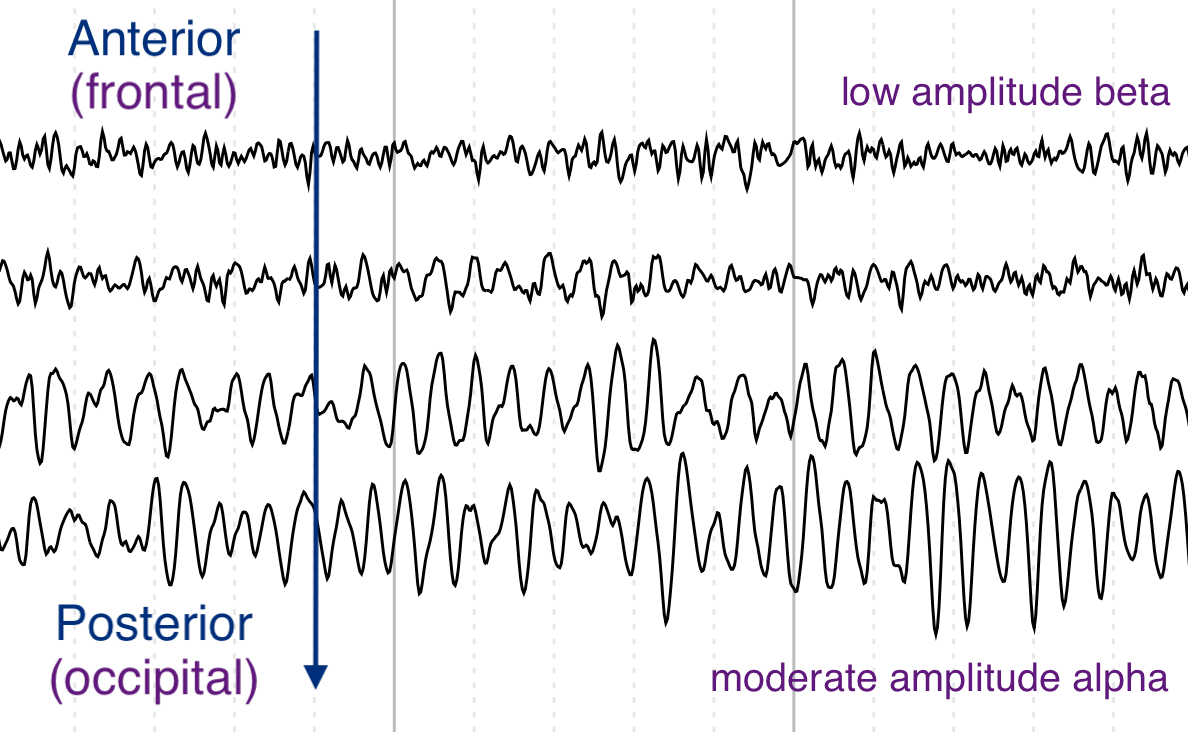
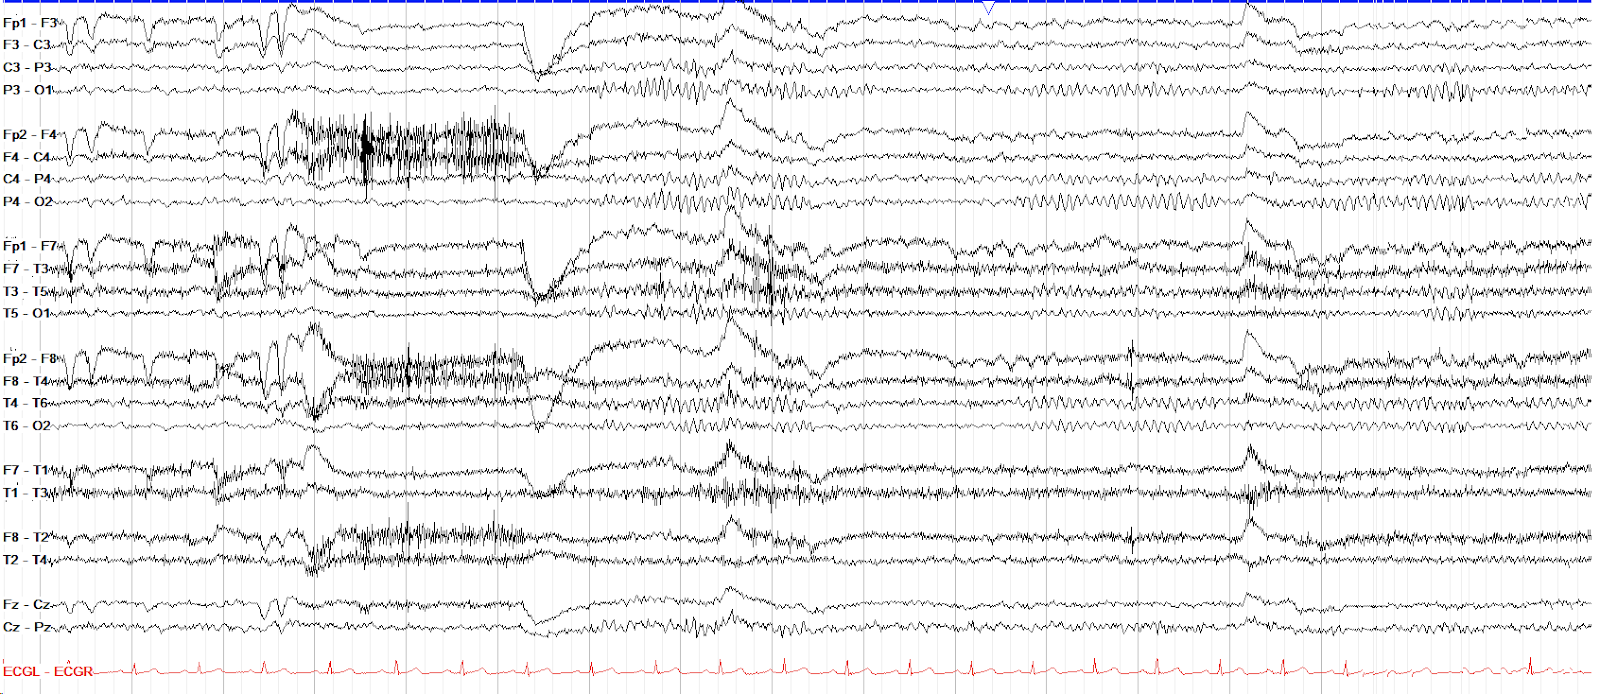
This tracing shows all the components of good organization: symmetry in frequency and amplitude, continuity across the page, and a good anterior to posterior gradient with faster beta frequencies up front and slower alpha in the back.
Posterior Dominant Rhythm
The posterior dominant rhythm (PDR) is the resting frequency of the occipital region when eyes are closed and one is resting quietly. It is a vital part of a normal EEG and among the first things you should look for; the PDR used to be called the alpha rhythm because the normal PDR (8.5-12 Hz ) is in the alpha range (8-13 Hz).
The PDR should be symmetric in both frequency and amplitude; if there is a more than 50% difference in amplitude or a more than 1 Hz difference in frequency between sides, this is abnormal. Of note, it can be normal for the PDR on the left to be slightly attenuated compared to the right, thought to reflect a thicker skull on the left side in most people.
To determine the PDR, wait till the eyes are closed and then count the number of waves per second in the occipital region. It is helpful to check at more than one timeframe, as the PDR can fluctuate mildly and you want to give a patient their best seen PDR (notably, up to 5% of the normal population have no PDR at all).
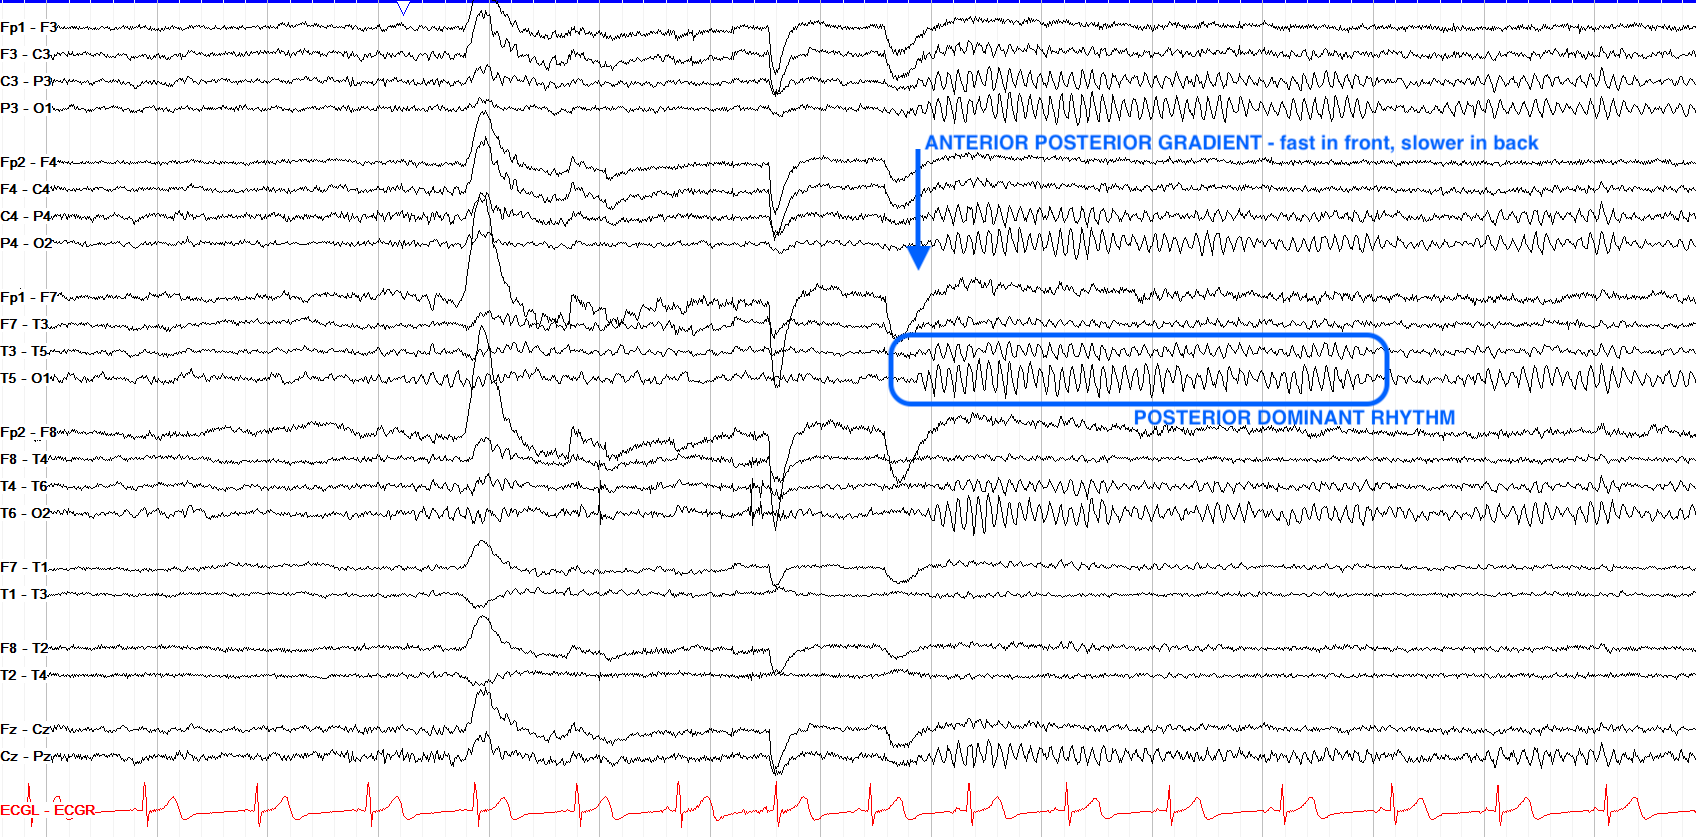
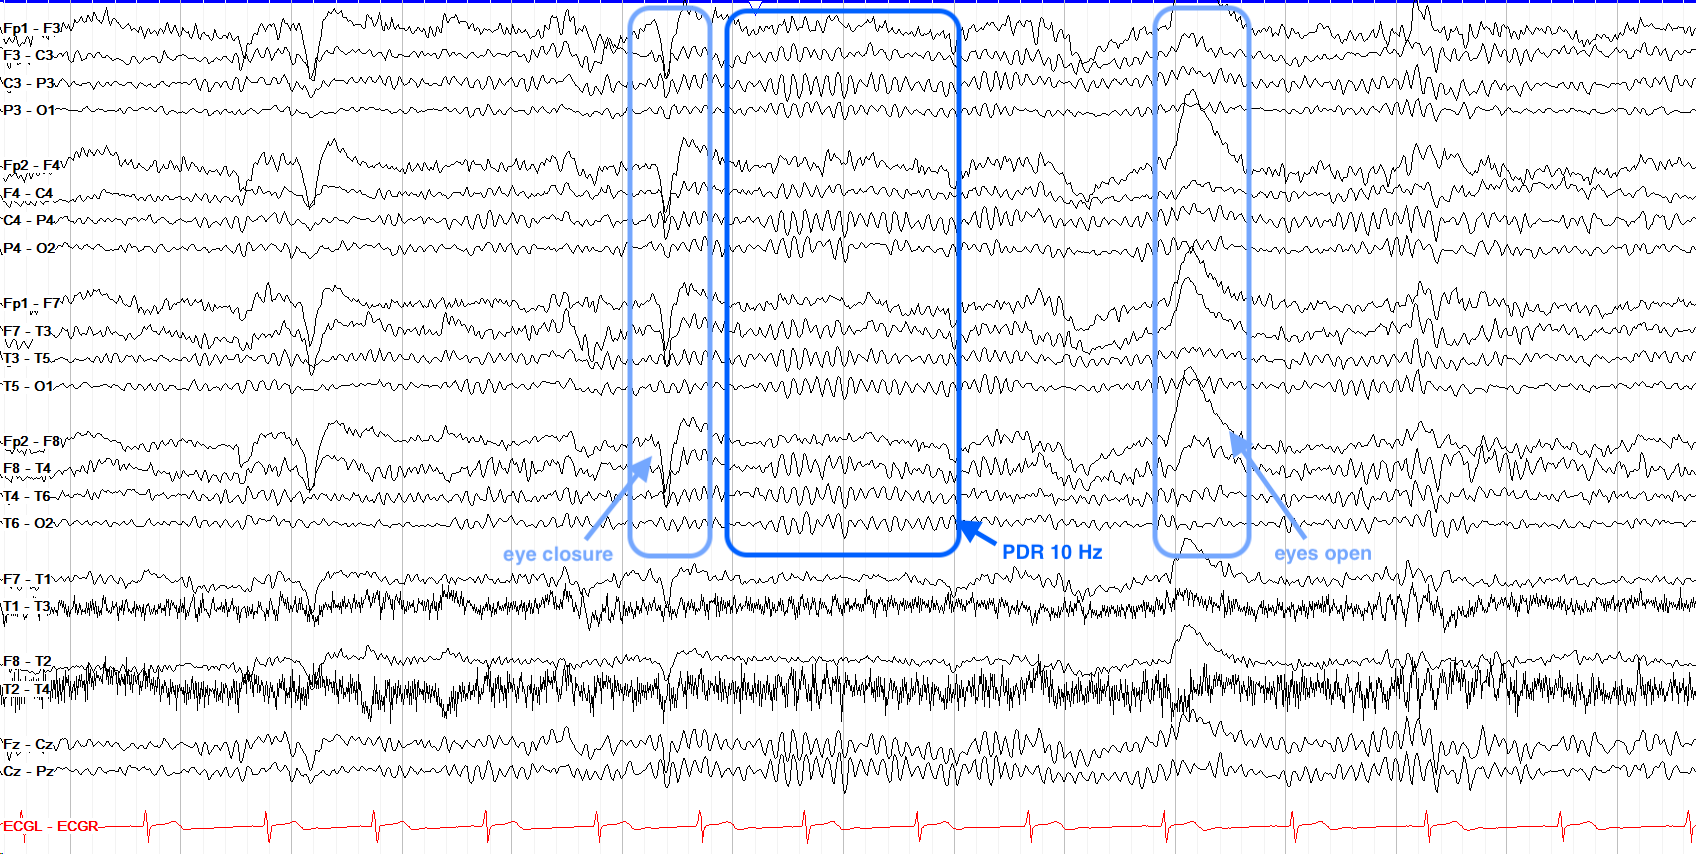
In the image above, see that the PDR emerges right after the patient closes their eyes (the eye closure is seen as the large positive wave right before the blue box, further discussed in the Artifact section). In adults, the normal PDR should be between 8.5 and 12 Hz and symmetric, but in children a normal PDR depends on the age, as discussed in the Pediatric EEG section. When the PDR is slower than 8.5 Hz, there may be generalized slowing present, as discussed in the Abnormal EEG section, though in older individuals the normal range is sometimes slightly extended to 8-12 Hz.
When determining the PDR, be careful of two things in particular: alpha squeak and drowsiness. Alpha squeak describes a transient quickening of the PDR immediately after eye closure, and is so named because when EEG was still traced out on paper, the pen would briefly squeak from moving so quickly. If you choose a PDR based on an area of alpha squeak you'll think it is faster than it actually is. On the other hand, if you choose the PDR when a patient is very drowsy or entering stage I sleep, even though it may be more apparent than when they're more awake, it might look a little slower.
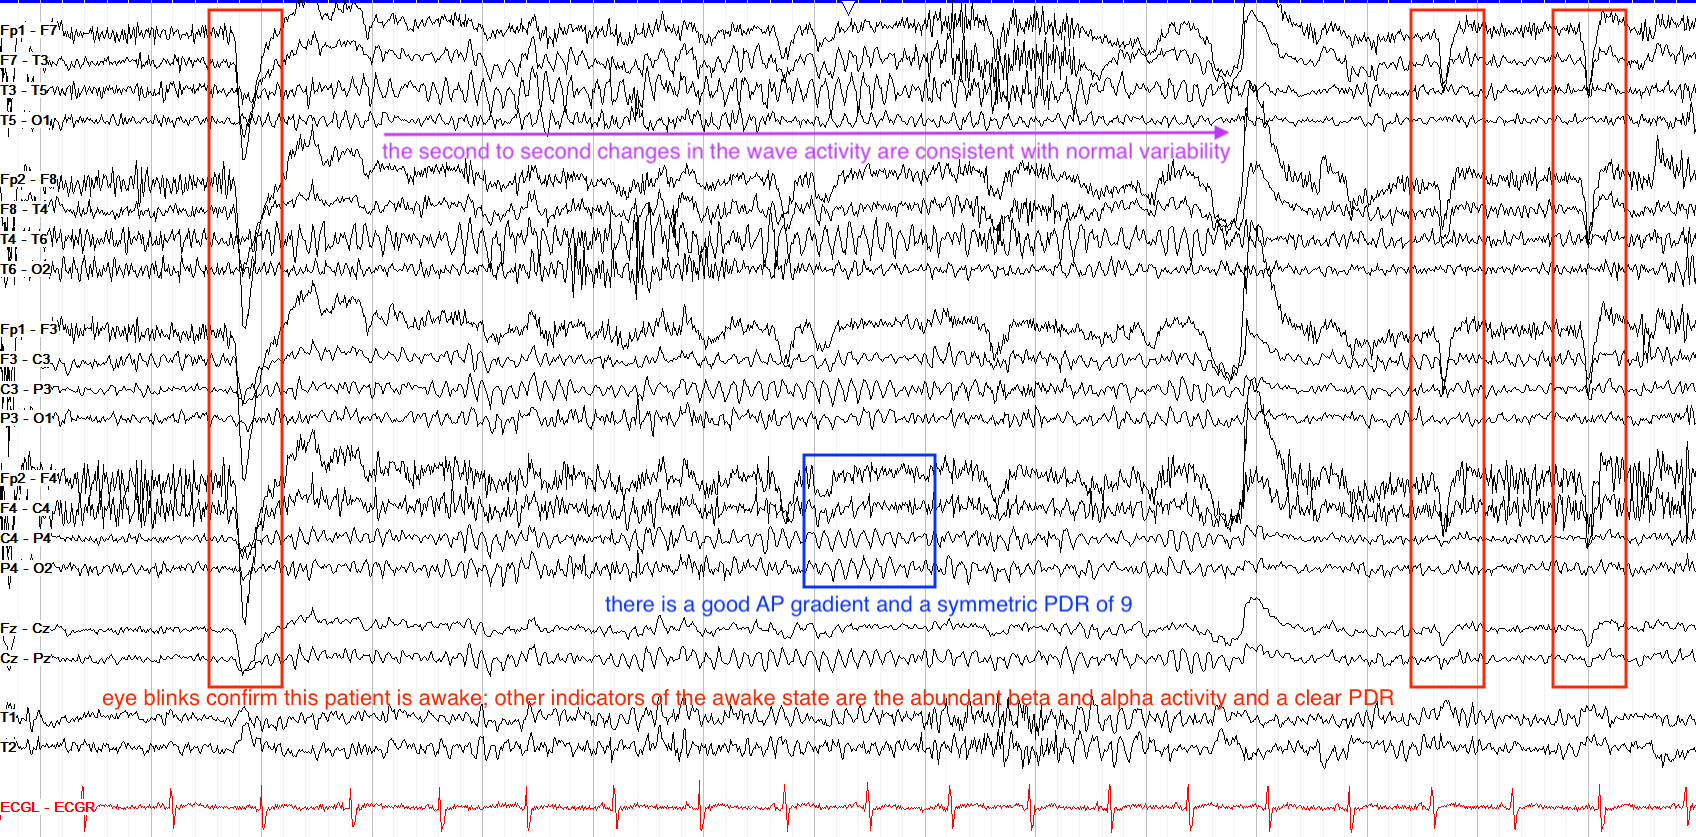
In this normal EEG tracing, we see the anterior-posterior gradient is intact and normal, with faster, lower amplitude beta frequencies seen over the frontal regions and slightly slower, higher amplitude alpha frequencies seen over the posterior regions. Furthermore, the PDR, best seen after the eye closure (the large frontal positive wave right before the blue box, due to Bell's Phenomenon), is a crisp and symmetric 10 Hz. Notice how the PDR recedes upon eye opening (the large frontal negative wave) several seconds later, as expected.
Variability & Reactivity
Another facet of a normal awake EEG is the presence of variability and reactivity. Variability refers to the presence of shifts in the waveforms across the span of a tracing. A normal brain should have regular fluctuations in the waveforms from second to second. Reactivity is simply the presence of shifts in frequency according to external stimuli; for example, the tracing of a drowsy patient whose background is mostly theta may become again mixed with faster frequencies if they hear a noise or other stimulus.
In patients who are in altered states of consciousness, such as under sedation for hypothermia protocol or refractory status epilepticus, reactivity and variability may be temporarily absent or reduced; in brain dead patients, the tracing is neither reactive nor variable.
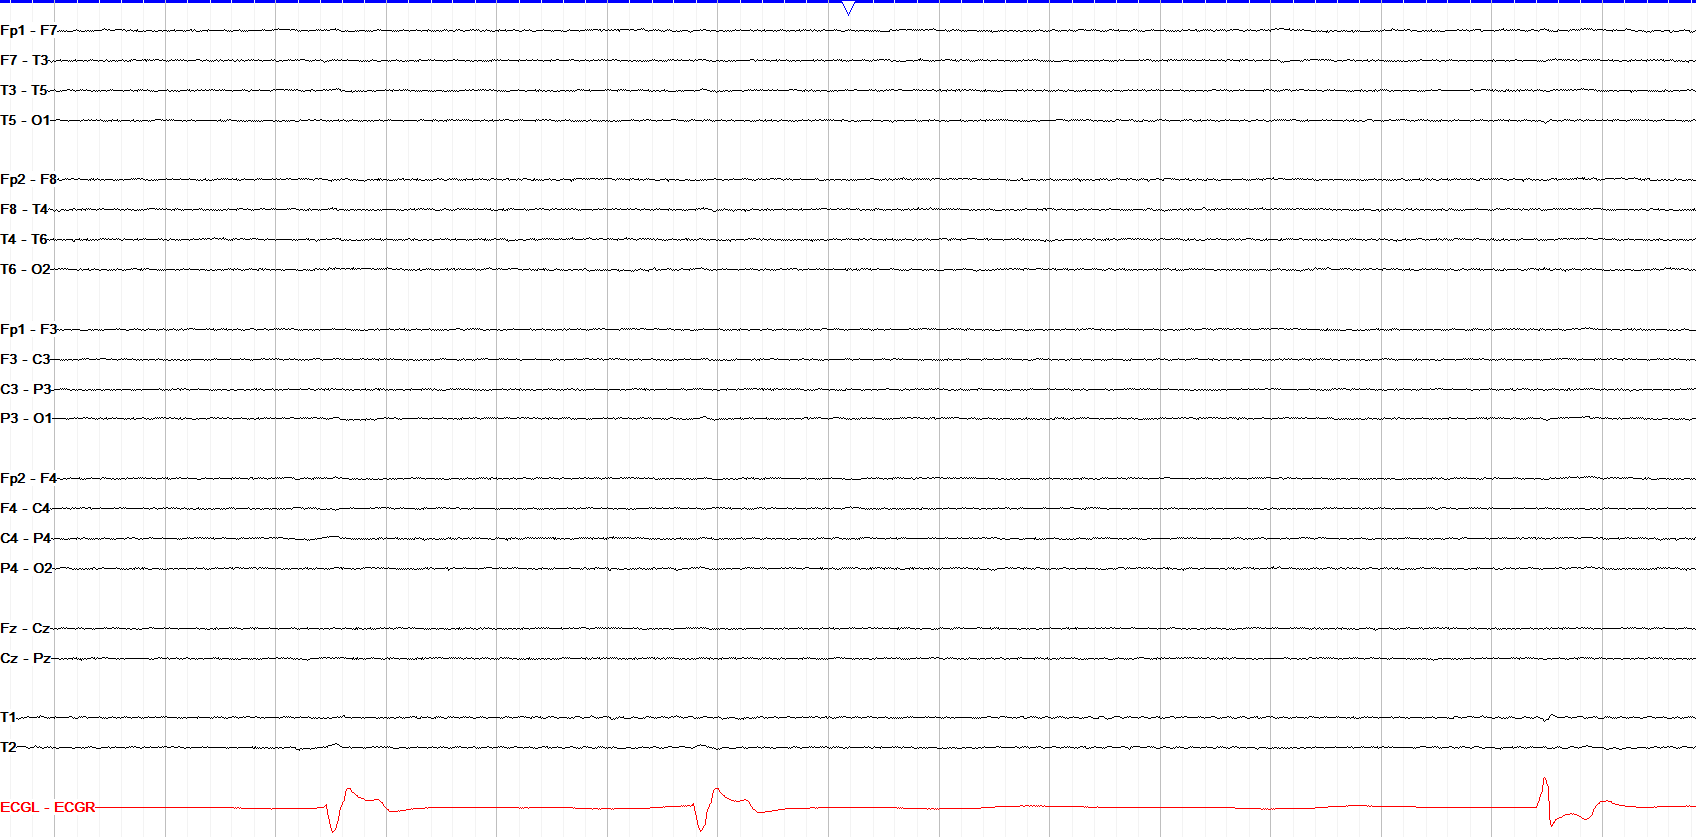
This is not a trick question, just an extreme example. This tracing of an unfortunately brain dead patient has no background activity or variability. Note the cardiac tracing does still have activity, but shows multiple abnormalities including profound bradycardia. Compare this flat EEG tracing to the other examples on this page to get a sense of how the EEG tracing should change second to second.
State of Consciousness
The last part of reading the background for a tracing is determining the patient's state, or whether they're awake, drowsy, or asleep. An awake adult EEG is marked by a plethora of findings including a symmetric PDR with predominant alpha and beta activity (there should be no delta activity in a healthy adult background), and the presence of many artifact types including eye blinks, movement artifact (usually seen as very high amplitude, chaotic appearing changes in the background), myogenic artifact (seen as high frequency, low amplitude activity usually maximal over the frontal regions, due to the forehead's movement), and even chewing artifact. These artifacts will be further discussed in the Artifacts section.
Drowsiness is seen as a mild and diffuse slowing with decreased frequency of eye blinks and roving eye movements, marked by very slow opposing undulations of the bilateral frontal regions. This arises because the corneas are positively charged, and when the eyes look to the right the F8 electrode sees the right cornea's positive charge while the F7 electrode sees a relatively negative charge. As the eyes move slowly back and forth when drowsy, this leads to the slow frontal oscillations that are classic for drowsiness, as seen below.
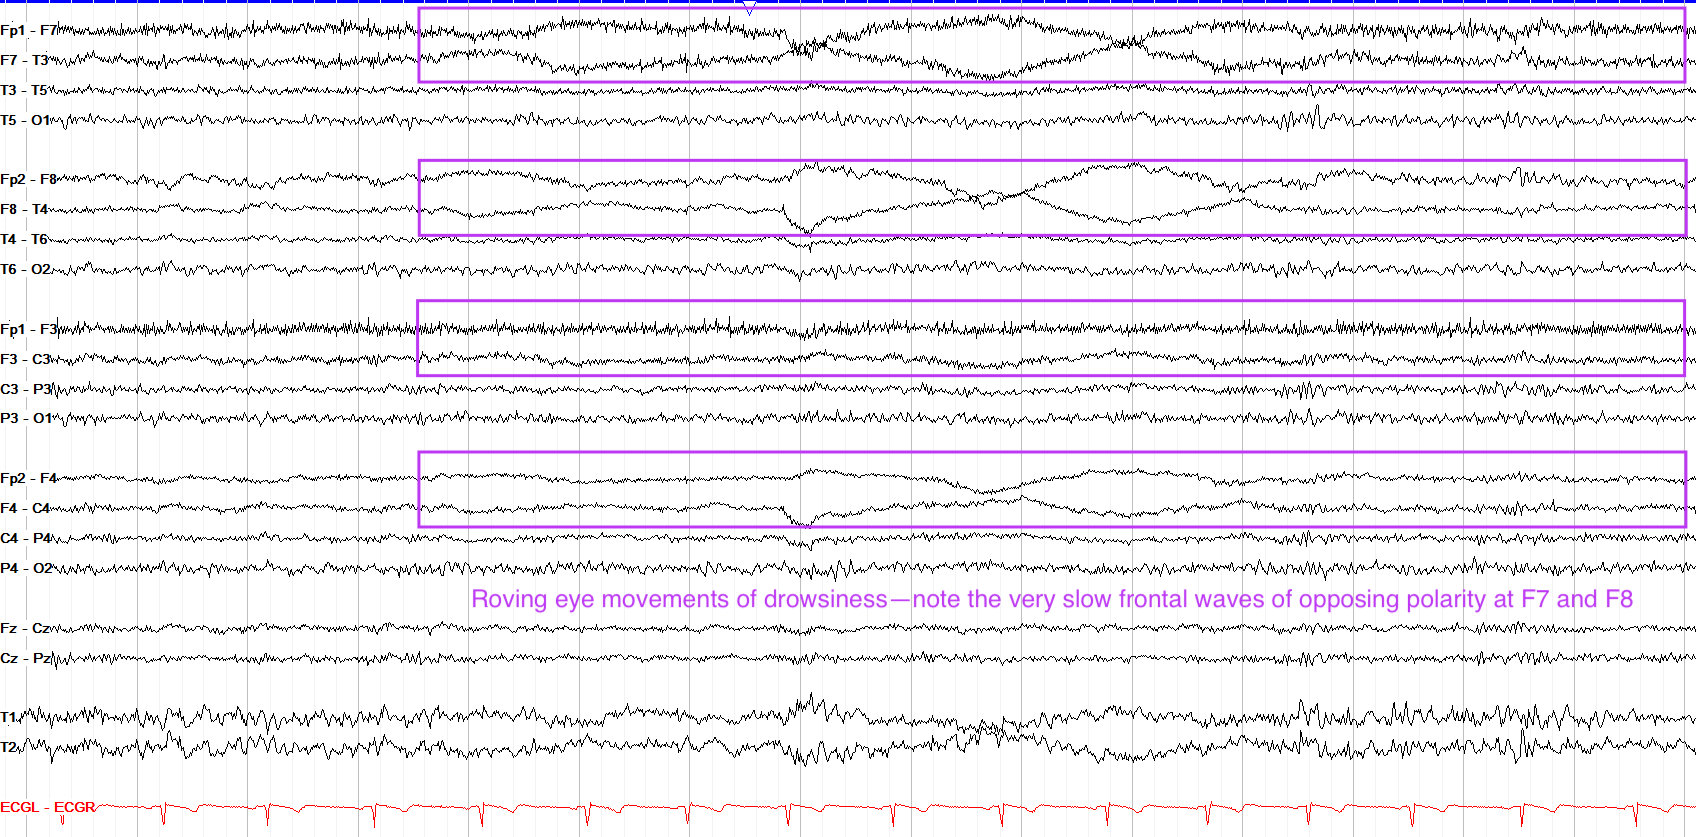
The transition from drowsiness to stage I sleep is subtle, and marked mostly by the emergence of POSTS (posterior occipital sharp transients of sleep) and vertex waves, but the asleep EEG is a topic all its own, and will be discussed in the next section.
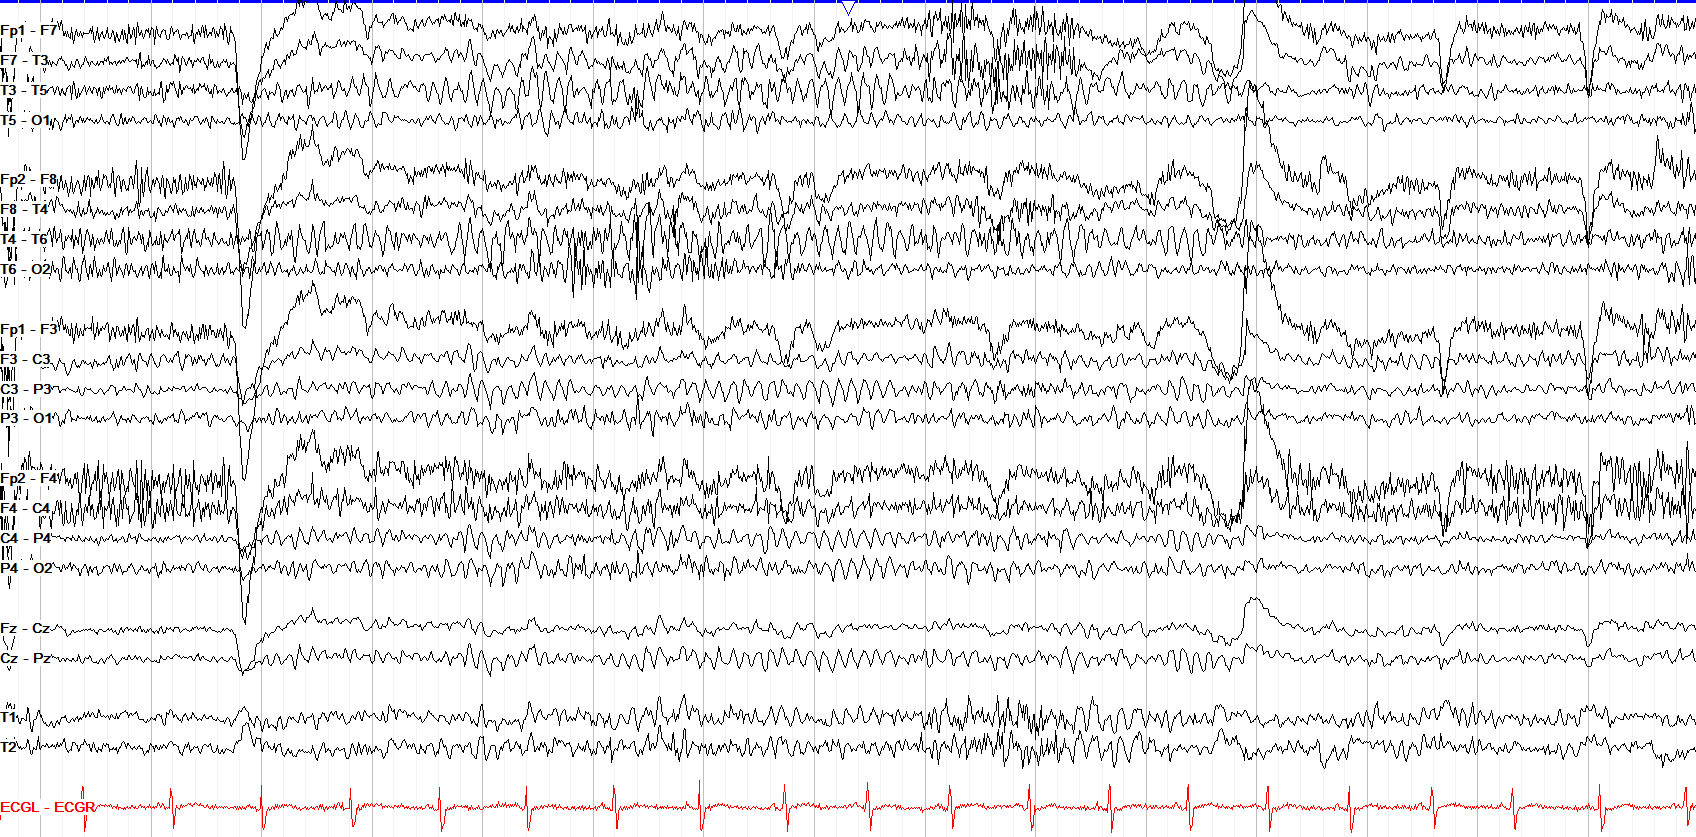
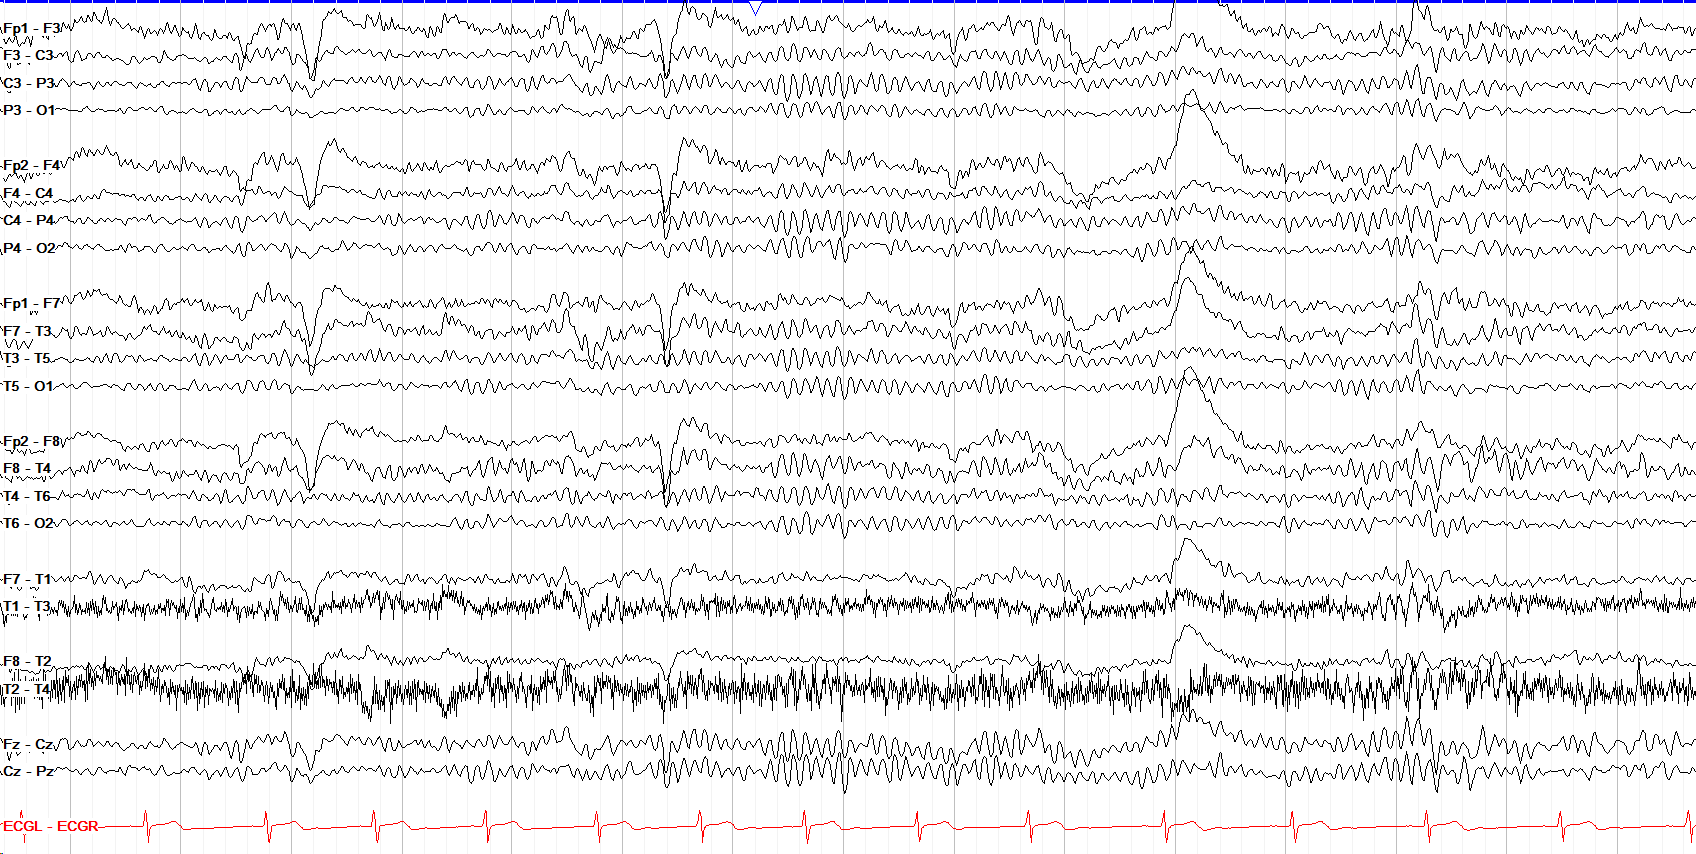
The key to any EEG interpretation is a consistent approach. Look for a good anterior-posterior gradient, which this tracing shows with faster, lower amplitude beta activity in the frontal regions and slower, higher amplitude alpha activity in the occipital regions. Next, find the PDR and ensure it is symmetric in both frequency and amplitude, which this one is. If the PDR is present, the patient is awake, but eye blinks can help to confirm this. Variability and reactivity are almost always present if all of the above factors are present and normal.
Provocation
In many EEG studies, photic stimulation and hyperventilation are performed to provoke the brain and bring forth evidence of underlying seizure risk.
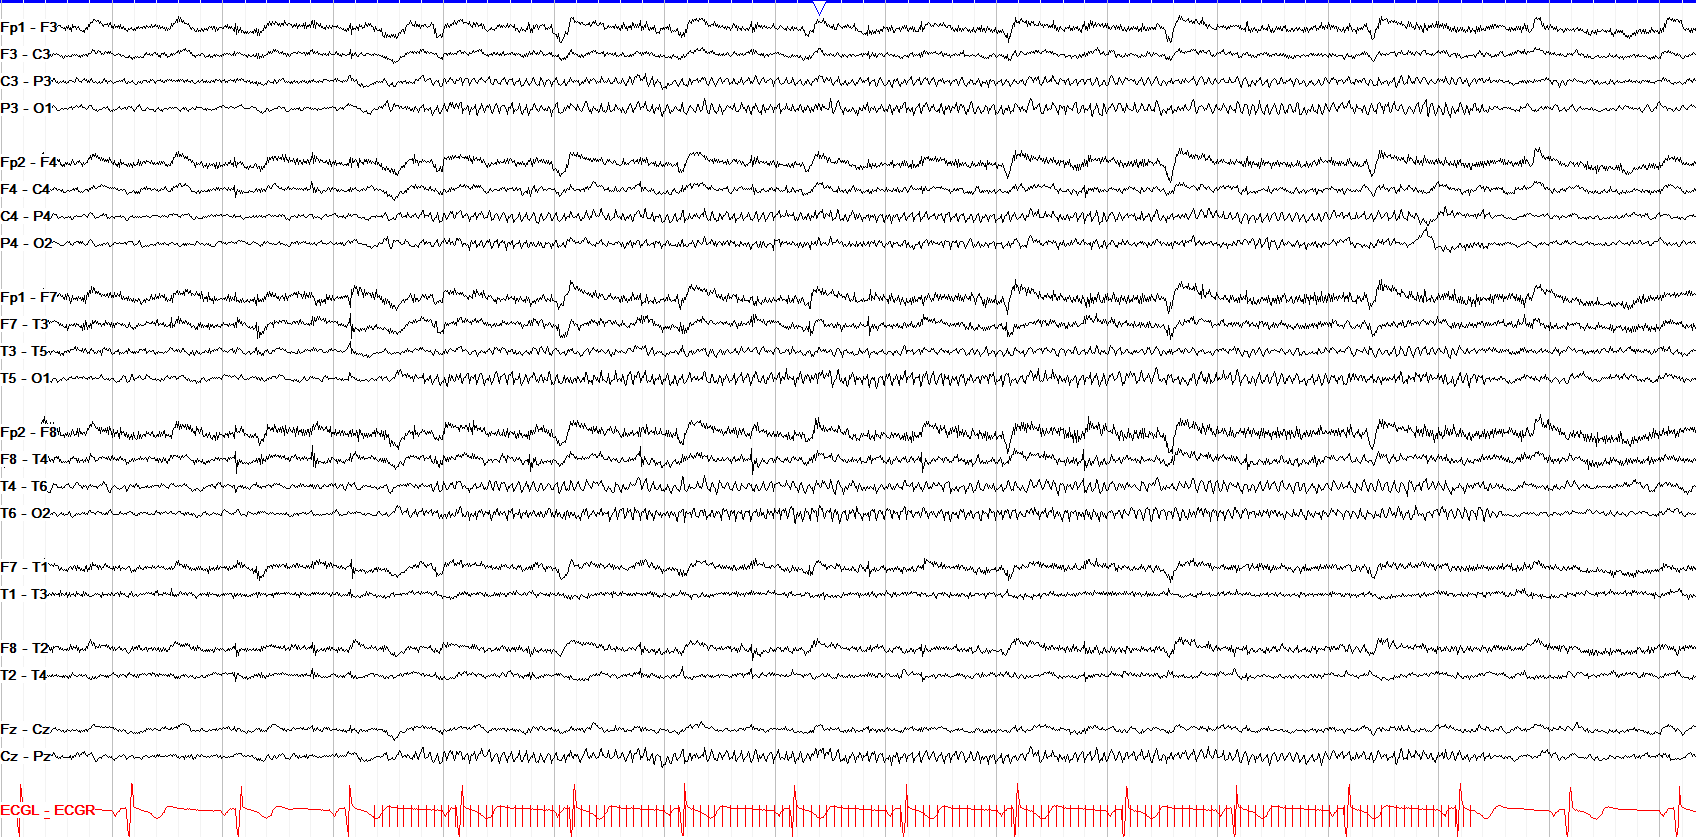
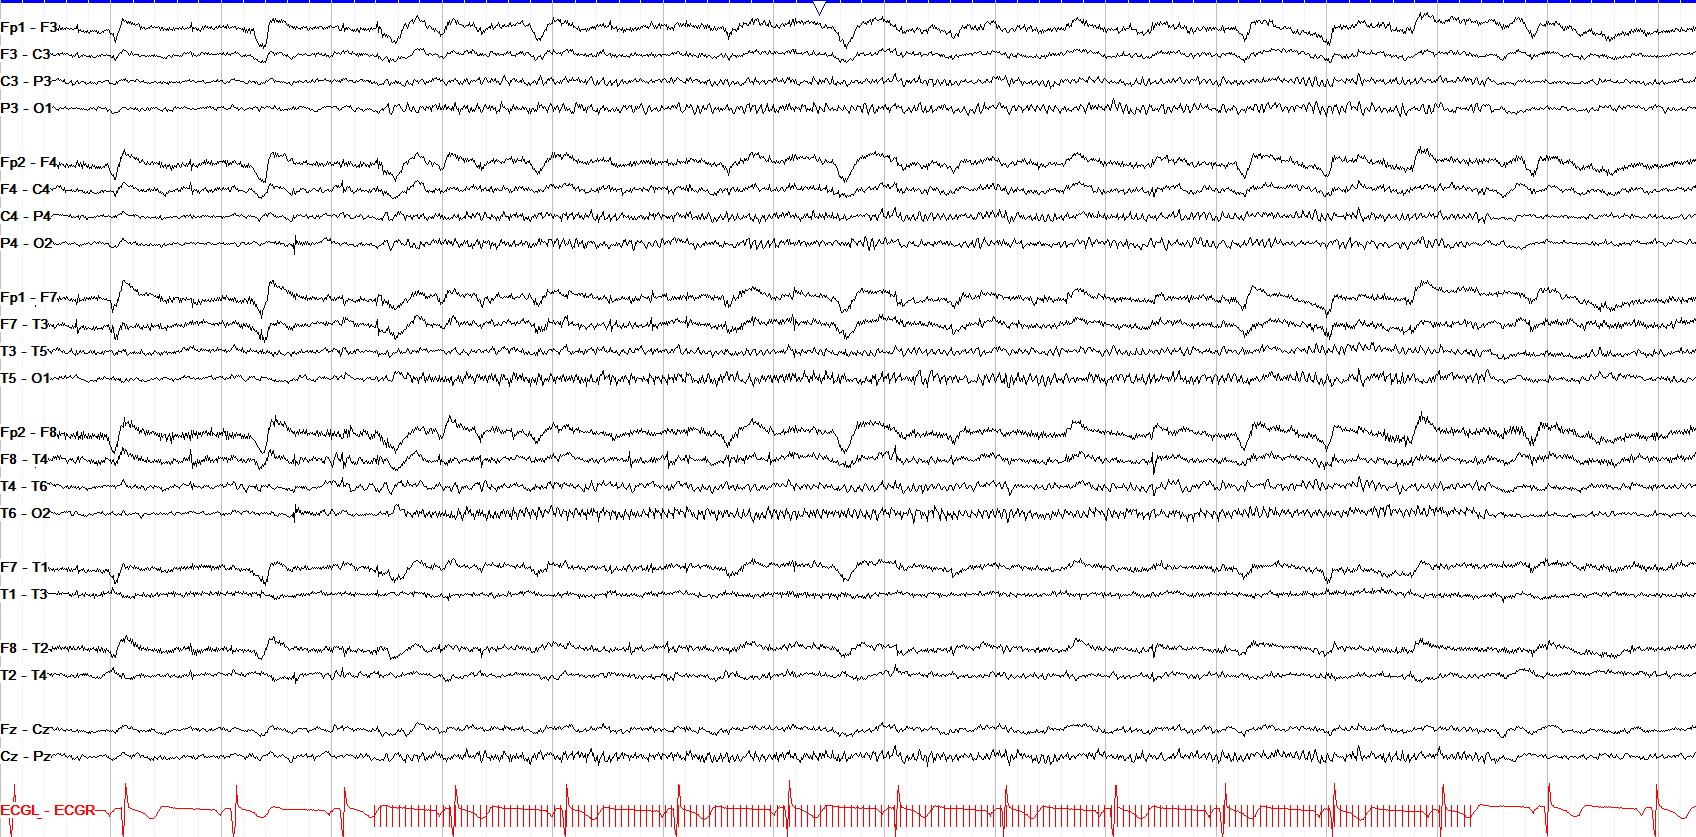
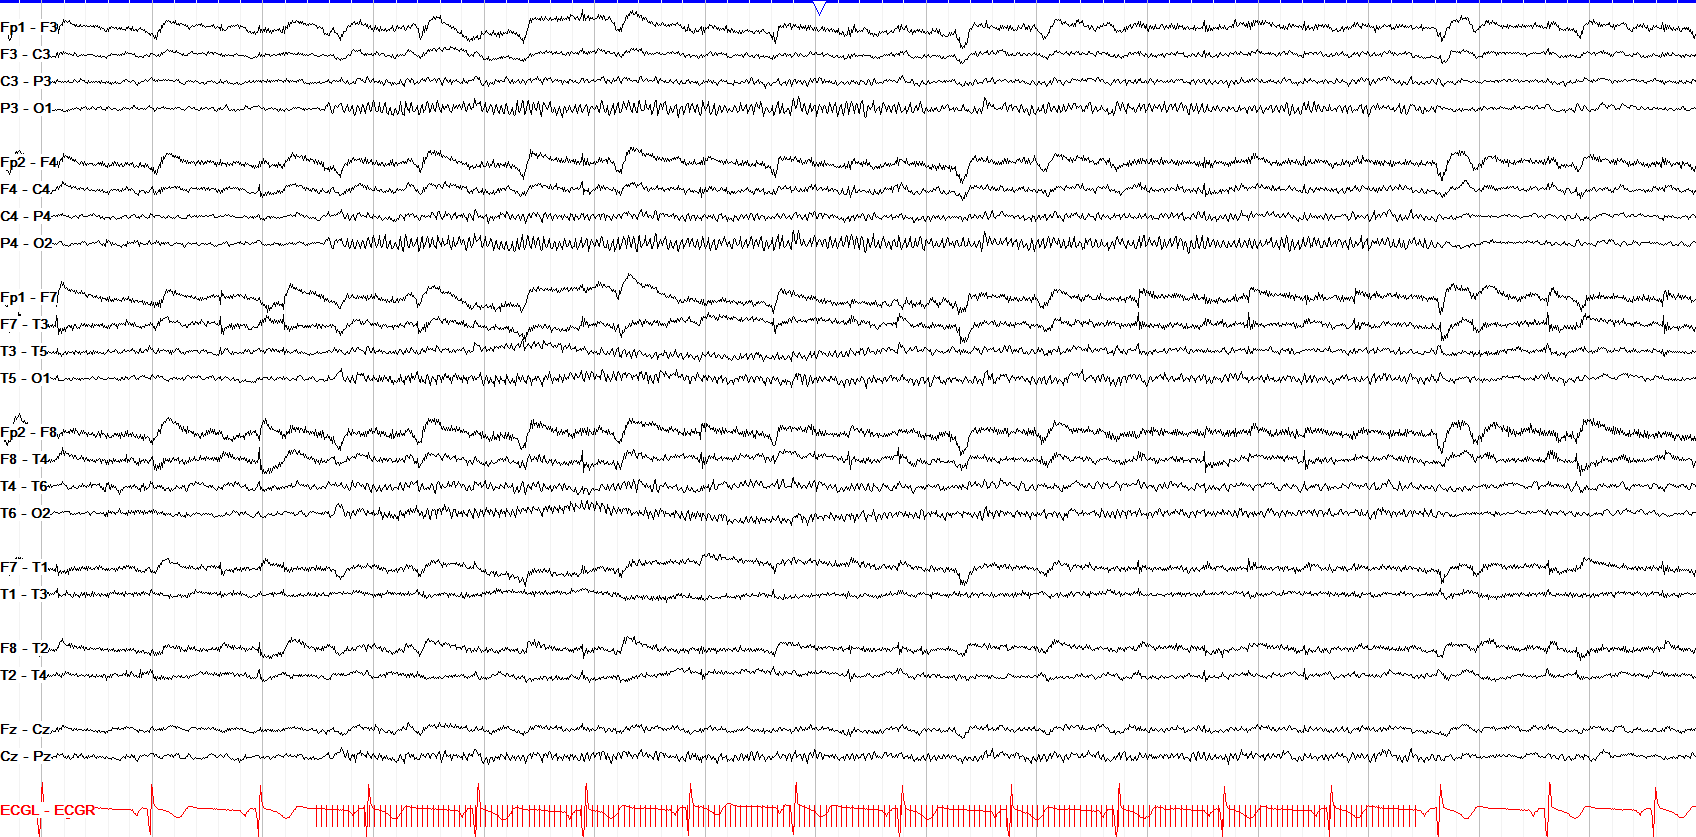
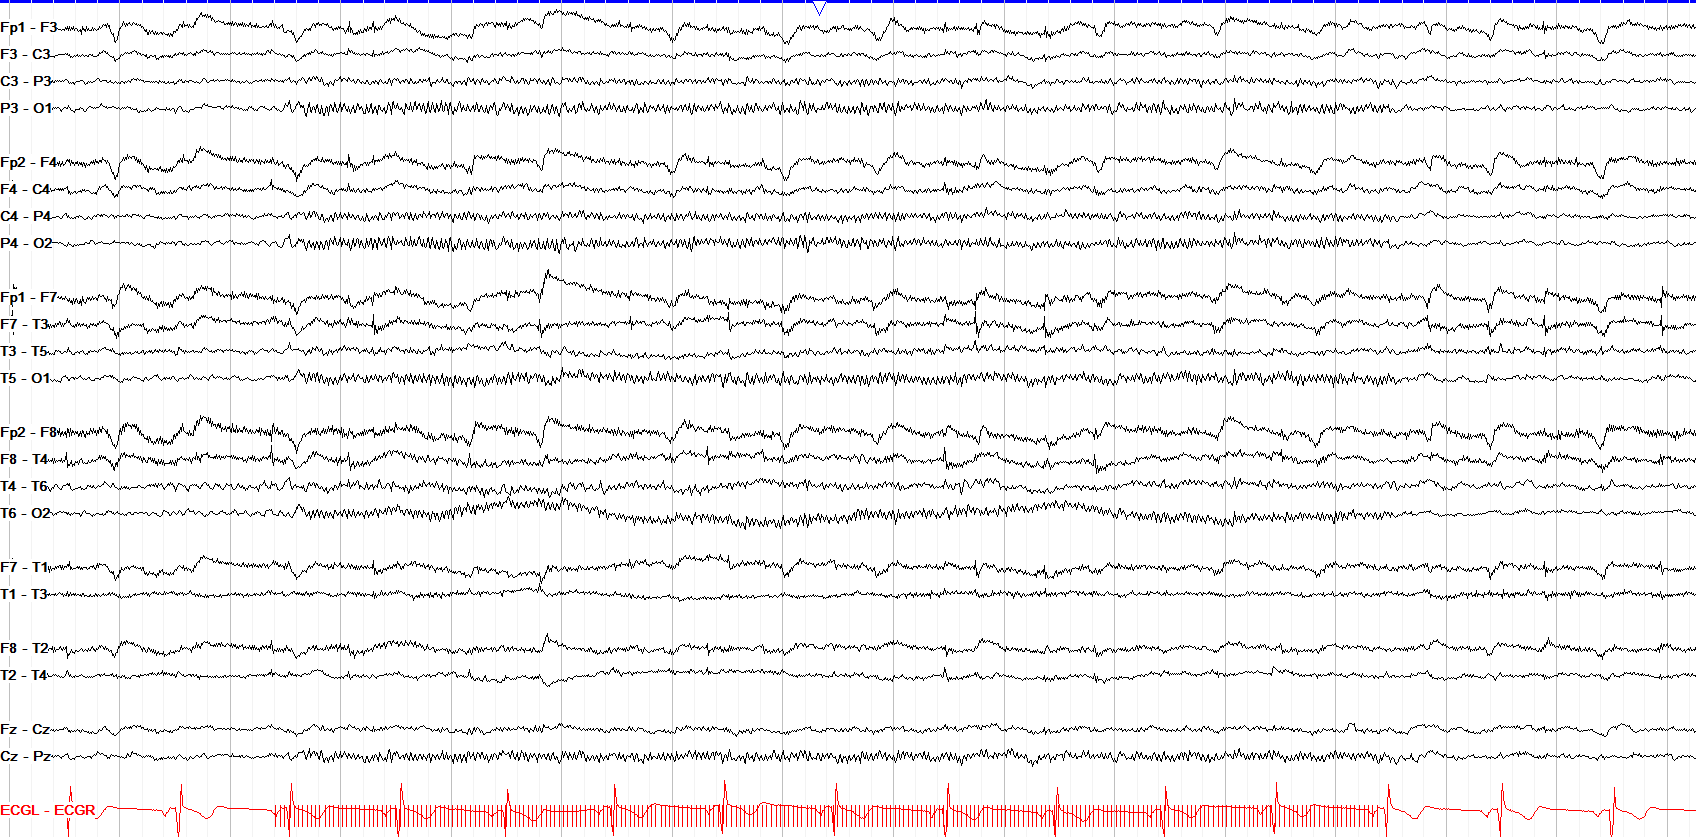
In photic stimulation, a light is flashed in trains of increasing frequencies to look for photic driving, in which the background rhythm becomes time locked and in sync with each light flash. It is a normal response but many patients will not have it on EEG, and that is also normal. A driving response should be largely symmetric in terms of amplitude, and any major asymmetry may be suggestive of underlying dysfunction of the occipital / posterior brain regions. There is a form of driving called harmonic driving in which the background becomes time locked to some multiple of the light flashes; for instance, 5 Hz light flashes lead to a 10 Hz PDR or 6 Hz flashes to a 12 Hz PDR.
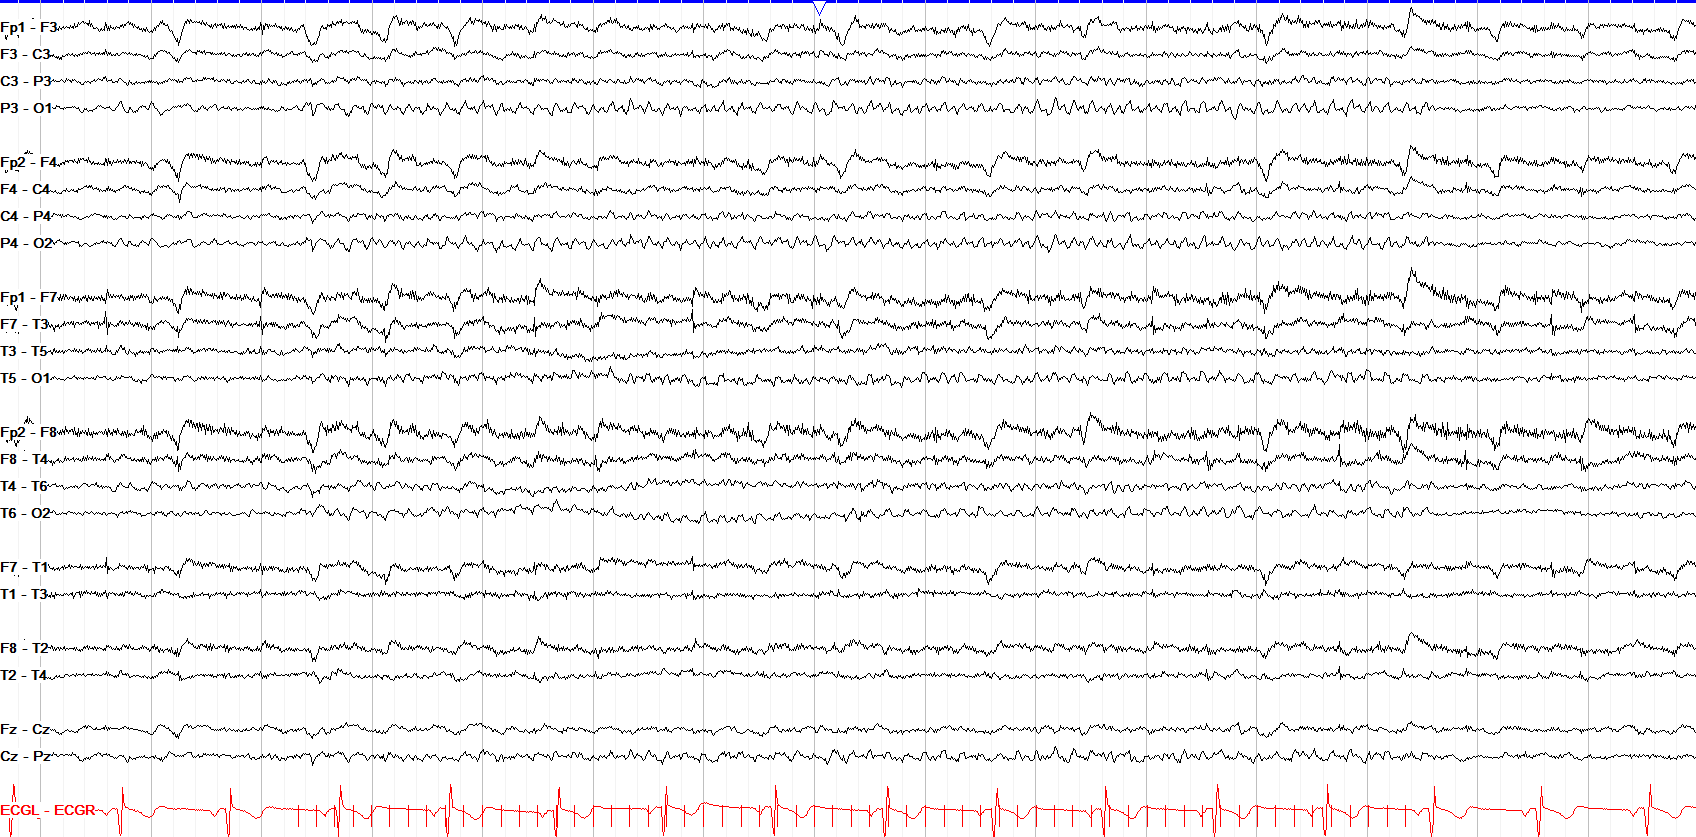
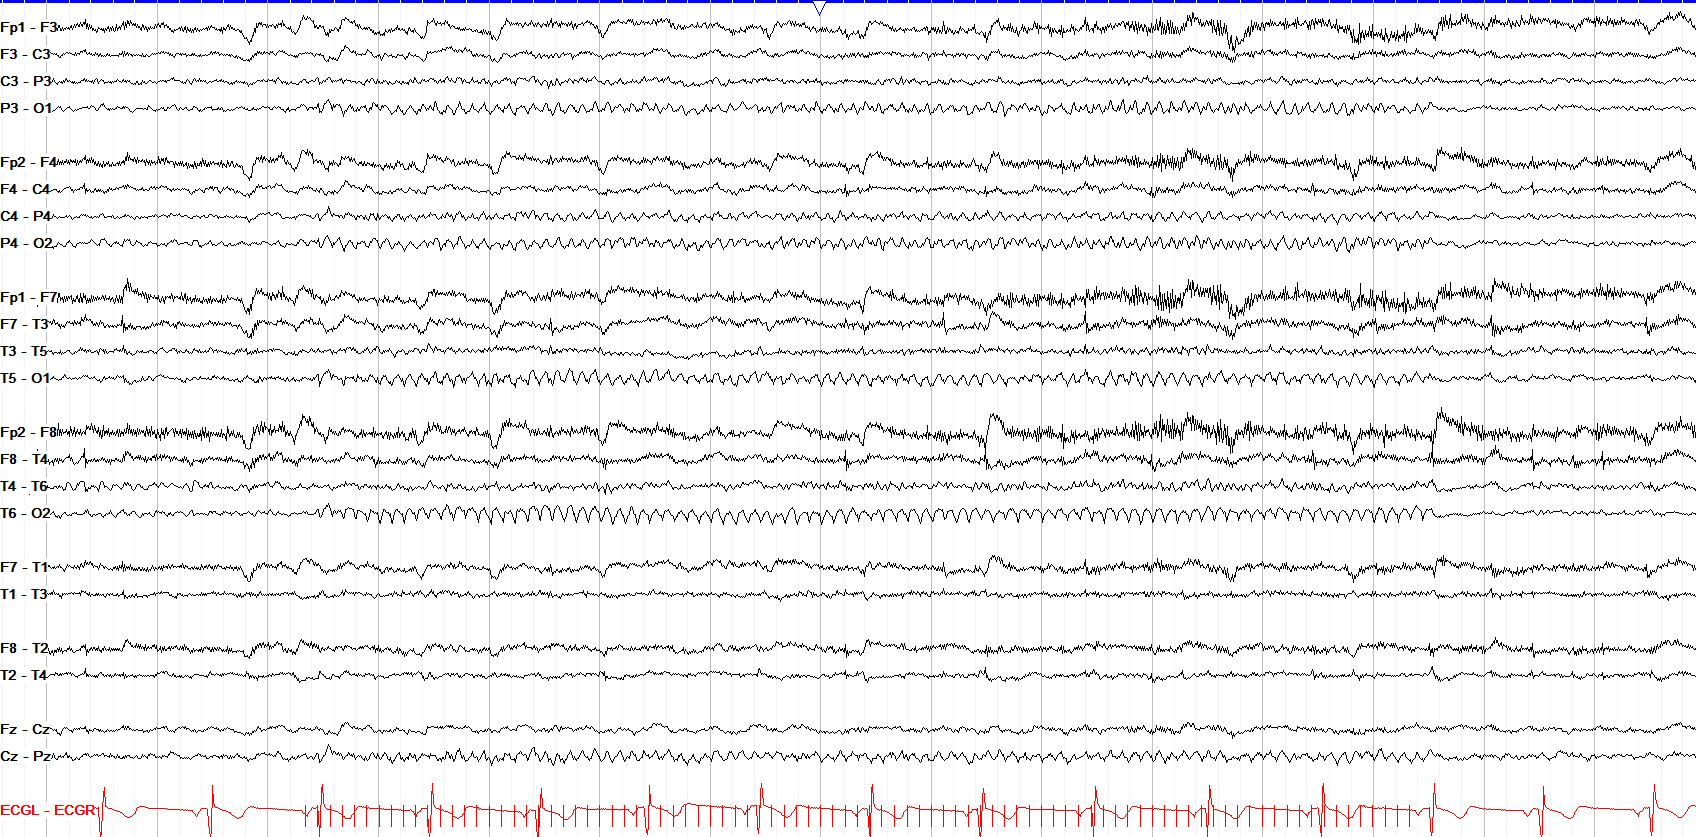
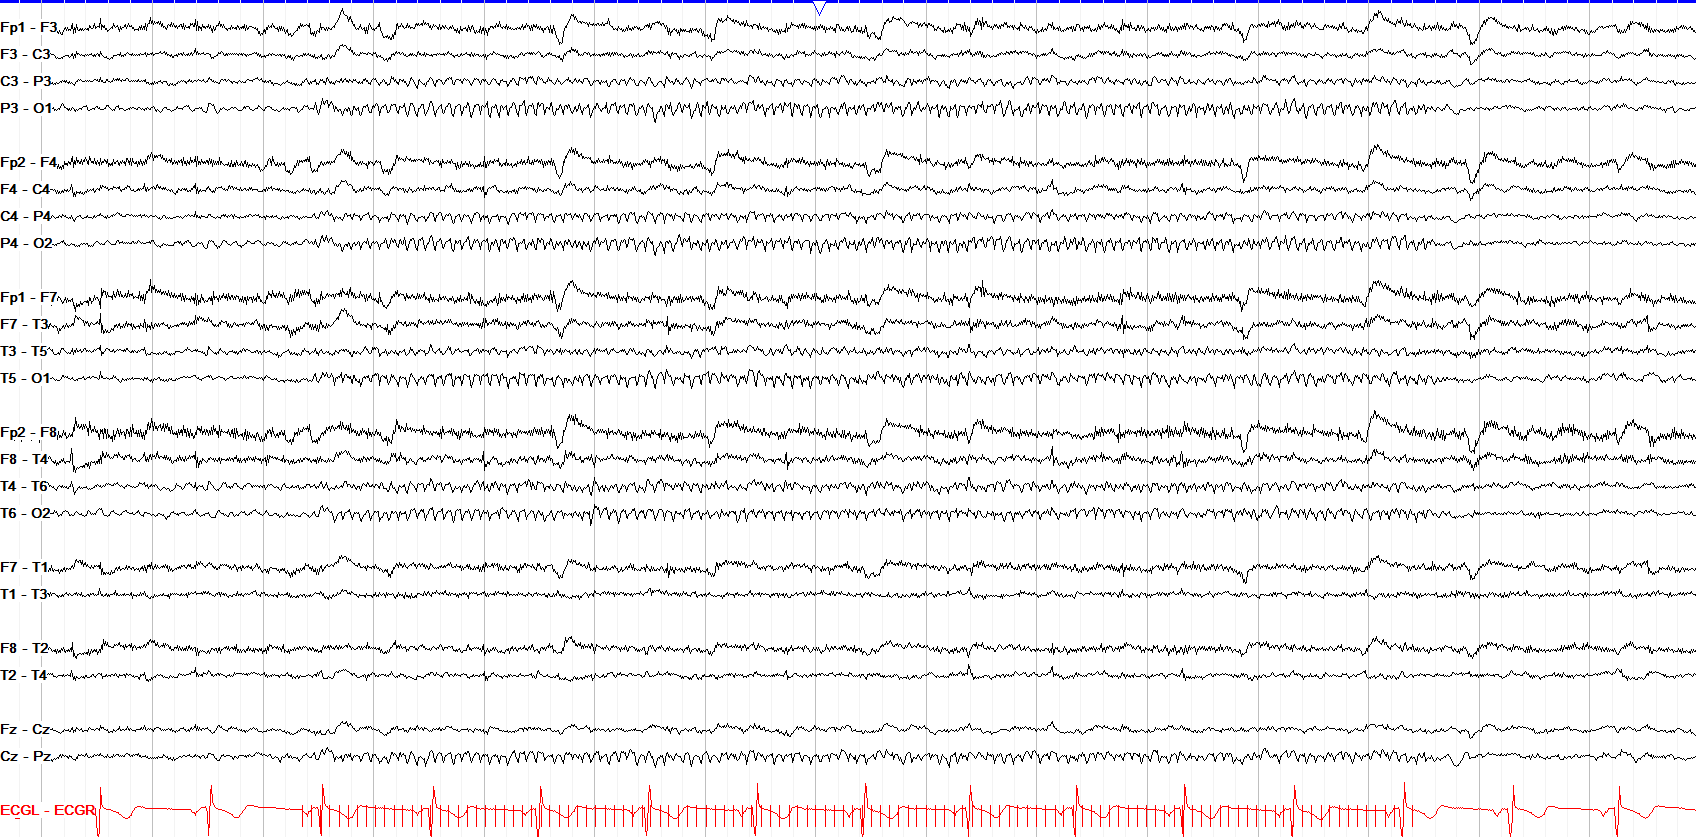
In those with a history of seizures, driving can very rarely give rise to a photoparoxysmal response with epileptiform activity, which is further discussed in the epileptiform abnormalities section. Below is an example of a patient with photic driving from 6 Hz all the way up to 30 Hz; on this tracing, each flash of light is marked with a red line at the bottom of the screen.
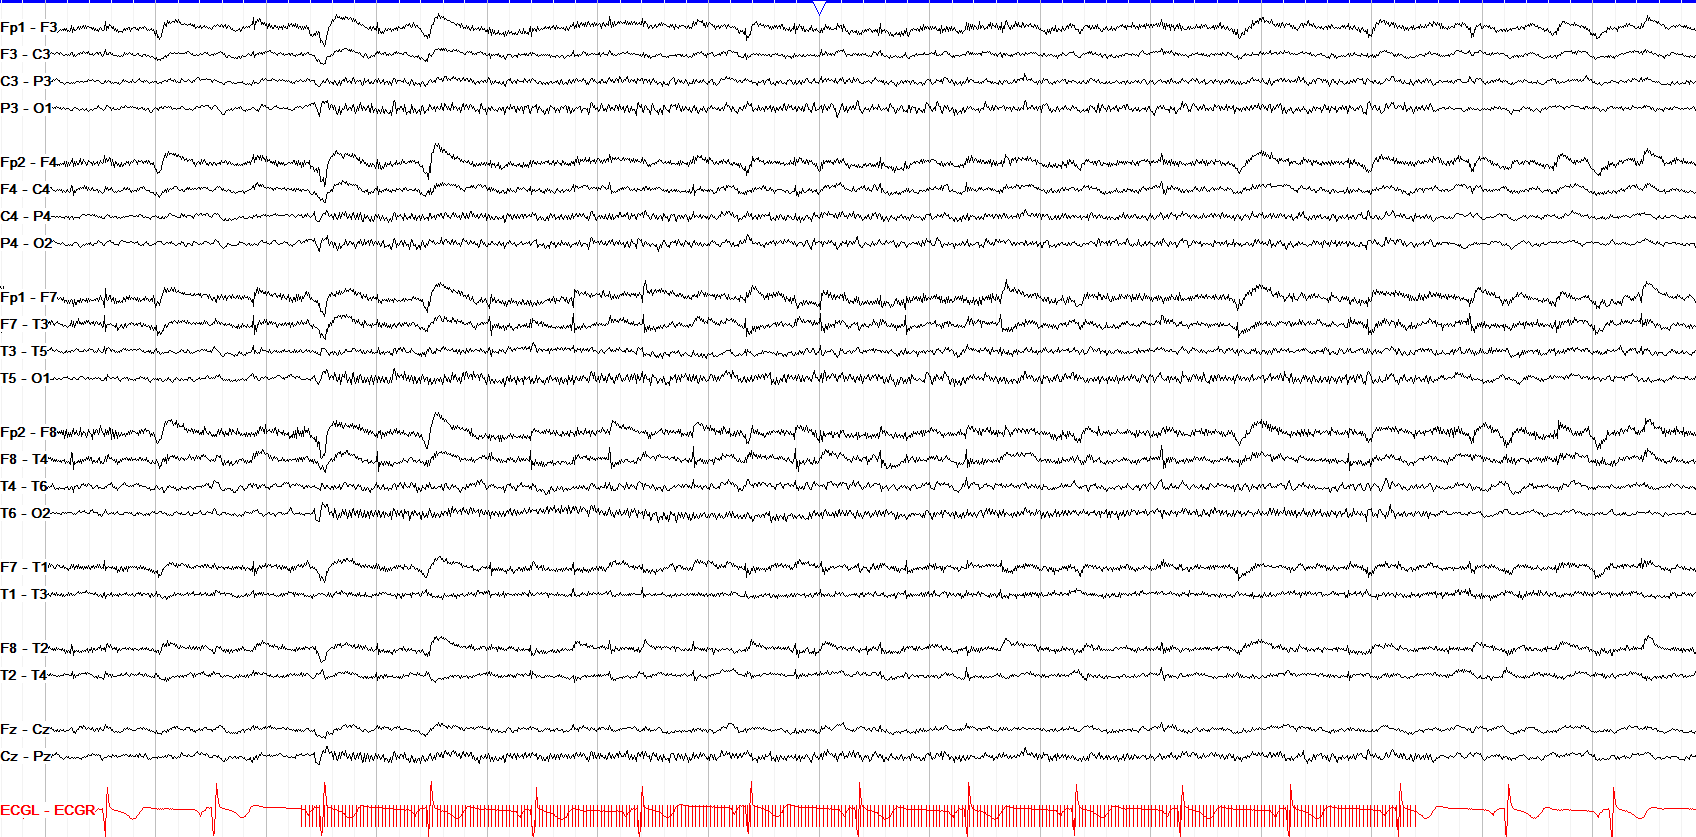
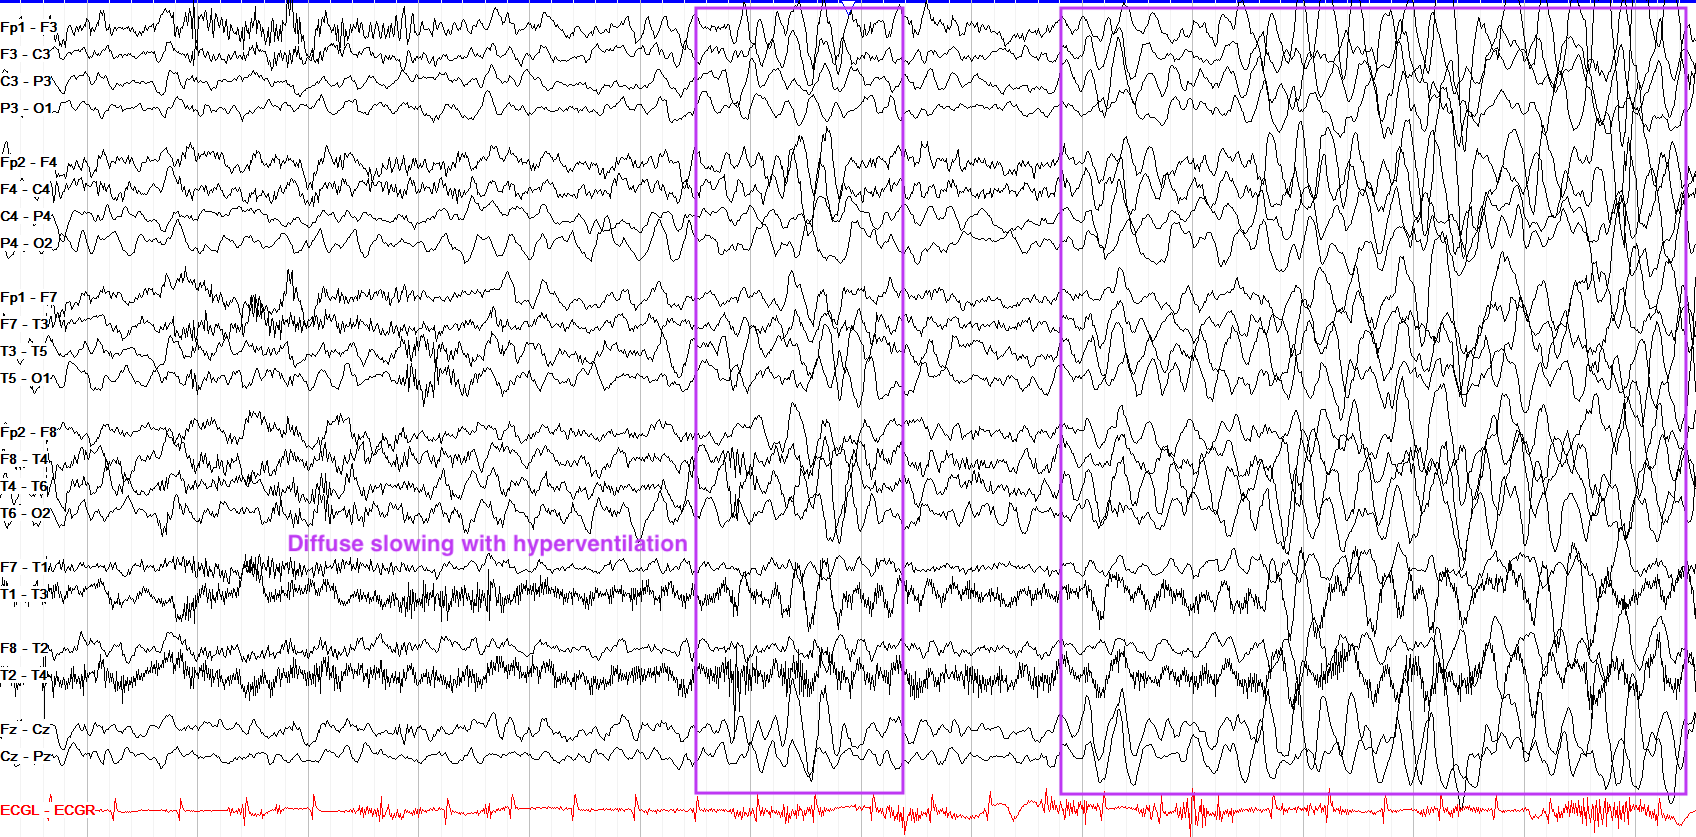
The other major type of provocation is hyperventilation, the prototypical response to which is diffuse slowing though that is not always seen. The classic case for use of hyperventilation in epilepsy is with absence seizures, in which blowing on a pinwheel to induce hyperventilation can often cause brief absence seizures marked by generalized ~3 Hz spike and wave activity (discussed further in the seizures section).
Because it stresses the body as well as the brain, hyperventilation should not be done in patients over 65 years of age, those with chronic respiratory issues, or those with a recent stroke or myocardial infarction.
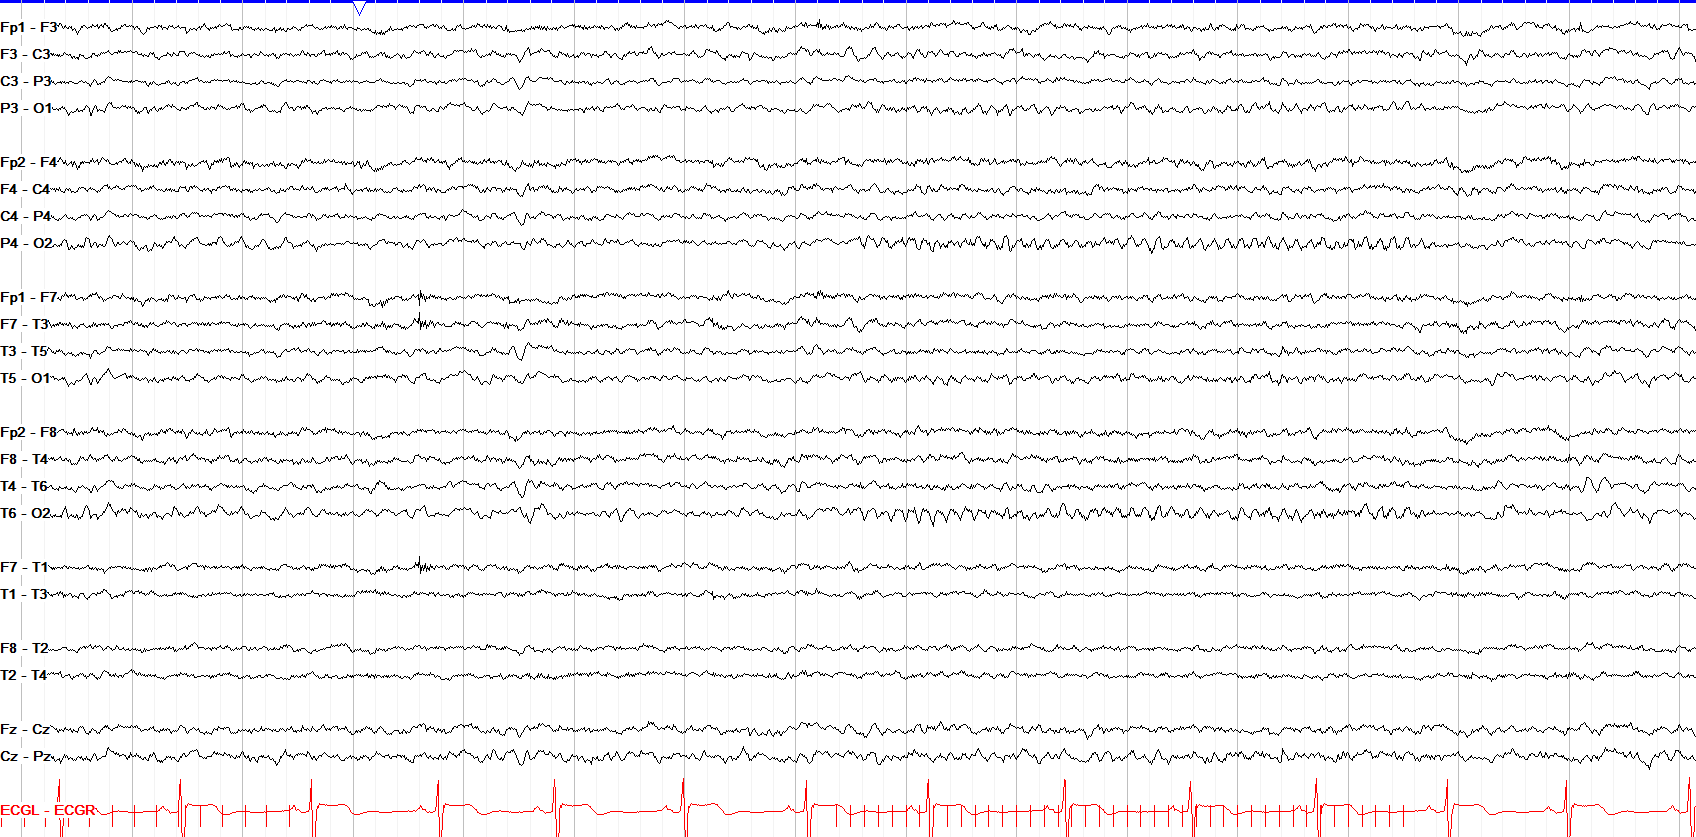
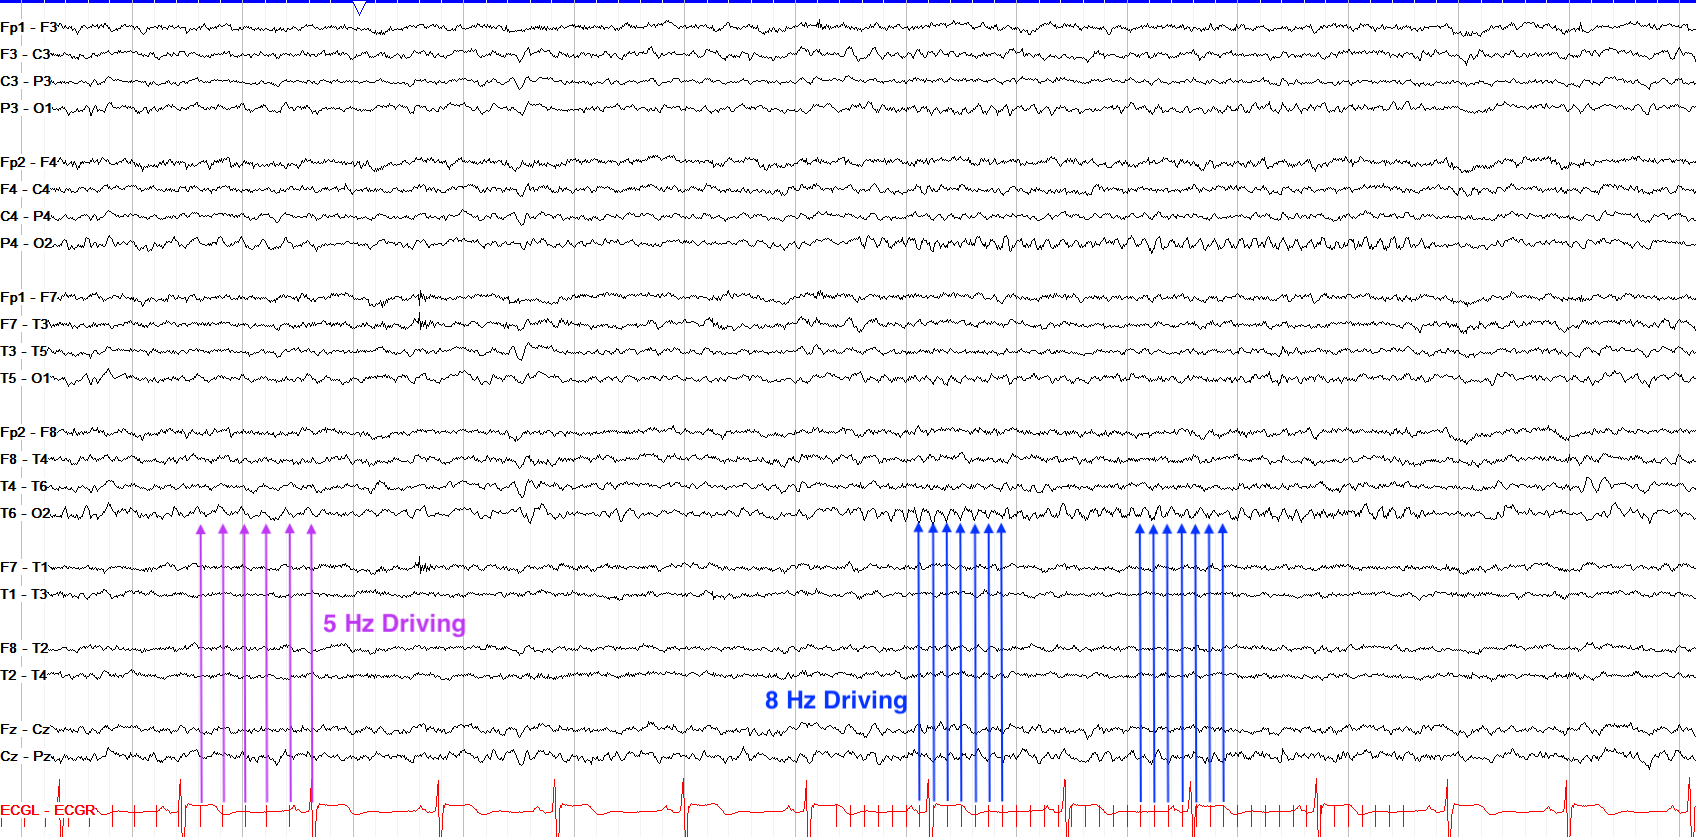
Photic stimulation marks each flash of light on EEG with a line at the bottom of the screen. This tracing shows a portion of a 5 Hz driving period in the first few seconds, then several seconds of no stimulation followed by a period of 8 Hz stimulation. Both the 5 Hz and 8 Hz period show driving, in which the posterior dominant rhythm becomes time locked to the frequency of the photic stimulation. Note the abrupt stop of this synchronization on cessation of the stimulation.
- The background consists of the AP gradient, PDR, variability, reactivity, and state.
- A normal AP gradient is faster in the front and slower in the back.
- A normal PDR is 8.5 - 12 Hz and symmetric in frequency and amplitude.
- Awake tracings should show evidence of second-to-second variability and reactivity.
- Drowsiness is seen as diffuse slowing with emergence of theta, attenuation, and slow roving lateral eye movements.
- Provocations include hyperventilation (can cause generalized slowing) and photic stimulation (can cause photic driving).